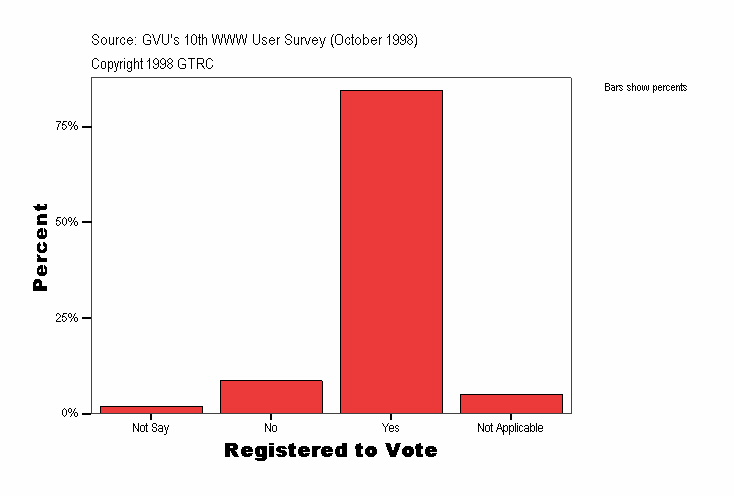
Registered to Vote
|
Frequency |
Percent |
Valid Percent |
Cumulative Percent |
|---|
| Valid |
Not Say |
96
| 1.9
| 1.9
| 1.9
|
|---|
| No |
433
| 8.6
| 8.6
| 10.5
|
|---|
| Yes |
4238
| 84.4
| 84.4
| 94.9
|
|---|
| Not Applicable |
255
| 5.1
| 5.1
| 100.0
|
|---|
| Total |
5022
| 100.0
| 100.0
|
|
|---|
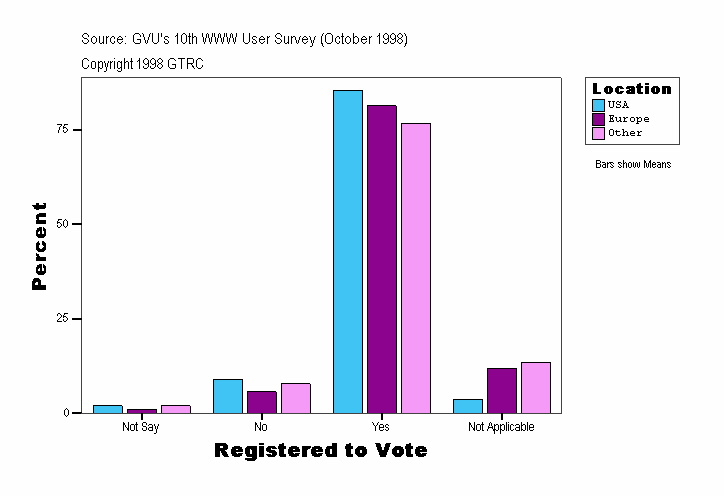
Registered to Vote
| Location |
Frequency |
Percent |
Valid Percent |
Cumulative Percent |
|---|
| USA |
Valid |
Not Say |
84
| 2.0
| 2.0
| 2.0
|
|---|
| No |
381
| 9.0
| 9.0
| 10.9
|
|---|
| Yes |
3632
| 85.4
| 85.4
| 96.3
|
|---|
| Not Applicable |
157
| 3.7
| 3.7
| 100.0
|
|---|
| Total |
4254
| 100.0
| 100.0
|
|
|---|
| Europe |
Valid |
Not Say |
4
| 1.1
| 1.1
| 1.1
|
|---|
| No |
21
| 5.7
| 5.7
| 6.8
|
|---|
| Yes |
300
| 81.3
| 81.3
| 88.1
|
|---|
| Not Applicable |
44
| 11.9
| 11.9
| 100.0
|
|---|
| Total |
369
| 100.0
| 100.0
|
|
|---|
| Other |
Valid |
Not Say |
8
| 2.0
| 2.0
| 2.0
|
|---|
| No |
31
| 7.8
| 7.8
| 9.8
|
|---|
| Yes |
306
| 76.7
| 76.7
| 86.5
|
|---|
| Not Applicable |
54
| 13.5
| 13.5
| 100.0
|
|---|
| Total |
399
| 100.0
| 100.0
|
|
|---|
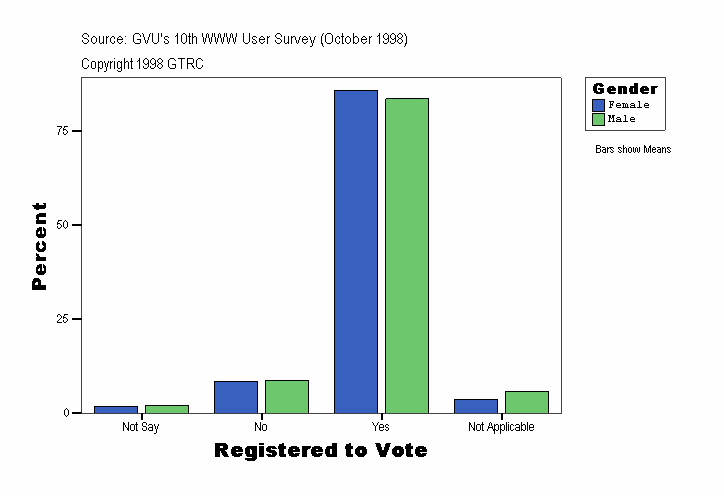
Registered to Vote
| Gender |
Frequency |
Percent |
Valid Percent |
Cumulative Percent |
|---|
| Female |
Valid |
Not Say |
30
| 1.8
| 1.8
| 1.8
|
|---|
| No |
143
| 8.5
| 8.5
| 10.3
|
|---|
| Yes |
1448
| 85.9
| 85.9
| 96.2
|
|---|
| Not Applicable |
64
| 3.8
| 3.8
| 100.0
|
|---|
| Total |
1685
| 100.0
| 100.0
|
|
|---|
| Male |
Valid |
Not Say |
66
| 2.0
| 2.0
| 2.0
|
|---|
| No |
290
| 8.7
| 8.7
| 10.7
|
|---|
| Yes |
2790
| 83.6
| 83.6
| 94.3
|
|---|
| Not Applicable |
191
| 5.7
| 5.7
| 100.0
|
|---|
| Total |
3337
| 100.0
| 100.0
|
|
|---|
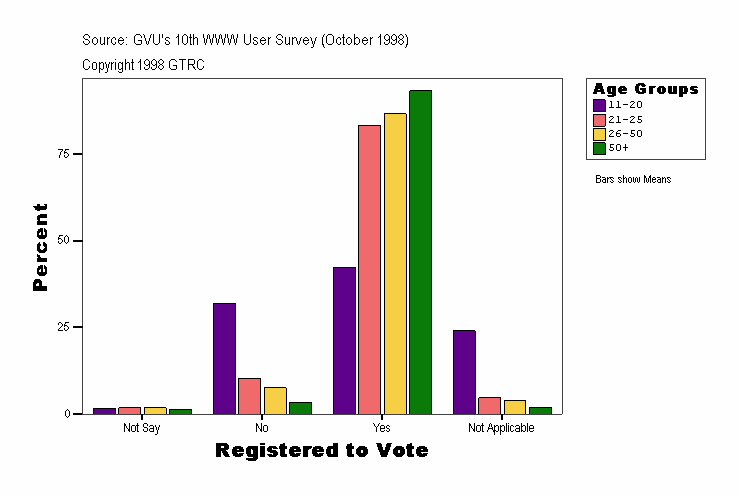
Registered to Vote
| Age Groups |
Frequency |
Percent |
Valid Percent |
Cumulative Percent |
|---|
| . |
Valid |
Not Say |
13
| 15.5
| 15.5
| 15.5
|
|---|
| No |
3
| 3.6
| 3.6
| 19.0
|
|---|
| Yes |
58
| 69.0
| 69.0
| 88.1
|
|---|
| Not Applicable |
10
| 11.9
| 11.9
| 100.0
|
|---|
| Total |
84
| 100.0
| 100.0
|
|
|---|
| 11-20 |
Valid |
Not Say |
5
| 1.7
| 1.7
| 1.7
|
|---|
| No |
96
| 32.0
| 32.0
| 33.7
|
|---|
| Yes |
127
| 42.3
| 42.3
| 76.0
|
|---|
| Not Applicable |
72
| 24.0
| 24.0
| 100.0
|
|---|
| Total |
300
| 100.0
| 100.0
|
|
|---|
| 21-25 |
Valid |
Not Say |
11
| 1.8
| 1.8
| 1.8
|
|---|
| No |
65
| 10.4
| 10.4
| 12.1
|
|---|
| Yes |
522
| 83.3
| 83.3
| 95.4
|
|---|
| Not Applicable |
29
| 4.6
| 4.6
| 100.0
|
|---|
| Total |
627
| 100.0
| 100.0
|
|
|---|
| 26-50 |
Valid |
Not Say |
55
| 1.7
| 1.7
| 1.7
|
|---|
| No |
240
| 7.6
| 7.6
| 9.3
|
|---|
| Yes |
2748
| 86.7
| 86.7
| 96.0
|
|---|
| Not Applicable |
128
| 4.0
| 4.0
| 100.0
|
|---|
| Total |
3171
| 100.0
| 100.0
|
|
|---|
| 50+ |
Valid |
Not Say |
12
| 1.4
| 1.4
| 1.4
|
|---|
| No |
29
| 3.5
| 3.5
| 4.9
|
|---|
| Yes |
783
| 93.2
| 93.2
| 98.1
|
|---|
| Not Applicable |
16
| 1.9
| 1.9
| 100.0
|
|---|
| Total |
840
| 100.0
| 100.0
|
|
|---|
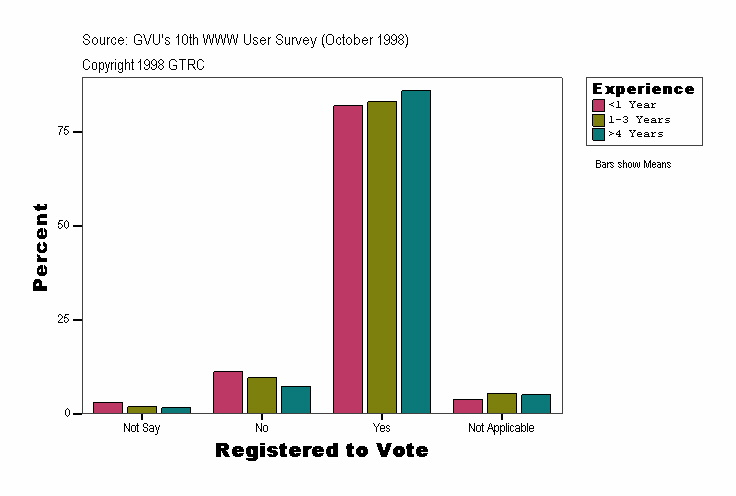
Registered to Vote
| Experience |
Frequency |
Percent |
Valid Percent |
Cumulative Percent |
|---|
| <1 Year |
Valid |
Not Say |
20
| 3.1
| 3.1
| 3.1
|
|---|
| No |
73
| 11.2
| 11.2
| 14.2
|
|---|
| Yes |
535
| 81.9
| 81.9
| 96.2
|
|---|
| Not Applicable |
25
| 3.8
| 3.8
| 100.0
|
|---|
| Total |
653
| 100.0
| 100.0
|
|
|---|
| 1-3 Years |
Valid |
Not Say |
33
| 1.9
| 1.9
| 1.9
|
|---|
| No |
166
| 9.6
| 9.6
| 11.5
|
|---|
| Yes |
1441
| 83.0
| 83.0
| 94.5
|
|---|
| Not Applicable |
96
| 5.5
| 5.5
| 100.0
|
|---|
| Total |
1736
| 100.0
| 100.0
|
|
|---|
| >4 Years |
Valid |
Not Say |
43
| 1.6
| 1.6
| 1.6
|
|---|
| No |
194
| 7.4
| 7.4
| 9.0
|
|---|
| Yes |
2262
| 85.9
| 85.9
| 94.9
|
|---|
| Not Applicable |
134
| 5.1
| 5.1
| 100.0
|
|---|
| Total |
2633
| 100.0
| 100.0
|
|
|---|
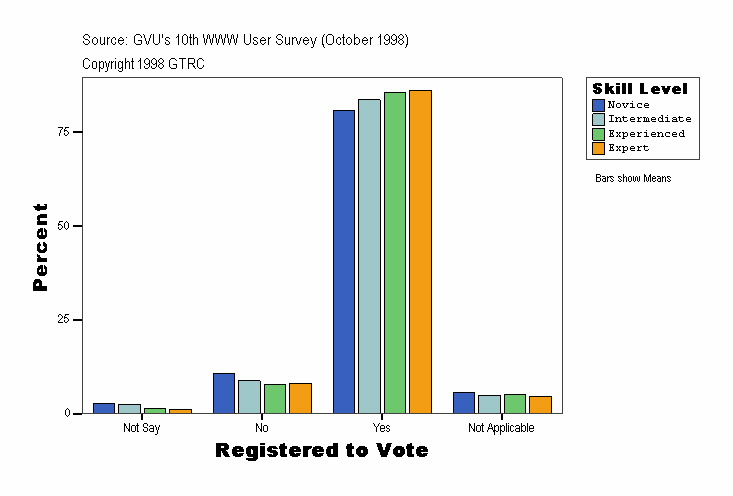
Registered to Vote
| Skill Level |
Frequency |
Percent |
Valid Percent |
Cumulative Percent |
|---|
| Novice |
Valid |
Not Say |
23
| 2.8
| 2.8
| 2.8
|
|---|
| No |
87
| 10.8
| 10.8
| 13.6
|
|---|
| Yes |
653
| 80.8
| 80.8
| 94.4
|
|---|
| Not Applicable |
45
| 5.6
| 5.6
| 100.0
|
|---|
| Total |
808
| 100.0
| 100.0
|
|
|---|
| Intermediate |
Valid |
Not Say |
37
| 2.6
| 2.6
| 2.6
|
|---|
| No |
126
| 8.8
| 8.8
| 11.4
|
|---|
| Yes |
1201
| 83.7
| 83.7
| 95.1
|
|---|
| Not Applicable |
71
| 4.9
| 4.9
| 100.0
|
|---|
| Total |
1435
| 100.0
| 100.0
|
|
|---|
| Experienced |
Valid |
Not Say |
26
| 1.4
| 1.4
| 1.4
|
|---|
| No |
145
| 7.8
| 7.8
| 9.2
|
|---|
| Yes |
1588
| 85.6
| 85.6
| 94.8
|
|---|
| Not Applicable |
96
| 5.2
| 5.2
| 100.0
|
|---|
| Total |
1855
| 100.0
| 100.0
|
|
|---|
| Expert |
Valid |
Not Say |
10
| 1.1
| 1.1
| 1.1
|
|---|
| No |
75
| 8.1
| 8.1
| 9.2
|
|---|
| Yes |
796
| 86.1
| 86.1
| 95.3
|
|---|
| Not Applicable |
43
| 4.7
| 4.7
| 100.0
|
|---|
| Total |
924
| 100.0
| 100.0
|
|
|---|
Source: GVU's Tenth WWW User Survey (Conducted October 1998)
URL:http://www.gvu.gatech.edu/user_surveys/
Copyright 1998 GTRC - ALL RIGHTS RESERVED
Contact: www-survey@cc.gatech.edu
For more information or to submit comments:
send email to www-survey@cc.gatech.edu.
GVU's WWW Surveying Team
Graphics, Visualization, & Usability Center
College of Computing
Georgia Institute of Technology
Atlanta, GA 30332-0280
