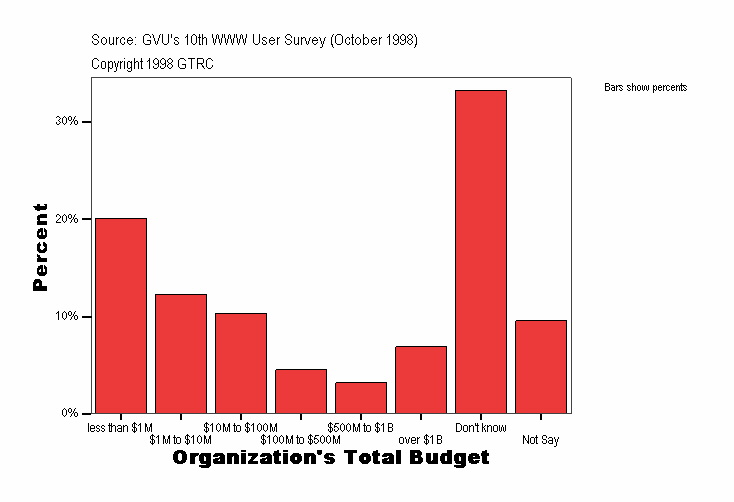
Organization's Total Budget
|
Frequency |
Percent |
Valid Percent |
Cumulative Percent |
|---|
| Valid |
less than $1M |
1007
| 20.1
| 20.1
| 20.1
|
|---|
| $1M to $10M |
617
| 12.3
| 12.3
| 32.3
|
|---|
| $10M to $100M |
517
| 10.3
| 10.3
| 42.6
|
|---|
| $100M to $500M |
227
| 4.5
| 4.5
| 47.2
|
|---|
| $500M to $1B |
160
| 3.2
| 3.2
| 50.3
|
|---|
| over $1B |
346
| 6.9
| 6.9
| 57.2
|
|---|
| Don't know |
1668
| 33.2
| 33.2
| 90.4
|
|---|
| Not Say |
480
| 9.6
| 9.6
| 100.0
|
|---|
| Total |
5022
| 100.0
| 100.0
|
|
|---|
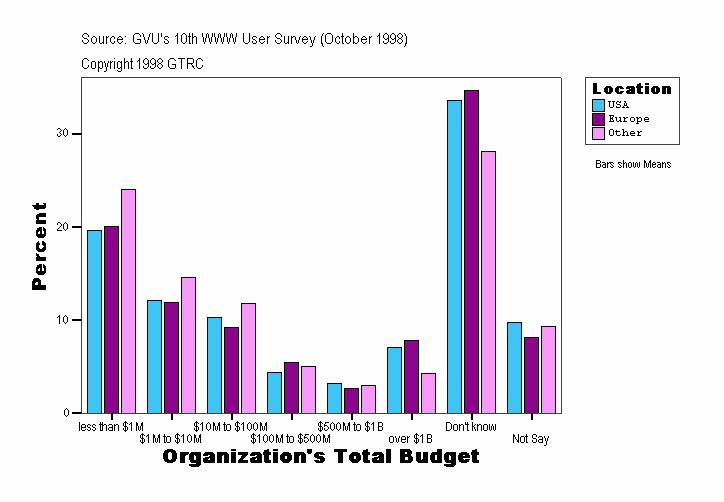
Organization's Total Budget
| Location |
Frequency |
Percent |
Valid Percent |
Cumulative Percent |
|---|
| USA |
Valid |
less than $1M |
837
| 19.7
| 19.7
| 19.7
|
|---|
| $1M to $10M |
515
| 12.1
| 12.1
| 31.8
|
|---|
| $10M to $100M |
436
| 10.2
| 10.2
| 42.0
|
|---|
| $100M to $500M |
187
| 4.4
| 4.4
| 46.4
|
|---|
| $500M to $1B |
138
| 3.2
| 3.2
| 49.7
|
|---|
| over $1B |
300
| 7.1
| 7.1
| 56.7
|
|---|
| Don't know |
1428
| 33.6
| 33.6
| 90.3
|
|---|
| Not Say |
413
| 9.7
| 9.7
| 100.0
|
|---|
| Total |
4254
| 100.0
| 100.0
|
|
|---|
| Europe |
Valid |
less than $1M |
74
| 20.1
| 20.1
| 20.1
|
|---|
| $1M to $10M |
44
| 11.9
| 11.9
| 32.0
|
|---|
| $10M to $100M |
34
| 9.2
| 9.2
| 41.2
|
|---|
| $100M to $500M |
20
| 5.4
| 5.4
| 46.6
|
|---|
| $500M to $1B |
10
| 2.7
| 2.7
| 49.3
|
|---|
| over $1B |
29
| 7.9
| 7.9
| 57.2
|
|---|
| Don't know |
128
| 34.7
| 34.7
| 91.9
|
|---|
| Not Say |
30
| 8.1
| 8.1
| 100.0
|
|---|
| Total |
369
| 100.0
| 100.0
|
|
|---|
| Other |
Valid |
less than $1M |
96
| 24.1
| 24.1
| 24.1
|
|---|
| $1M to $10M |
58
| 14.5
| 14.5
| 38.6
|
|---|
| $10M to $100M |
47
| 11.8
| 11.8
| 50.4
|
|---|
| $100M to $500M |
20
| 5.0
| 5.0
| 55.4
|
|---|
| $500M to $1B |
12
| 3.0
| 3.0
| 58.4
|
|---|
| over $1B |
17
| 4.3
| 4.3
| 62.7
|
|---|
| Don't know |
112
| 28.1
| 28.1
| 90.7
|
|---|
| Not Say |
37
| 9.3
| 9.3
| 100.0
|
|---|
| Total |
399
| 100.0
| 100.0
|
|
|---|
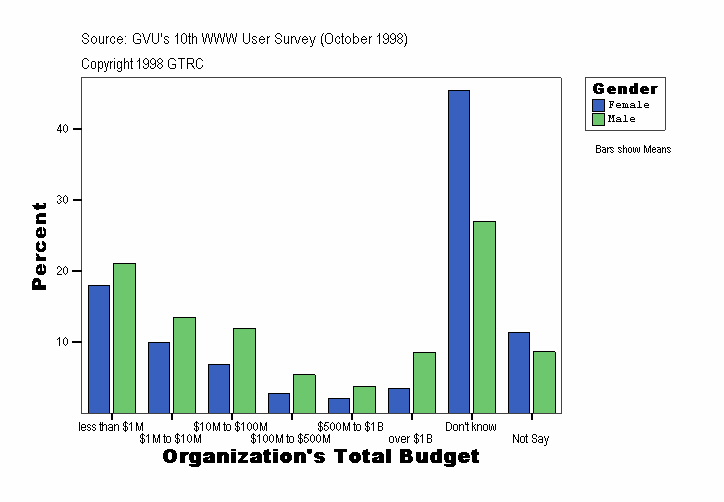
Organization's Total Budget
| Gender |
Frequency |
Percent |
Valid Percent |
Cumulative Percent |
|---|
| Female |
Valid |
less than $1M |
303
| 18.0
| 18.0
| 18.0
|
|---|
| $1M to $10M |
167
| 9.9
| 9.9
| 27.9
|
|---|
| $10M to $100M |
117
| 6.9
| 6.9
| 34.8
|
|---|
| $100M to $500M |
46
| 2.7
| 2.7
| 37.6
|
|---|
| $500M to $1B |
34
| 2.0
| 2.0
| 39.6
|
|---|
| over $1B |
60
| 3.6
| 3.6
| 43.1
|
|---|
| Don't know |
767
| 45.5
| 45.5
| 88.7
|
|---|
| Not Say |
191
| 11.3
| 11.3
| 100.0
|
|---|
| Total |
1685
| 100.0
| 100.0
|
|
|---|
| Male |
Valid |
less than $1M |
704
| 21.1
| 21.1
| 21.1
|
|---|
| $1M to $10M |
450
| 13.5
| 13.5
| 34.6
|
|---|
| $10M to $100M |
400
| 12.0
| 12.0
| 46.6
|
|---|
| $100M to $500M |
181
| 5.4
| 5.4
| 52.0
|
|---|
| $500M to $1B |
126
| 3.8
| 3.8
| 55.8
|
|---|
| over $1B |
286
| 8.6
| 8.6
| 64.3
|
|---|
| Don't know |
901
| 27.0
| 27.0
| 91.3
|
|---|
| Not Say |
289
| 8.7
| 8.7
| 100.0
|
|---|
| Total |
3337
| 100.0
| 100.0
|
|
|---|
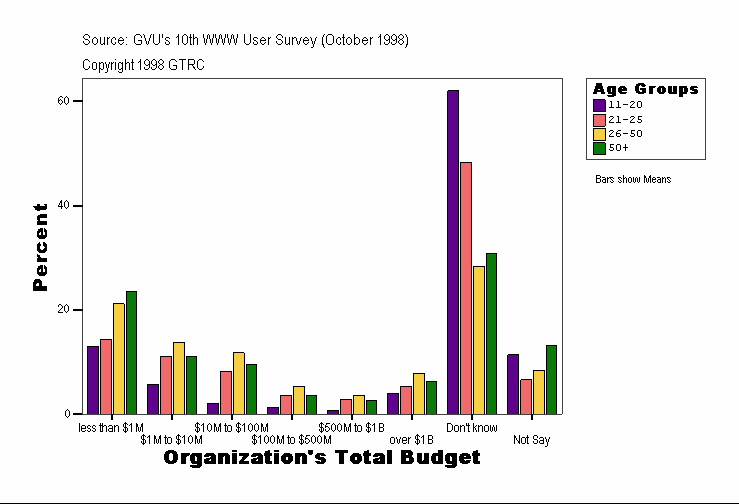
Organization's Total Budget
| Age Groups |
Frequency |
Percent |
Valid Percent |
Cumulative Percent |
|---|
| . |
Valid |
less than $1M |
11
| 13.1
| 13.1
| 13.1
|
|---|
| $1M to $10M |
3
| 3.6
| 3.6
| 16.7
|
|---|
| $10M to $100M |
7
| 8.3
| 8.3
| 25.0
|
|---|
| $100M to $500M |
3
| 3.6
| 3.6
| 28.6
|
|---|
| $500M to $1B |
5
| 6.0
| 6.0
| 34.5
|
|---|
| over $1B |
3
| 3.6
| 3.6
| 38.1
|
|---|
| Don't know |
23
| 27.4
| 27.4
| 65.5
|
|---|
| Not Say |
29
| 34.5
| 34.5
| 100.0
|
|---|
| Total |
84
| 100.0
| 100.0
|
|
|---|
| 11-20 |
Valid |
less than $1M |
39
| 13.0
| 13.0
| 13.0
|
|---|
| $1M to $10M |
17
| 5.7
| 5.7
| 18.7
|
|---|
| $10M to $100M |
6
| 2.0
| 2.0
| 20.7
|
|---|
| $100M to $500M |
4
| 1.3
| 1.3
| 22.0
|
|---|
| $500M to $1B |
2
| .7
| .7
| 22.7
|
|---|
| over $1B |
12
| 4.0
| 4.0
| 26.7
|
|---|
| Don't know |
186
| 62.0
| 62.0
| 88.7
|
|---|
| Not Say |
34
| 11.3
| 11.3
| 100.0
|
|---|
| Total |
300
| 100.0
| 100.0
|
|
|---|
| 21-25 |
Valid |
less than $1M |
90
| 14.4
| 14.4
| 14.4
|
|---|
| $1M to $10M |
69
| 11.0
| 11.0
| 25.4
|
|---|
| $10M to $100M |
51
| 8.1
| 8.1
| 33.5
|
|---|
| $100M to $500M |
22
| 3.5
| 3.5
| 37.0
|
|---|
| $500M to $1B |
18
| 2.9
| 2.9
| 39.9
|
|---|
| over $1B |
33
| 5.3
| 5.3
| 45.1
|
|---|
| Don't know |
303
| 48.3
| 48.3
| 93.5
|
|---|
| Not Say |
41
| 6.5
| 6.5
| 100.0
|
|---|
| Total |
627
| 100.0
| 100.0
|
|
|---|
| 26-50 |
Valid |
less than $1M |
670
| 21.1
| 21.1
| 21.1
|
|---|
| $1M to $10M |
436
| 13.7
| 13.7
| 34.9
|
|---|
| $10M to $100M |
373
| 11.8
| 11.8
| 46.6
|
|---|
| $100M to $500M |
168
| 5.3
| 5.3
| 51.9
|
|---|
| $500M to $1B |
114
| 3.6
| 3.6
| 55.5
|
|---|
| over $1B |
246
| 7.8
| 7.8
| 63.3
|
|---|
| Don't know |
898
| 28.3
| 28.3
| 91.6
|
|---|
| Not Say |
266
| 8.4
| 8.4
| 100.0
|
|---|
| Total |
3171
| 100.0
| 100.0
|
|
|---|
| 50+ |
Valid |
less than $1M |
197
| 23.5
| 23.5
| 23.5
|
|---|
| $1M to $10M |
92
| 11.0
| 11.0
| 34.4
|
|---|
| $10M to $100M |
80
| 9.5
| 9.5
| 43.9
|
|---|
| $100M to $500M |
30
| 3.6
| 3.6
| 47.5
|
|---|
| $500M to $1B |
21
| 2.5
| 2.5
| 50.0
|
|---|
| over $1B |
52
| 6.2
| 6.2
| 56.2
|
|---|
| Don't know |
258
| 30.7
| 30.7
| 86.9
|
|---|
| Not Say |
110
| 13.1
| 13.1
| 100.0
|
|---|
| Total |
840
| 100.0
| 100.0
|
|
|---|
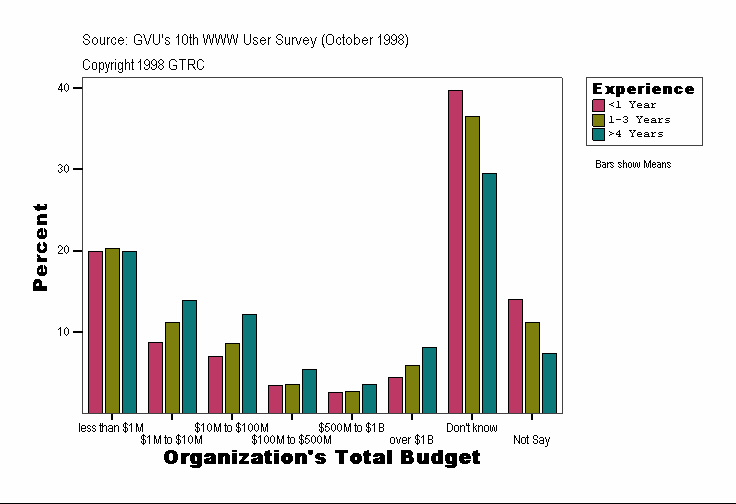
Organization's Total Budget
| Experience |
Frequency |
Percent |
Valid Percent |
Cumulative Percent |
|---|
| <1 Year |
Valid |
less than $1M |
130
| 19.9
| 19.9
| 19.9
|
|---|
| $1M to $10M |
57
| 8.7
| 8.7
| 28.6
|
|---|
| $10M to $100M |
46
| 7.0
| 7.0
| 35.7
|
|---|
| $100M to $500M |
23
| 3.5
| 3.5
| 39.2
|
|---|
| $500M to $1B |
17
| 2.6
| 2.6
| 41.8
|
|---|
| over $1B |
29
| 4.4
| 4.4
| 46.2
|
|---|
| Don't know |
259
| 39.7
| 39.7
| 85.9
|
|---|
| Not Say |
92
| 14.1
| 14.1
| 100.0
|
|---|
| Total |
653
| 100.0
| 100.0
|
|
|---|
| 1-3 Years |
Valid |
less than $1M |
352
| 20.3
| 20.3
| 20.3
|
|---|
| $1M to $10M |
195
| 11.2
| 11.2
| 31.5
|
|---|
| $10M to $100M |
149
| 8.6
| 8.6
| 40.1
|
|---|
| $100M to $500M |
62
| 3.6
| 3.6
| 43.7
|
|---|
| $500M to $1B |
48
| 2.8
| 2.8
| 46.4
|
|---|
| over $1B |
103
| 5.9
| 5.9
| 52.4
|
|---|
| Don't know |
633
| 36.5
| 36.5
| 88.8
|
|---|
| Not Say |
194
| 11.2
| 11.2
| 100.0
|
|---|
| Total |
1736
| 100.0
| 100.0
|
|
|---|
| >4 Years |
Valid |
less than $1M |
525
| 19.9
| 19.9
| 19.9
|
|---|
| $1M to $10M |
365
| 13.9
| 13.9
| 33.8
|
|---|
| $10M to $100M |
322
| 12.2
| 12.2
| 46.0
|
|---|
| $100M to $500M |
142
| 5.4
| 5.4
| 51.4
|
|---|
| $500M to $1B |
95
| 3.6
| 3.6
| 55.0
|
|---|
| over $1B |
214
| 8.1
| 8.1
| 63.2
|
|---|
| Don't know |
776
| 29.5
| 29.5
| 92.6
|
|---|
| Not Say |
194
| 7.4
| 7.4
| 100.0
|
|---|
| Total |
2633
| 100.0
| 100.0
|
|
|---|
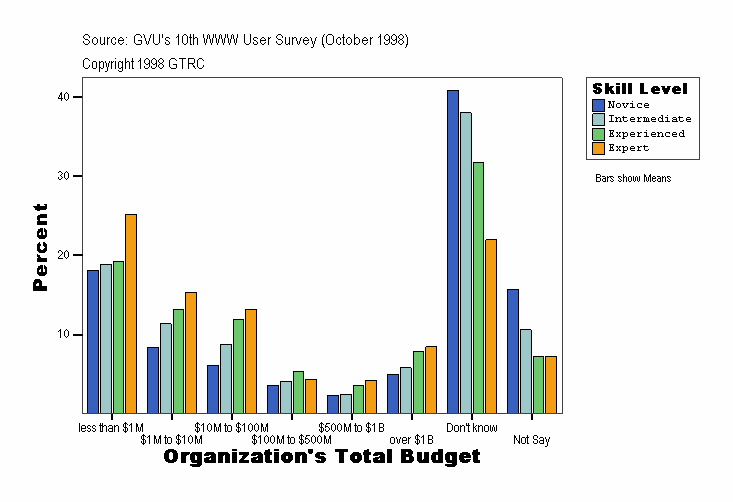
Organization's Total Budget
| Skill Level |
Frequency |
Percent |
Valid Percent |
Cumulative Percent |
|---|
| Novice |
Valid |
less than $1M |
146
| 18.1
| 18.1
| 18.1
|
|---|
| $1M to $10M |
68
| 8.4
| 8.4
| 26.5
|
|---|
| $10M to $100M |
49
| 6.1
| 6.1
| 32.5
|
|---|
| $100M to $500M |
29
| 3.6
| 3.6
| 36.1
|
|---|
| $500M to $1B |
19
| 2.4
| 2.4
| 38.5
|
|---|
| over $1B |
40
| 5.0
| 5.0
| 43.4
|
|---|
| Don't know |
330
| 40.8
| 40.8
| 84.3
|
|---|
| Not Say |
127
| 15.7
| 15.7
| 100.0
|
|---|
| Total |
808
| 100.0
| 100.0
|
|
|---|
| Intermediate |
Valid |
less than $1M |
271
| 18.9
| 18.9
| 18.9
|
|---|
| $1M to $10M |
163
| 11.4
| 11.4
| 30.2
|
|---|
| $10M to $100M |
126
| 8.8
| 8.8
| 39.0
|
|---|
| $100M to $500M |
59
| 4.1
| 4.1
| 43.1
|
|---|
| $500M to $1B |
35
| 2.4
| 2.4
| 45.6
|
|---|
| over $1B |
83
| 5.8
| 5.8
| 51.4
|
|---|
| Don't know |
546
| 38.0
| 38.0
| 89.4
|
|---|
| Not Say |
152
| 10.6
| 10.6
| 100.0
|
|---|
| Total |
1435
| 100.0
| 100.0
|
|
|---|
| Experienced |
Valid |
less than $1M |
357
| 19.2
| 19.2
| 19.2
|
|---|
| $1M to $10M |
244
| 13.2
| 13.2
| 32.4
|
|---|
| $10M to $100M |
220
| 11.9
| 11.9
| 44.3
|
|---|
| $100M to $500M |
99
| 5.3
| 5.3
| 49.6
|
|---|
| $500M to $1B |
67
| 3.6
| 3.6
| 53.2
|
|---|
| over $1B |
145
| 7.8
| 7.8
| 61.0
|
|---|
| Don't know |
589
| 31.8
| 31.8
| 92.8
|
|---|
| Not Say |
134
| 7.2
| 7.2
| 100.0
|
|---|
| Total |
1855
| 100.0
| 100.0
|
|
|---|
| Expert |
Valid |
less than $1M |
233
| 25.2
| 25.2
| 25.2
|
|---|
| $1M to $10M |
142
| 15.4
| 15.4
| 40.6
|
|---|
| $10M to $100M |
122
| 13.2
| 13.2
| 53.8
|
|---|
| $100M to $500M |
40
| 4.3
| 4.3
| 58.1
|
|---|
| $500M to $1B |
39
| 4.2
| 4.2
| 62.3
|
|---|
| over $1B |
78
| 8.4
| 8.4
| 70.8
|
|---|
| Don't know |
203
| 22.0
| 22.0
| 92.7
|
|---|
| Not Say |
67
| 7.3
| 7.3
| 100.0
|
|---|
| Total |
924
| 100.0
| 100.0
|
|
|---|
Source: GVU's Tenth WWW User Survey (Conducted October 1998)
URL:http://www.gvu.gatech.edu/user_surveys/
Copyright 1998 GTRC - ALL RIGHTS RESERVED
Contact: www-survey@cc.gatech.edu
For more information or to submit comments:
send email to www-survey@cc.gatech.edu.
GVU's WWW Surveying Team
Graphics, Visualization, & Usability Center
College of Computing
Georgia Institute of Technology
Atlanta, GA 30332-0280
