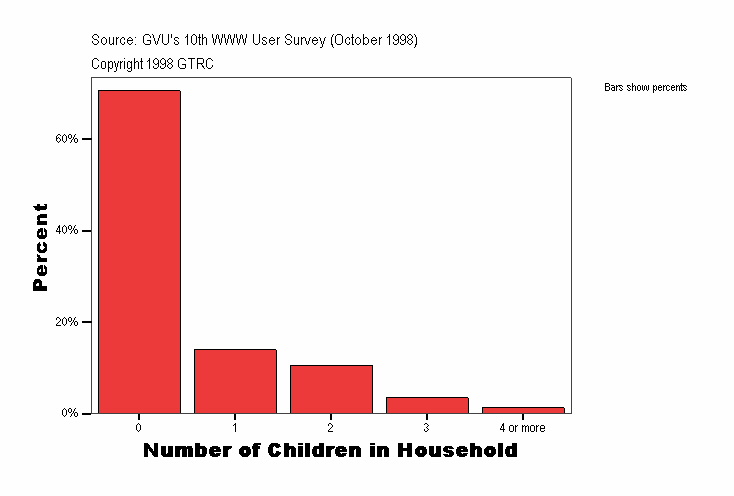
Number of Children in Household
|
Frequency |
Percent |
Valid Percent |
Cumulative Percent |
|---|
| Valid |
0 |
3547
| 70.6
| 70.6
| 70.6
|
|---|
| 1 |
702
| 14.0
| 14.0
| 84.6
|
|---|
| 2 |
530
| 10.6
| 10.6
| 95.2
|
|---|
| 3 |
177
| 3.5
| 3.5
| 98.7
|
|---|
| 4 or more |
66
| 1.3
| 1.3
| 100.0
|
|---|
| Total |
5022
| 100.0
| 100.0
|
|
|---|
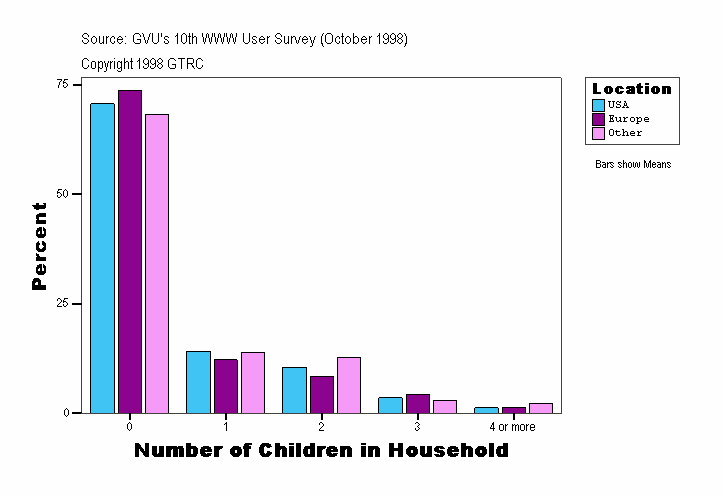
Number of Children in Household
| Location |
Frequency |
Percent |
Valid Percent |
Cumulative Percent |
|---|
| USA |
Valid |
0 |
3003
| 70.6
| 70.6
| 70.6
|
|---|
| 1 |
602
| 14.2
| 14.2
| 84.7
|
|---|
| 2 |
448
| 10.5
| 10.5
| 95.3
|
|---|
| 3 |
149
| 3.5
| 3.5
| 98.8
|
|---|
| 4 or more |
52
| 1.2
| 1.2
| 100.0
|
|---|
| Total |
4254
| 100.0
| 100.0
|
|
|---|
| Europe |
Valid |
0 |
272
| 73.7
| 73.7
| 73.7
|
|---|
| 1 |
45
| 12.2
| 12.2
| 85.9
|
|---|
| 2 |
31
| 8.4
| 8.4
| 94.3
|
|---|
| 3 |
16
| 4.3
| 4.3
| 98.6
|
|---|
| 4 or more |
5
| 1.4
| 1.4
| 100.0
|
|---|
| Total |
369
| 100.0
| 100.0
|
|
|---|
| Other |
Valid |
0 |
272
| 68.2
| 68.2
| 68.2
|
|---|
| 1 |
55
| 13.8
| 13.8
| 82.0
|
|---|
| 2 |
51
| 12.8
| 12.8
| 94.7
|
|---|
| 3 |
12
| 3.0
| 3.0
| 97.7
|
|---|
| 4 or more |
9
| 2.3
| 2.3
| 100.0
|
|---|
| Total |
399
| 100.0
| 100.0
|
|
|---|
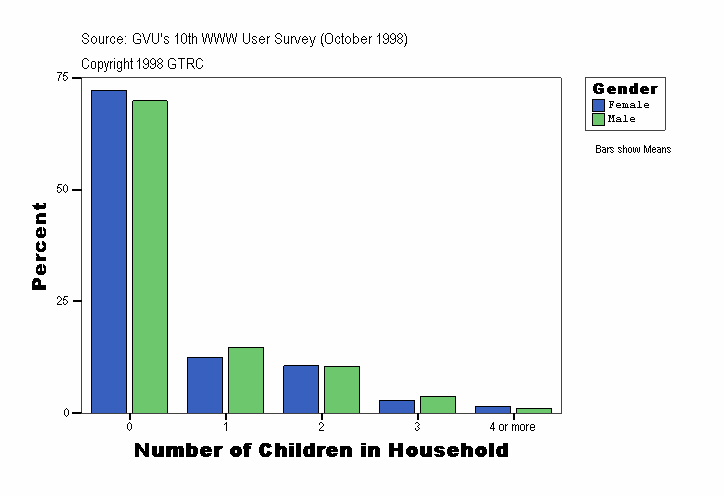
Number of Children in Household
| Gender |
Frequency |
Percent |
Valid Percent |
Cumulative Percent |
|---|
| Female |
Valid |
0 |
1217
| 72.2
| 72.2
| 72.2
|
|---|
| 1 |
212
| 12.6
| 12.6
| 84.8
|
|---|
| 2 |
179
| 10.6
| 10.6
| 95.4
|
|---|
| 3 |
50
| 3.0
| 3.0
| 98.4
|
|---|
| 4 or more |
27
| 1.6
| 1.6
| 100.0
|
|---|
| Total |
1685
| 100.0
| 100.0
|
|
|---|
| Male |
Valid |
0 |
2330
| 69.8
| 69.8
| 69.8
|
|---|
| 1 |
490
| 14.7
| 14.7
| 84.5
|
|---|
| 2 |
351
| 10.5
| 10.5
| 95.0
|
|---|
| 3 |
127
| 3.8
| 3.8
| 98.8
|
|---|
| 4 or more |
39
| 1.2
| 1.2
| 100.0
|
|---|
| Total |
3337
| 100.0
| 100.0
|
|
|---|
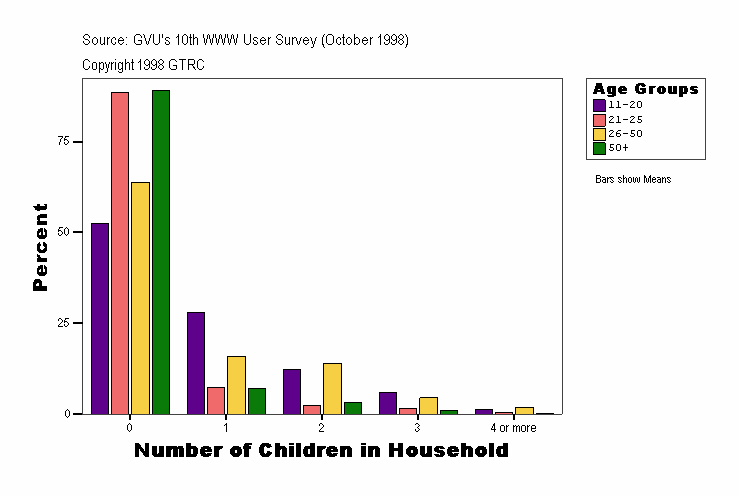
Number of Children in Household
| Age Groups |
Frequency |
Percent |
Valid Percent |
Cumulative Percent |
|---|
| . |
Valid |
0 |
64
| 76.2
| 76.2
| 76.2
|
|---|
| 1 |
9
| 10.7
| 10.7
| 86.9
|
|---|
| 2 |
9
| 10.7
| 10.7
| 97.6
|
|---|
| 3 |
1
| 1.2
| 1.2
| 98.8
|
|---|
| 4 or more |
1
| 1.2
| 1.2
| 100.0
|
|---|
| Total |
84
| 100.0
| 100.0
|
|
|---|
| 11-20 |
Valid |
0 |
157
| 52.3
| 52.3
| 52.3
|
|---|
| 1 |
84
| 28.0
| 28.0
| 80.3
|
|---|
| 2 |
37
| 12.3
| 12.3
| 92.7
|
|---|
| 3 |
18
| 6.0
| 6.0
| 98.7
|
|---|
| 4 or more |
4
| 1.3
| 1.3
| 100.0
|
|---|
| Total |
300
| 100.0
| 100.0
|
|
|---|
| 21-25 |
Valid |
0 |
555
| 88.5
| 88.5
| 88.5
|
|---|
| 1 |
46
| 7.3
| 7.3
| 95.9
|
|---|
| 2 |
14
| 2.2
| 2.2
| 98.1
|
|---|
| 3 |
9
| 1.4
| 1.4
| 99.5
|
|---|
| 4 or more |
3
| .5
| .5
| 100.0
|
|---|
| Total |
627
| 100.0
| 100.0
|
|
|---|
| 26-50 |
Valid |
0 |
2024
| 63.8
| 63.8
| 63.8
|
|---|
| 1 |
505
| 15.9
| 15.9
| 79.8
|
|---|
| 2 |
443
| 14.0
| 14.0
| 93.7
|
|---|
| 3 |
142
| 4.5
| 4.5
| 98.2
|
|---|
| 4 or more |
57
| 1.8
| 1.8
| 100.0
|
|---|
| Total |
3171
| 100.0
| 100.0
|
|
|---|
| 50+ |
Valid |
0 |
747
| 88.9
| 88.9
| 88.9
|
|---|
| 1 |
58
| 6.9
| 6.9
| 95.8
|
|---|
| 2 |
27
| 3.2
| 3.2
| 99.0
|
|---|
| 3 |
7
| .8
| .8
| 99.9
|
|---|
| 4 or more |
1
| .1
| .1
| 100.0
|
|---|
| Total |
840
| 100.0
| 100.0
|
|
|---|
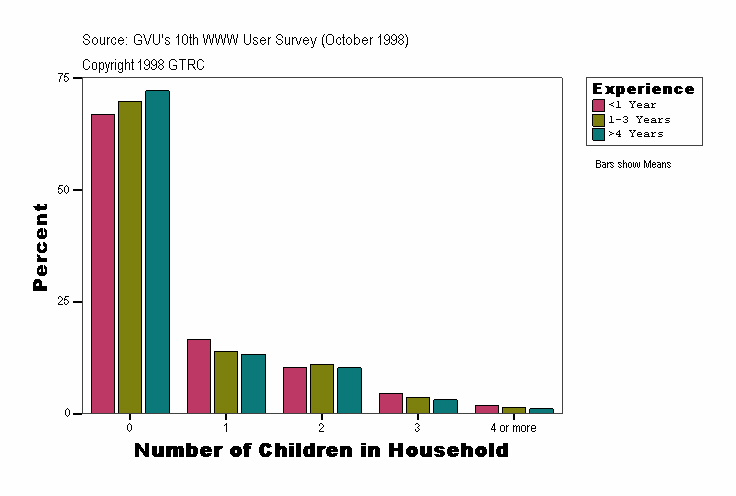
Number of Children in Household
| Experience |
Frequency |
Percent |
Valid Percent |
Cumulative Percent |
|---|
| <1 Year |
Valid |
0 |
436
| 66.8
| 66.8
| 66.8
|
|---|
| 1 |
108
| 16.5
| 16.5
| 83.3
|
|---|
| 2 |
67
| 10.3
| 10.3
| 93.6
|
|---|
| 3 |
30
| 4.6
| 4.6
| 98.2
|
|---|
| 4 or more |
12
| 1.8
| 1.8
| 100.0
|
|---|
| Total |
653
| 100.0
| 100.0
|
|
|---|
| 1-3 Years |
Valid |
0 |
1211
| 69.8
| 69.8
| 69.8
|
|---|
| 1 |
243
| 14.0
| 14.0
| 83.8
|
|---|
| 2 |
193
| 11.1
| 11.1
| 94.9
|
|---|
| 3 |
65
| 3.7
| 3.7
| 98.6
|
|---|
| 4 or more |
24
| 1.4
| 1.4
| 100.0
|
|---|
| Total |
1736
| 100.0
| 100.0
|
|
|---|
| >4 Years |
Valid |
0 |
1900
| 72.2
| 72.2
| 72.2
|
|---|
| 1 |
351
| 13.3
| 13.3
| 85.5
|
|---|
| 2 |
270
| 10.3
| 10.3
| 95.7
|
|---|
| 3 |
82
| 3.1
| 3.1
| 98.9
|
|---|
| 4 or more |
30
| 1.1
| 1.1
| 100.0
|
|---|
| Total |
2633
| 100.0
| 100.0
|
|
|---|
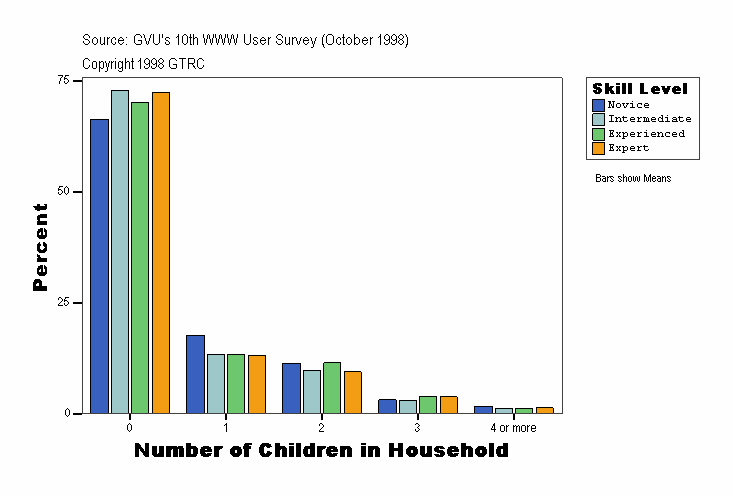
Number of Children in Household
| Skill Level |
Frequency |
Percent |
Valid Percent |
Cumulative Percent |
|---|
| Novice |
Valid |
0 |
536
| 66.3
| 66.3
| 66.3
|
|---|
| 1 |
142
| 17.6
| 17.6
| 83.9
|
|---|
| 2 |
92
| 11.4
| 11.4
| 95.3
|
|---|
| 3 |
25
| 3.1
| 3.1
| 98.4
|
|---|
| 4 or more |
13
| 1.6
| 1.6
| 100.0
|
|---|
| Total |
808
| 100.0
| 100.0
|
|
|---|
| Intermediate |
Valid |
0 |
1044
| 72.8
| 72.8
| 72.8
|
|---|
| 1 |
190
| 13.2
| 13.2
| 86.0
|
|---|
| 2 |
139
| 9.7
| 9.7
| 95.7
|
|---|
| 3 |
44
| 3.1
| 3.1
| 98.7
|
|---|
| 4 or more |
18
| 1.3
| 1.3
| 100.0
|
|---|
| Total |
1435
| 100.0
| 100.0
|
|
|---|
| Experienced |
Valid |
0 |
1299
| 70.0
| 70.0
| 70.0
|
|---|
| 1 |
248
| 13.4
| 13.4
| 83.4
|
|---|
| 2 |
212
| 11.4
| 11.4
| 94.8
|
|---|
| 3 |
73
| 3.9
| 3.9
| 98.8
|
|---|
| 4 or more |
23
| 1.2
| 1.2
| 100.0
|
|---|
| Total |
1855
| 100.0
| 100.0
|
|
|---|
| Expert |
Valid |
0 |
668
| 72.3
| 72.3
| 72.3
|
|---|
| 1 |
122
| 13.2
| 13.2
| 85.5
|
|---|
| 2 |
87
| 9.4
| 9.4
| 94.9
|
|---|
| 3 |
35
| 3.8
| 3.8
| 98.7
|
|---|
| 4 or more |
12
| 1.3
| 1.3
| 100.0
|
|---|
| Total |
924
| 100.0
| 100.0
|
|
|---|
Source: GVU's Tenth WWW User Survey (Conducted October 1998)
URL:http://www.gvu.gatech.edu/user_surveys/
Copyright 1998 GTRC - ALL RIGHTS RESERVED
Contact: www-survey@cc.gatech.edu
For more information or to submit comments:
send email to www-survey@cc.gatech.edu.
GVU's WWW Surveying Team
Graphics, Visualization, & Usability Center
College of Computing
Georgia Institute of Technology
Atlanta, GA 30332-0280
