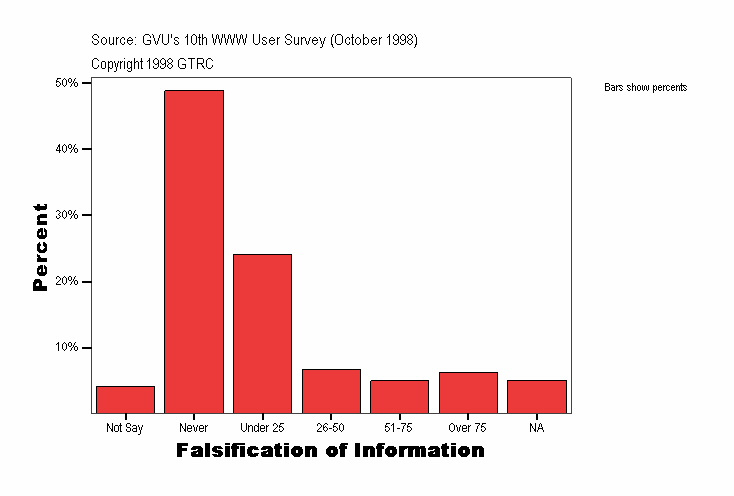
Falsification of Information
|
Frequency |
Percent |
Valid Percent |
Cumulative Percent |
|---|
| Valid |
Not Say |
204
| 4.1
| 4.1
| 4.1
|
|---|
| Never |
2454
| 48.9
| 48.9
| 52.9
|
|---|
| Under 25 |
1210
| 24.1
| 24.1
| 77.0
|
|---|
| 26-50 |
339
| 6.8
| 6.8
| 83.8
|
|---|
| 51-75 |
250
| 5.0
| 5.0
| 88.7
|
|---|
| Over 75 |
310
| 6.2
| 6.2
| 94.9
|
|---|
| NA |
255
| 5.1
| 5.1
| 100.0
|
|---|
| Total |
5022
| 100.0
| 100.0
|
|
|---|
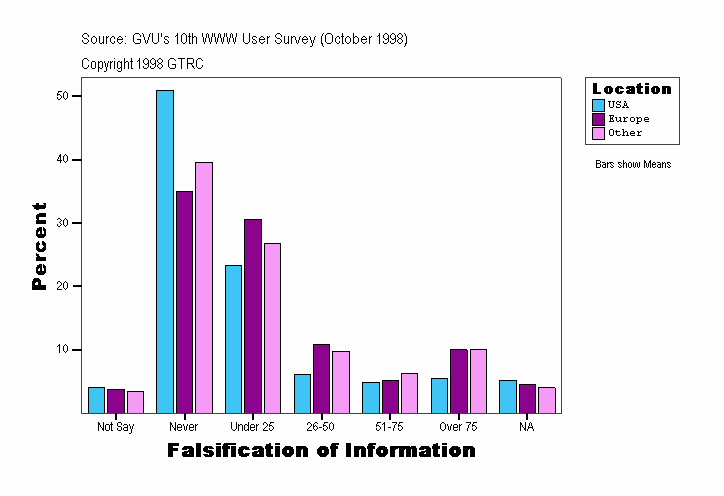
Falsification of Information
| Location |
Frequency |
Percent |
Valid Percent |
Cumulative Percent |
|---|
| USA |
Valid |
Not Say |
176
| 4.1
| 4.1
| 4.1
|
|---|
| Never |
2167
| 50.9
| 50.9
| 55.1
|
|---|
| Under 25 |
990
| 23.3
| 23.3
| 78.3
|
|---|
| 26-50 |
260
| 6.1
| 6.1
| 84.5
|
|---|
| 51-75 |
206
| 4.8
| 4.8
| 89.3
|
|---|
| Over 75 |
233
| 5.5
| 5.5
| 94.8
|
|---|
| NA |
222
| 5.2
| 5.2
| 100.0
|
|---|
| Total |
4254
| 100.0
| 100.0
|
|
|---|
| Europe |
Valid |
Not Say |
14
| 3.8
| 3.8
| 3.8
|
|---|
| Never |
129
| 35.0
| 35.0
| 38.8
|
|---|
| Under 25 |
113
| 30.6
| 30.6
| 69.4
|
|---|
| 26-50 |
40
| 10.8
| 10.8
| 80.2
|
|---|
| 51-75 |
19
| 5.1
| 5.1
| 85.4
|
|---|
| Over 75 |
37
| 10.0
| 10.0
| 95.4
|
|---|
| NA |
17
| 4.6
| 4.6
| 100.0
|
|---|
| Total |
369
| 100.0
| 100.0
|
|
|---|
| Other |
Valid |
Not Say |
14
| 3.5
| 3.5
| 3.5
|
|---|
| Never |
158
| 39.6
| 39.6
| 43.1
|
|---|
| Under 25 |
107
| 26.8
| 26.8
| 69.9
|
|---|
| 26-50 |
39
| 9.8
| 9.8
| 79.7
|
|---|
| 51-75 |
25
| 6.3
| 6.3
| 86.0
|
|---|
| Over 75 |
40
| 10.0
| 10.0
| 96.0
|
|---|
| NA |
16
| 4.0
| 4.0
| 100.0
|
|---|
| Total |
399
| 100.0
| 100.0
|
|
|---|
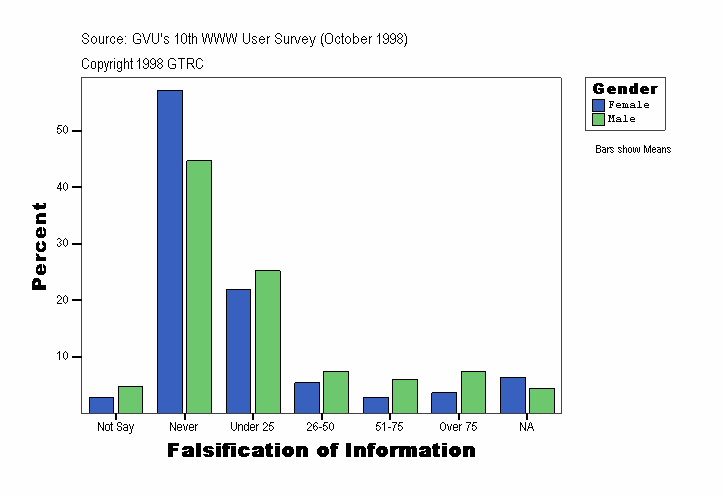
Falsification of Information
| Gender |
Frequency |
Percent |
Valid Percent |
Cumulative Percent |
|---|
| Female |
Valid |
Not Say |
46
| 2.7
| 2.7
| 2.7
|
|---|
| Never |
963
| 57.2
| 57.2
| 59.9
|
|---|
| Under 25 |
369
| 21.9
| 21.9
| 81.8
|
|---|
| 26-50 |
91
| 5.4
| 5.4
| 87.2
|
|---|
| 51-75 |
48
| 2.8
| 2.8
| 90.0
|
|---|
| Over 75 |
61
| 3.6
| 3.6
| 93.6
|
|---|
| NA |
107
| 6.4
| 6.4
| 100.0
|
|---|
| Total |
1685
| 100.0
| 100.0
|
|
|---|
| Male |
Valid |
Not Say |
158
| 4.7
| 4.7
| 4.7
|
|---|
| Never |
1491
| 44.7
| 44.7
| 49.4
|
|---|
| Under 25 |
841
| 25.2
| 25.2
| 74.6
|
|---|
| 26-50 |
248
| 7.4
| 7.4
| 82.0
|
|---|
| 51-75 |
202
| 6.1
| 6.1
| 88.1
|
|---|
| Over 75 |
249
| 7.5
| 7.5
| 95.6
|
|---|
| NA |
148
| 4.4
| 4.4
| 100.0
|
|---|
| Total |
3337
| 100.0
| 100.0
|
|
|---|
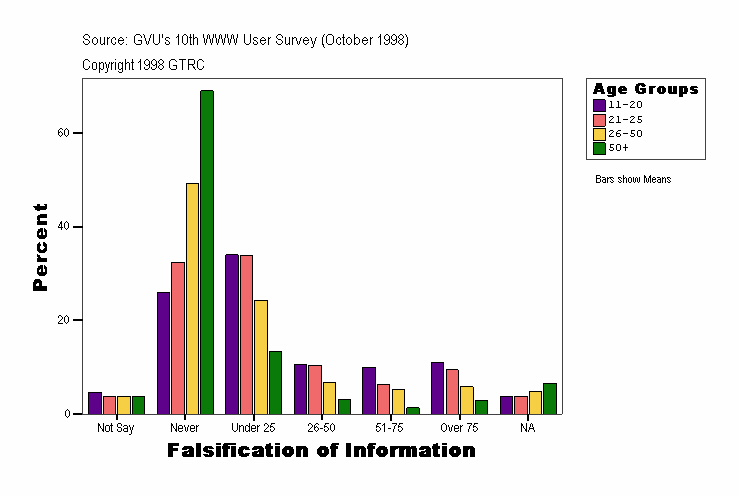
Falsification of Information
| Age Groups |
Frequency |
Percent |
Valid Percent |
Cumulative Percent |
|---|
| . |
Valid |
Not Say |
17
| 20.2
| 20.2
| 20.2
|
|---|
| Never |
29
| 34.5
| 34.5
| 54.8
|
|---|
| Under 25 |
11
| 13.1
| 13.1
| 67.9
|
|---|
| 26-50 |
3
| 3.6
| 3.6
| 71.4
|
|---|
| 51-75 |
3
| 3.6
| 3.6
| 75.0
|
|---|
| Over 75 |
9
| 10.7
| 10.7
| 85.7
|
|---|
| NA |
12
| 14.3
| 14.3
| 100.0
|
|---|
| Total |
84
| 100.0
| 100.0
|
|
|---|
| 11-20 |
Valid |
Not Say |
14
| 4.7
| 4.7
| 4.7
|
|---|
| Never |
78
| 26.0
| 26.0
| 30.7
|
|---|
| Under 25 |
102
| 34.0
| 34.0
| 64.7
|
|---|
| 26-50 |
32
| 10.7
| 10.7
| 75.3
|
|---|
| 51-75 |
30
| 10.0
| 10.0
| 85.3
|
|---|
| Over 75 |
33
| 11.0
| 11.0
| 96.3
|
|---|
| NA |
11
| 3.7
| 3.7
| 100.0
|
|---|
| Total |
300
| 100.0
| 100.0
|
|
|---|
| 21-25 |
Valid |
Not Say |
23
| 3.7
| 3.7
| 3.7
|
|---|
| Never |
203
| 32.4
| 32.4
| 36.0
|
|---|
| Under 25 |
213
| 34.0
| 34.0
| 70.0
|
|---|
| 26-50 |
65
| 10.4
| 10.4
| 80.4
|
|---|
| 51-75 |
40
| 6.4
| 6.4
| 86.8
|
|---|
| Over 75 |
59
| 9.4
| 9.4
| 96.2
|
|---|
| NA |
24
| 3.8
| 3.8
| 100.0
|
|---|
| Total |
627
| 100.0
| 100.0
|
|
|---|
| 26-50 |
Valid |
Not Say |
119
| 3.8
| 3.8
| 3.8
|
|---|
| Never |
1564
| 49.3
| 49.3
| 53.1
|
|---|
| Under 25 |
771
| 24.3
| 24.3
| 77.4
|
|---|
| 26-50 |
213
| 6.7
| 6.7
| 84.1
|
|---|
| 51-75 |
166
| 5.2
| 5.2
| 89.3
|
|---|
| Over 75 |
185
| 5.8
| 5.8
| 95.2
|
|---|
| NA |
153
| 4.8
| 4.8
| 100.0
|
|---|
| Total |
3171
| 100.0
| 100.0
|
|
|---|
| 50+ |
Valid |
Not Say |
31
| 3.7
| 3.7
| 3.7
|
|---|
| Never |
580
| 69.0
| 69.0
| 72.7
|
|---|
| Under 25 |
113
| 13.5
| 13.5
| 86.2
|
|---|
| 26-50 |
26
| 3.1
| 3.1
| 89.3
|
|---|
| 51-75 |
11
| 1.3
| 1.3
| 90.6
|
|---|
| Over 75 |
24
| 2.9
| 2.9
| 93.5
|
|---|
| NA |
55
| 6.5
| 6.5
| 100.0
|
|---|
| Total |
840
| 100.0
| 100.0
|
|
|---|
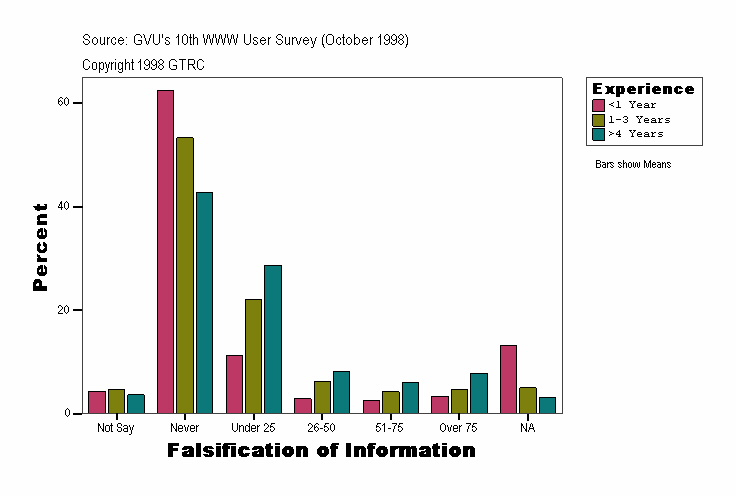
Falsification of Information
| Experience |
Frequency |
Percent |
Valid Percent |
Cumulative Percent |
|---|
| <1 Year |
Valid |
Not Say |
28
| 4.3
| 4.3
| 4.3
|
|---|
| Never |
407
| 62.3
| 62.3
| 66.6
|
|---|
| Under 25 |
74
| 11.3
| 11.3
| 77.9
|
|---|
| 26-50 |
19
| 2.9
| 2.9
| 80.9
|
|---|
| 51-75 |
17
| 2.6
| 2.6
| 83.5
|
|---|
| Over 75 |
22
| 3.4
| 3.4
| 86.8
|
|---|
| NA |
86
| 13.2
| 13.2
| 100.0
|
|---|
| Total |
653
| 100.0
| 100.0
|
|
|---|
| 1-3 Years |
Valid |
Not Say |
80
| 4.6
| 4.6
| 4.6
|
|---|
| Never |
924
| 53.2
| 53.2
| 57.8
|
|---|
| Under 25 |
382
| 22.0
| 22.0
| 79.8
|
|---|
| 26-50 |
107
| 6.2
| 6.2
| 86.0
|
|---|
| 51-75 |
74
| 4.3
| 4.3
| 90.3
|
|---|
| Over 75 |
82
| 4.7
| 4.7
| 95.0
|
|---|
| NA |
87
| 5.0
| 5.0
| 100.0
|
|---|
| Total |
1736
| 100.0
| 100.0
|
|
|---|
| >4 Years |
Valid |
Not Say |
96
| 3.6
| 3.6
| 3.6
|
|---|
| Never |
1123
| 42.7
| 42.7
| 46.3
|
|---|
| Under 25 |
754
| 28.6
| 28.6
| 74.9
|
|---|
| 26-50 |
213
| 8.1
| 8.1
| 83.0
|
|---|
| 51-75 |
159
| 6.0
| 6.0
| 89.1
|
|---|
| Over 75 |
206
| 7.8
| 7.8
| 96.9
|
|---|
| NA |
82
| 3.1
| 3.1
| 100.0
|
|---|
| Total |
2633
| 100.0
| 100.0
|
|
|---|
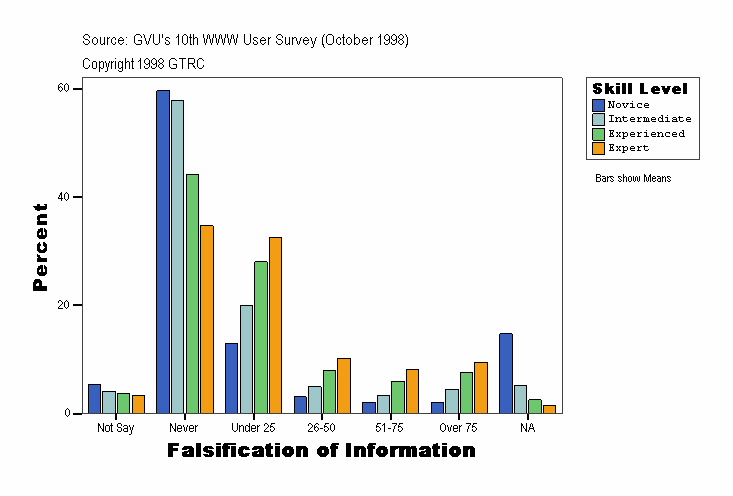
Falsification of Information
| Skill Level |
Frequency |
Percent |
Valid Percent |
Cumulative Percent |
|---|
| Novice |
Valid |
Not Say |
44
| 5.4
| 5.4
| 5.4
|
|---|
| Never |
482
| 59.7
| 59.7
| 65.1
|
|---|
| Under 25 |
104
| 12.9
| 12.9
| 78.0
|
|---|
| 26-50 |
25
| 3.1
| 3.1
| 81.1
|
|---|
| 51-75 |
17
| 2.1
| 2.1
| 83.2
|
|---|
| Over 75 |
17
| 2.1
| 2.1
| 85.3
|
|---|
| NA |
119
| 14.7
| 14.7
| 100.0
|
|---|
| Total |
808
| 100.0
| 100.0
|
|
|---|
| Intermediate |
Valid |
Not Say |
59
| 4.1
| 4.1
| 4.1
|
|---|
| Never |
831
| 57.9
| 57.9
| 62.0
|
|---|
| Under 25 |
286
| 19.9
| 19.9
| 82.0
|
|---|
| 26-50 |
72
| 5.0
| 5.0
| 87.0
|
|---|
| 51-75 |
48
| 3.3
| 3.3
| 90.3
|
|---|
| Over 75 |
64
| 4.5
| 4.5
| 94.8
|
|---|
| NA |
75
| 5.2
| 5.2
| 100.0
|
|---|
| Total |
1435
| 100.0
| 100.0
|
|
|---|
| Experienced |
Valid |
Not Say |
70
| 3.8
| 3.8
| 3.8
|
|---|
| Never |
820
| 44.2
| 44.2
| 48.0
|
|---|
| Under 25 |
520
| 28.0
| 28.0
| 76.0
|
|---|
| 26-50 |
147
| 7.9
| 7.9
| 83.9
|
|---|
| 51-75 |
110
| 5.9
| 5.9
| 89.9
|
|---|
| Over 75 |
141
| 7.6
| 7.6
| 97.5
|
|---|
| NA |
47
| 2.5
| 2.5
| 100.0
|
|---|
| Total |
1855
| 100.0
| 100.0
|
|
|---|
| Expert |
Valid |
Not Say |
31
| 3.4
| 3.4
| 3.4
|
|---|
| Never |
321
| 34.7
| 34.7
| 38.1
|
|---|
| Under 25 |
300
| 32.5
| 32.5
| 70.6
|
|---|
| 26-50 |
95
| 10.3
| 10.3
| 80.8
|
|---|
| 51-75 |
75
| 8.1
| 8.1
| 89.0
|
|---|
| Over 75 |
88
| 9.5
| 9.5
| 98.5
|
|---|
| NA |
14
| 1.5
| 1.5
| 100.0
|
|---|
| Total |
924
| 100.0
| 100.0
|
|
|---|
Source: GVU's Tenth WWW User Survey (Conducted October 1998)
URL:http://www.gvu.gatech.edu/user_surveys/
Copyright 1998 GTRC - ALL RIGHTS RESERVED
Contact: www-survey@cc.gatech.edu
For more information or to submit comments:
send email to www-survey@cc.gatech.edu.
GVU's WWW Surveying Team
Graphics, Visualization, & Usability Center
College of Computing
Georgia Institute of Technology
Atlanta, GA 30332-0280
