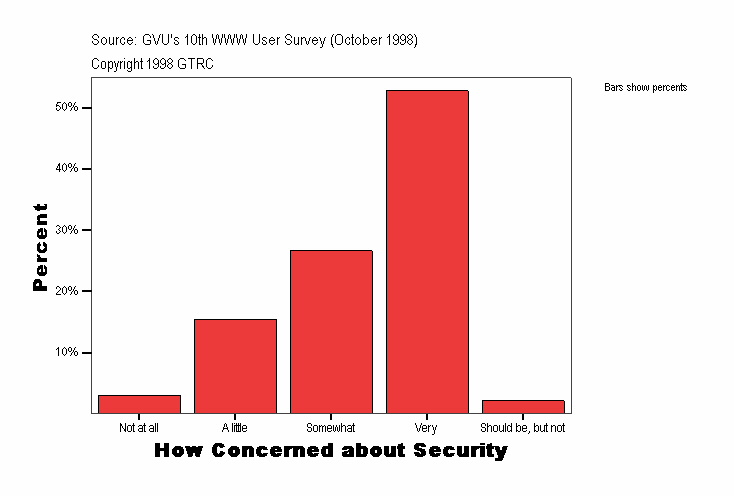
How Concerned about Security
|
Frequency |
Percent |
Valid Percent |
Cumulative Percent |
|---|
| Valid |
Not at all |
45
| 3.0
| 3.0
| 3.0
|
|---|
| A little |
229
| 15.5
| 15.5
| 18.5
|
|---|
| Somewhat |
395
| 26.7
| 26.7
| 45.1
|
|---|
| Very |
782
| 52.8
| 52.8
| 97.9
|
|---|
| Should be, but not |
31
| 2.1
| 2.1
| 100.0
|
|---|
| Total |
1482
| 100.0
| 100.0
|
|
|---|
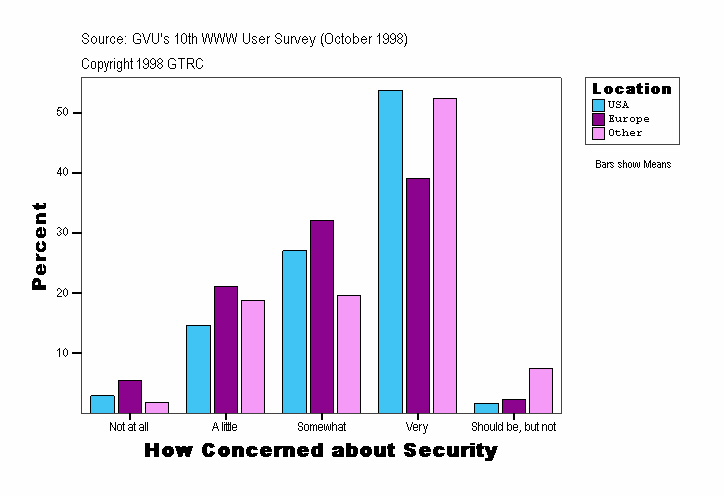
How Concerned about Security
| Location |
Frequency |
Percent |
Valid Percent |
Cumulative Percent |
|---|
| . |
Valid |
A little |
3
| 12.5
| 12.5
| 12.5
|
|---|
| Somewhat |
2
| 8.3
| 8.3
| 20.8
|
|---|
| Very |
19
| 79.2
| 79.2
| 100.0
|
|---|
| Total |
24
| 100.0
| 100.0
|
|
|---|
| USA |
Valid |
Not at all |
36
| 2.9
| 2.9
| 2.9
|
|---|
| A little |
179
| 14.6
| 14.6
| 17.6
|
|---|
| Somewhat |
331
| 27.1
| 27.1
| 44.6
|
|---|
| Very |
657
| 53.7
| 53.7
| 98.4
|
|---|
| Should be, but not |
20
| 1.6
| 1.6
| 100.0
|
|---|
| Total |
1223
| 100.0
| 100.0
|
|
|---|
| Europe |
Valid |
Not at all |
7
| 5.5
| 5.5
| 5.5
|
|---|
| A little |
27
| 21.1
| 21.1
| 26.6
|
|---|
| Somewhat |
41
| 32.0
| 32.0
| 58.6
|
|---|
| Very |
50
| 39.1
| 39.1
| 97.7
|
|---|
| Should be, but not |
3
| 2.3
| 2.3
| 100.0
|
|---|
| Total |
128
| 100.0
| 100.0
|
|
|---|
| Other |
Valid |
Not at all |
2
| 1.9
| 1.9
| 1.9
|
|---|
| A little |
20
| 18.7
| 18.7
| 20.6
|
|---|
| Somewhat |
21
| 19.6
| 19.6
| 40.2
|
|---|
| Very |
56
| 52.3
| 52.3
| 92.5
|
|---|
| Should be, but not |
8
| 7.5
| 7.5
| 100.0
|
|---|
| Total |
107
| 100.0
| 100.0
|
|
|---|
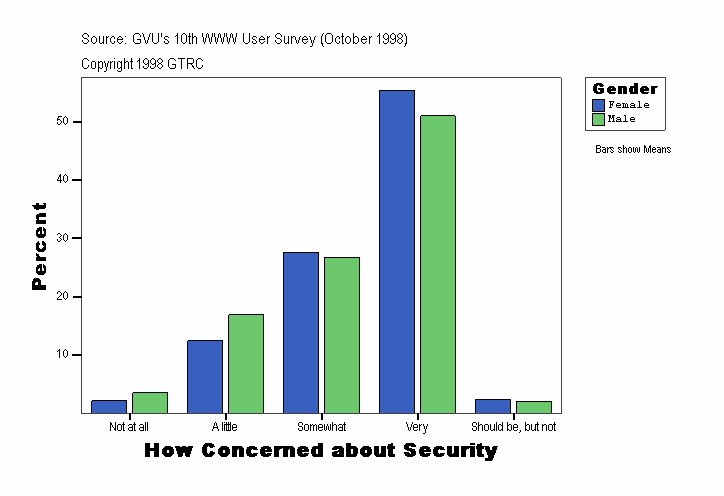
How Concerned about Security
| Gender |
Frequency |
Percent |
Valid Percent |
Cumulative Percent |
|---|
| . |
Valid |
A little |
3
| 12.5
| 12.5
| 12.5
|
|---|
| Somewhat |
2
| 8.3
| 8.3
| 20.8
|
|---|
| Very |
19
| 79.2
| 79.2
| 100.0
|
|---|
| Total |
24
| 100.0
| 100.0
|
|
|---|
| Female |
Valid |
Not at all |
10
| 2.2
| 2.2
| 2.2
|
|---|
| A little |
57
| 12.5
| 12.5
| 14.7
|
|---|
| Somewhat |
126
| 27.6
| 27.6
| 42.2
|
|---|
| Very |
253
| 55.4
| 55.4
| 97.6
|
|---|
| Should be, but not |
11
| 2.4
| 2.4
| 100.0
|
|---|
| Total |
457
| 100.0
| 100.0
|
|
|---|
| Male |
Valid |
Not at all |
35
| 3.5
| 3.5
| 3.5
|
|---|
| A little |
169
| 16.9
| 16.9
| 20.4
|
|---|
| Somewhat |
267
| 26.7
| 26.7
| 47.1
|
|---|
| Very |
510
| 50.9
| 50.9
| 98.0
|
|---|
| Should be, but not |
20
| 2.0
| 2.0
| 100.0
|
|---|
| Total |
1001
| 100.0
| 100.0
|
|
|---|
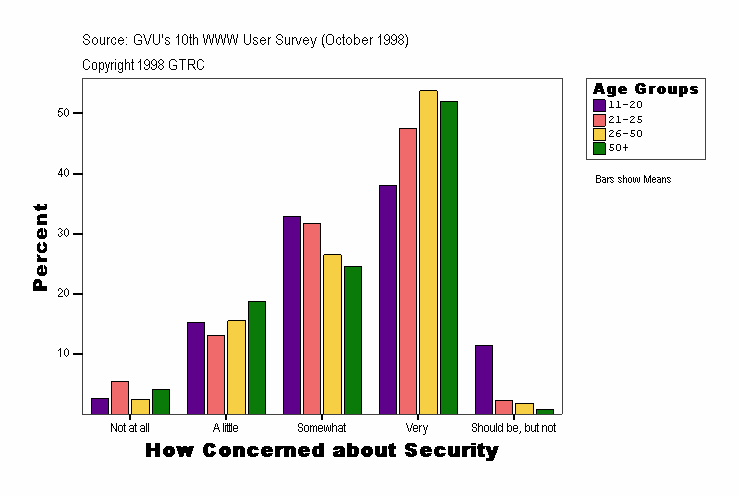
How Concerned about Security
| Age Groups |
Frequency |
Percent |
Valid Percent |
Cumulative Percent |
|---|
| . |
Valid |
A little |
3
| 5.8
| 5.8
| 5.8
|
|---|
| Somewhat |
7
| 13.5
| 13.5
| 19.2
|
|---|
| Very |
42
| 80.8
| 80.8
| 100.0
|
|---|
| Total |
52
| 100.0
| 100.0
|
|
|---|
| 11-20 |
Valid |
Not at all |
2
| 2.5
| 2.5
| 2.5
|
|---|
| A little |
12
| 15.2
| 15.2
| 17.7
|
|---|
| Somewhat |
26
| 32.9
| 32.9
| 50.6
|
|---|
| Very |
30
| 38.0
| 38.0
| 88.6
|
|---|
| Should be, but not |
9
| 11.4
| 11.4
| 100.0
|
|---|
| Total |
79
| 100.0
| 100.0
|
|
|---|
| 21-25 |
Valid |
Not at all |
10
| 5.5
| 5.5
| 5.5
|
|---|
| A little |
24
| 13.1
| 13.1
| 18.6
|
|---|
| Somewhat |
58
| 31.7
| 31.7
| 50.3
|
|---|
| Very |
87
| 47.5
| 47.5
| 97.8
|
|---|
| Should be, but not |
4
| 2.2
| 2.2
| 100.0
|
|---|
| Total |
183
| 100.0
| 100.0
|
|
|---|
| 26-50 |
Valid |
Not at all |
22
| 2.5
| 2.5
| 2.5
|
|---|
| A little |
139
| 15.5
| 15.5
| 18.0
|
|---|
| Somewhat |
237
| 26.5
| 26.5
| 44.5
|
|---|
| Very |
481
| 53.7
| 53.7
| 98.2
|
|---|
| Should be, but not |
16
| 1.8
| 1.8
| 100.0
|
|---|
| Total |
895
| 100.0
| 100.0
|
|
|---|
| 50+ |
Valid |
Not at all |
11
| 4.0
| 4.0
| 4.0
|
|---|
| A little |
51
| 18.7
| 18.7
| 22.7
|
|---|
| Somewhat |
67
| 24.5
| 24.5
| 47.3
|
|---|
| Very |
142
| 52.0
| 52.0
| 99.3
|
|---|
| Should be, but not |
2
| .7
| .7
| 100.0
|
|---|
| Total |
273
| 100.0
| 100.0
|
|
|---|
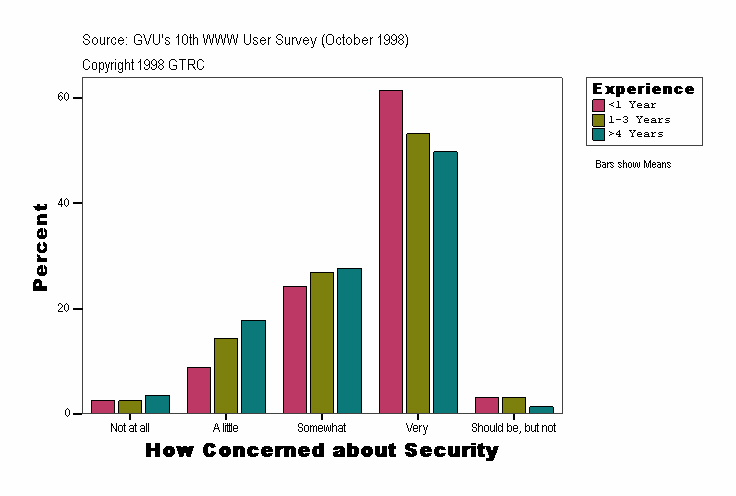
How Concerned about Security
| Experience |
Frequency |
Percent |
Valid Percent |
Cumulative Percent |
|---|
| . |
Valid |
A little |
3
| 12.5
| 12.5
| 12.5
|
|---|
| Somewhat |
2
| 8.3
| 8.3
| 20.8
|
|---|
| Very |
19
| 79.2
| 79.2
| 100.0
|
|---|
| Total |
24
| 100.0
| 100.0
|
|
|---|
| <1 Year |
Valid |
Not at all |
5
| 2.6
| 2.6
| 2.6
|
|---|
| A little |
17
| 8.8
| 8.8
| 11.3
|
|---|
| Somewhat |
47
| 24.2
| 24.2
| 35.6
|
|---|
| Very |
119
| 61.3
| 61.3
| 96.9
|
|---|
| Should be, but not |
6
| 3.1
| 3.1
| 100.0
|
|---|
| Total |
194
| 100.0
| 100.0
|
|
|---|
| 1-3 Years |
Valid |
Not at all |
11
| 2.5
| 2.5
| 2.5
|
|---|
| A little |
64
| 14.3
| 14.3
| 16.8
|
|---|
| Somewhat |
120
| 26.9
| 26.9
| 43.7
|
|---|
| Very |
237
| 53.1
| 53.1
| 96.9
|
|---|
| Should be, but not |
14
| 3.1
| 3.1
| 100.0
|
|---|
| Total |
446
| 100.0
| 100.0
|
|
|---|
| >4 Years |
Valid |
Not at all |
29
| 3.5
| 3.5
| 3.5
|
|---|
| A little |
145
| 17.7
| 17.7
| 21.3
|
|---|
| Somewhat |
226
| 27.6
| 27.6
| 48.9
|
|---|
| Very |
407
| 49.8
| 49.8
| 98.7
|
|---|
| Should be, but not |
11
| 1.3
| 1.3
| 100.0
|
|---|
| Total |
818
| 100.0
| 100.0
|
|
|---|
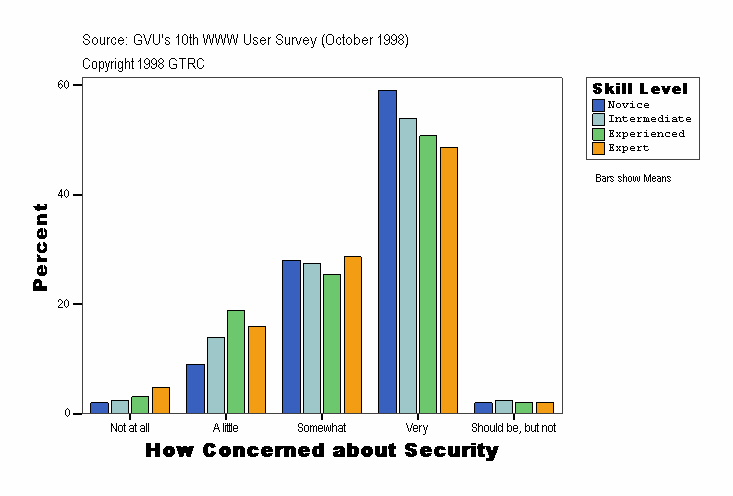
How Concerned about Security
| Skill Level |
Frequency |
Percent |
Valid Percent |
Cumulative Percent |
|---|
| . |
Valid |
A little |
3
| 12.5
| 12.5
| 12.5
|
|---|
| Somewhat |
2
| 8.3
| 8.3
| 20.8
|
|---|
| Very |
19
| 79.2
| 79.2
| 100.0
|
|---|
| Total |
24
| 100.0
| 100.0
|
|
|---|
| Novice |
Valid |
Not at all |
4
| 2.0
| 2.0
| 2.0
|
|---|
| A little |
18
| 9.0
| 9.0
| 11.0
|
|---|
| Somewhat |
56
| 28.0
| 28.0
| 39.0
|
|---|
| Very |
118
| 59.0
| 59.0
| 98.0
|
|---|
| Should be, but not |
4
| 2.0
| 2.0
| 100.0
|
|---|
| Total |
200
| 100.0
| 100.0
|
|
|---|
| Intermediate |
Valid |
Not at all |
10
| 2.4
| 2.4
| 2.4
|
|---|
| A little |
57
| 13.8
| 13.8
| 16.3
|
|---|
| Somewhat |
113
| 27.4
| 27.4
| 43.7
|
|---|
| Very |
222
| 53.9
| 53.9
| 97.6
|
|---|
| Should be, but not |
10
| 2.4
| 2.4
| 100.0
|
|---|
| Total |
412
| 100.0
| 100.0
|
|
|---|
| Experienced |
Valid |
Not at all |
17
| 3.1
| 3.1
| 3.1
|
|---|
| A little |
105
| 18.9
| 18.9
| 21.9
|
|---|
| Somewhat |
141
| 25.4
| 25.4
| 47.3
|
|---|
| Very |
282
| 50.7
| 50.7
| 98.0
|
|---|
| Should be, but not |
11
| 2.0
| 2.0
| 100.0
|
|---|
| Total |
556
| 100.0
| 100.0
|
|
|---|
| Expert |
Valid |
Not at all |
14
| 4.8
| 4.8
| 4.8
|
|---|
| A little |
46
| 15.9
| 15.9
| 20.7
|
|---|
| Somewhat |
83
| 28.6
| 28.6
| 49.3
|
|---|
| Very |
141
| 48.6
| 48.6
| 97.9
|
|---|
| Should be, but not |
6
| 2.1
| 2.1
| 100.0
|
|---|
| Total |
290
| 100.0
| 100.0
|
|
|---|
Source: GVU's Tenth WWW User Survey (Conducted October 1998)
URL:http://www.gvu.gatech.edu/user_surveys/
Copyright 1998 GTRC - ALL RIGHTS RESERVED
Contact: www-survey@cc.gatech.edu
For more information or to submit comments:
send email to www-survey@cc.gatech.edu.
GVU's WWW Surveying Team
Graphics, Visualization, & Usability Center
College of Computing
Georgia Institute of Technology
Atlanta, GA 30332-0280
