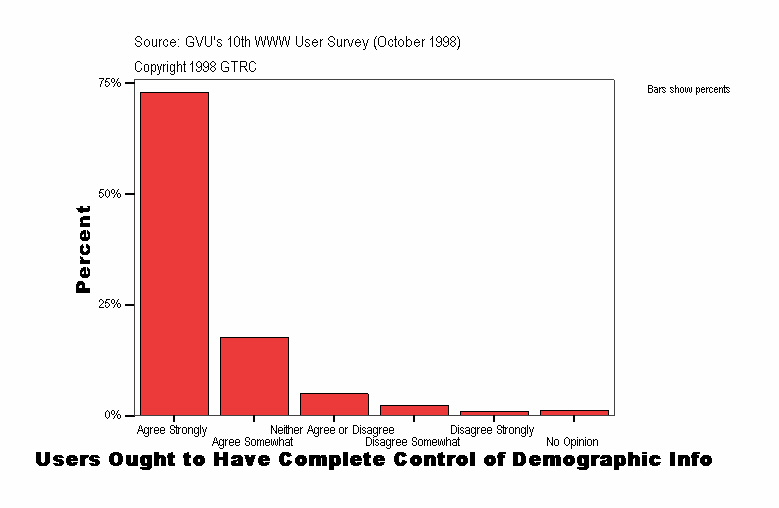
Users Ought to Have Complete Control of Demographic Info
|
Frequency |
Percent |
Valid Percent |
Cumulative Percent |
|---|
| Valid |
Agree Strongly |
1080
| 72.9
| 72.9
| 72.9
|
|---|
| Agree Somewhat |
261
| 17.6
| 17.6
| 90.5
|
|---|
| Neither Agree or Disagree |
73
| 4.9
| 4.9
| 95.4
|
|---|
| Disagree Somewhat |
34
| 2.3
| 2.3
| 97.7
|
|---|
| Disagree Strongly |
15
| 1.0
| 1.0
| 98.7
|
|---|
| No Opinion |
19
| 1.3
| 1.3
| 100.0
|
|---|
| Total |
1482
| 100.0
| 100.0
|
|
|---|
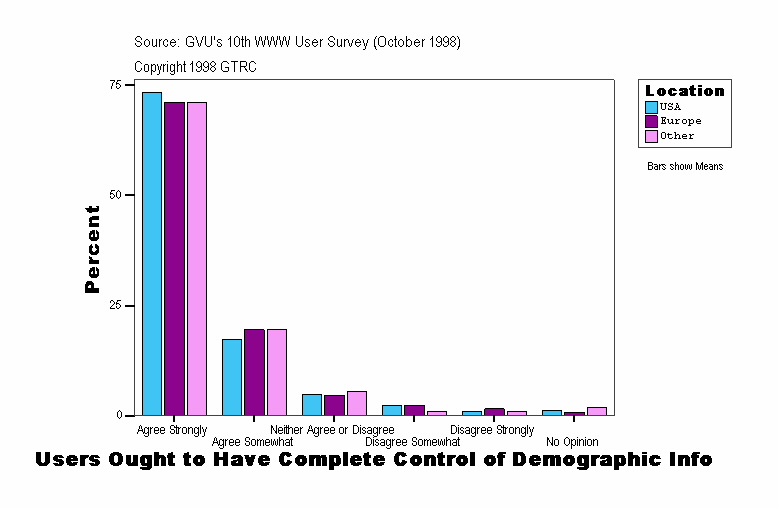
Users Ought to Have Complete Control of Demographic Info
| Location |
Frequency |
Percent |
Valid Percent |
Cumulative Percent |
|---|
| . |
Valid |
Agree Strongly |
17
| 70.8
| 70.8
| 70.8
|
|---|
| Agree Somewhat |
2
| 8.3
| 8.3
| 79.2
|
|---|
| Neither Agree or Disagree |
1
| 4.2
| 4.2
| 83.3
|
|---|
| Disagree Somewhat |
2
| 8.3
| 8.3
| 91.7
|
|---|
| Disagree Strongly |
1
| 4.2
| 4.2
| 95.8
|
|---|
| No Opinion |
1
| 4.2
| 4.2
| 100.0
|
|---|
| Total |
24
| 100.0
| 100.0
|
|
|---|
| USA |
Valid |
Agree Strongly |
896
| 73.3
| 73.3
| 73.3
|
|---|
| Agree Somewhat |
213
| 17.4
| 17.4
| 90.7
|
|---|
| Neither Agree or Disagree |
60
| 4.9
| 4.9
| 95.6
|
|---|
| Disagree Somewhat |
28
| 2.3
| 2.3
| 97.9
|
|---|
| Disagree Strongly |
11
| .9
| .9
| 98.8
|
|---|
| No Opinion |
15
| 1.2
| 1.2
| 100.0
|
|---|
| Total |
1223
| 100.0
| 100.0
|
|
|---|
| Europe |
Valid |
Agree Strongly |
91
| 71.1
| 71.1
| 71.1
|
|---|
| Agree Somewhat |
25
| 19.5
| 19.5
| 90.6
|
|---|
| Neither Agree or Disagree |
6
| 4.7
| 4.7
| 95.3
|
|---|
| Disagree Somewhat |
3
| 2.3
| 2.3
| 97.7
|
|---|
| Disagree Strongly |
2
| 1.6
| 1.6
| 99.2
|
|---|
| No Opinion |
1
| .8
| .8
| 100.0
|
|---|
| Total |
128
| 100.0
| 100.0
|
|
|---|
| Other |
Valid |
Agree Strongly |
76
| 71.0
| 71.0
| 71.0
|
|---|
| Agree Somewhat |
21
| 19.6
| 19.6
| 90.7
|
|---|
| Neither Agree or Disagree |
6
| 5.6
| 5.6
| 96.3
|
|---|
| Disagree Somewhat |
1
| .9
| .9
| 97.2
|
|---|
| Disagree Strongly |
1
| .9
| .9
| 98.1
|
|---|
| No Opinion |
2
| 1.9
| 1.9
| 100.0
|
|---|
| Total |
107
| 100.0
| 100.0
|
|
|---|
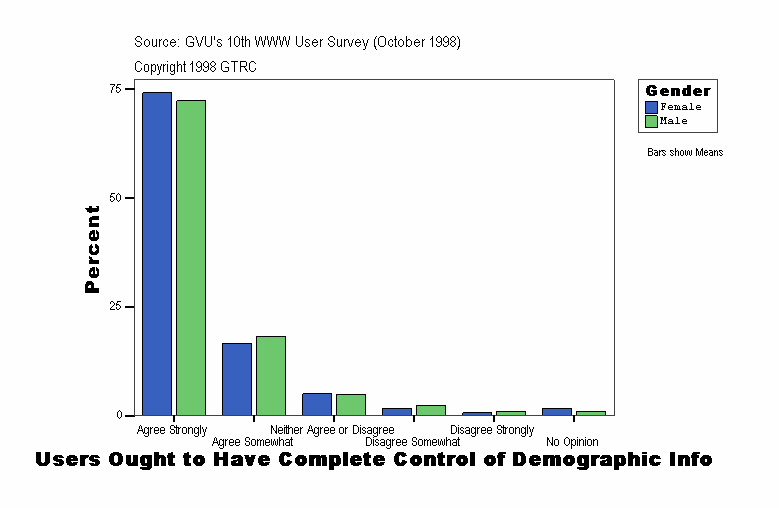
Users Ought to Have Complete Control of Demographic Info
| Gender |
Frequency |
Percent |
Valid Percent |
Cumulative Percent |
|---|
| . |
Valid |
Agree Strongly |
17
| 70.8
| 70.8
| 70.8
|
|---|
| Agree Somewhat |
2
| 8.3
| 8.3
| 79.2
|
|---|
| Neither Agree or Disagree |
1
| 4.2
| 4.2
| 83.3
|
|---|
| Disagree Somewhat |
2
| 8.3
| 8.3
| 91.7
|
|---|
| Disagree Strongly |
1
| 4.2
| 4.2
| 95.8
|
|---|
| No Opinion |
1
| 4.2
| 4.2
| 100.0
|
|---|
| Total |
24
| 100.0
| 100.0
|
|
|---|
| Female |
Valid |
Agree Strongly |
339
| 74.2
| 74.2
| 74.2
|
|---|
| Agree Somewhat |
76
| 16.6
| 16.6
| 90.8
|
|---|
| Neither Agree or Disagree |
23
| 5.0
| 5.0
| 95.8
|
|---|
| Disagree Somewhat |
8
| 1.8
| 1.8
| 97.6
|
|---|
| Disagree Strongly |
3
| .7
| .7
| 98.2
|
|---|
| No Opinion |
8
| 1.8
| 1.8
| 100.0
|
|---|
| Total |
457
| 100.0
| 100.0
|
|
|---|
| Male |
Valid |
Agree Strongly |
724
| 72.3
| 72.3
| 72.3
|
|---|
| Agree Somewhat |
183
| 18.3
| 18.3
| 90.6
|
|---|
| Neither Agree or Disagree |
49
| 4.9
| 4.9
| 95.5
|
|---|
| Disagree Somewhat |
24
| 2.4
| 2.4
| 97.9
|
|---|
| Disagree Strongly |
11
| 1.1
| 1.1
| 99.0
|
|---|
| No Opinion |
10
| 1.0
| 1.0
| 100.0
|
|---|
| Total |
1001
| 100.0
| 100.0
|
|
|---|
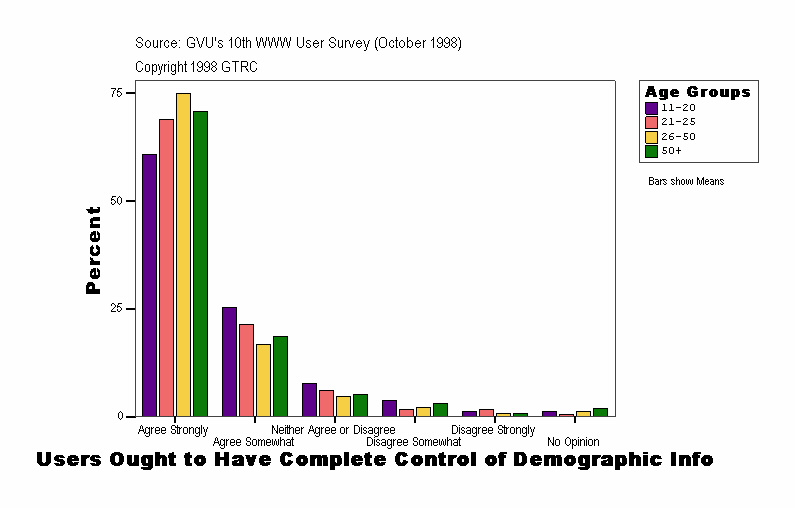
Users Ought to Have Complete Control of Demographic Info
| Age Groups |
Frequency |
Percent |
Valid Percent |
Cumulative Percent |
|---|
| . |
Valid |
Agree Strongly |
42
| 80.8
| 80.8
| 80.8
|
|---|
| Agree Somewhat |
2
| 3.8
| 3.8
| 84.6
|
|---|
| Neither Agree or Disagree |
1
| 1.9
| 1.9
| 86.5
|
|---|
| Disagree Somewhat |
2
| 3.8
| 3.8
| 90.4
|
|---|
| Disagree Strongly |
3
| 5.8
| 5.8
| 96.2
|
|---|
| No Opinion |
2
| 3.8
| 3.8
| 100.0
|
|---|
| Total |
52
| 100.0
| 100.0
|
|
|---|
| 11-20 |
Valid |
Agree Strongly |
48
| 60.8
| 60.8
| 60.8
|
|---|
| Agree Somewhat |
20
| 25.3
| 25.3
| 86.1
|
|---|
| Neither Agree or Disagree |
6
| 7.6
| 7.6
| 93.7
|
|---|
| Disagree Somewhat |
3
| 3.8
| 3.8
| 97.5
|
|---|
| Disagree Strongly |
1
| 1.3
| 1.3
| 98.7
|
|---|
| No Opinion |
1
| 1.3
| 1.3
| 100.0
|
|---|
| Total |
79
| 100.0
| 100.0
|
|
|---|
| 21-25 |
Valid |
Agree Strongly |
126
| 68.9
| 68.9
| 68.9
|
|---|
| Agree Somewhat |
39
| 21.3
| 21.3
| 90.2
|
|---|
| Neither Agree or Disagree |
11
| 6.0
| 6.0
| 96.2
|
|---|
| Disagree Somewhat |
3
| 1.6
| 1.6
| 97.8
|
|---|
| Disagree Strongly |
3
| 1.6
| 1.6
| 99.5
|
|---|
| No Opinion |
1
| .5
| .5
| 100.0
|
|---|
| Total |
183
| 100.0
| 100.0
|
|
|---|
| 26-50 |
Valid |
Agree Strongly |
671
| 75.0
| 75.0
| 75.0
|
|---|
| Agree Somewhat |
149
| 16.6
| 16.6
| 91.6
|
|---|
| Neither Agree or Disagree |
41
| 4.6
| 4.6
| 96.2
|
|---|
| Disagree Somewhat |
18
| 2.0
| 2.0
| 98.2
|
|---|
| Disagree Strongly |
6
| .7
| .7
| 98.9
|
|---|
| No Opinion |
10
| 1.1
| 1.1
| 100.0
|
|---|
| Total |
895
| 100.0
| 100.0
|
|
|---|
| 50+ |
Valid |
Agree Strongly |
193
| 70.7
| 70.7
| 70.7
|
|---|
| Agree Somewhat |
51
| 18.7
| 18.7
| 89.4
|
|---|
| Neither Agree or Disagree |
14
| 5.1
| 5.1
| 94.5
|
|---|
| Disagree Somewhat |
8
| 2.9
| 2.9
| 97.4
|
|---|
| Disagree Strongly |
2
| .7
| .7
| 98.2
|
|---|
| No Opinion |
5
| 1.8
| 1.8
| 100.0
|
|---|
| Total |
273
| 100.0
| 100.0
|
|
|---|
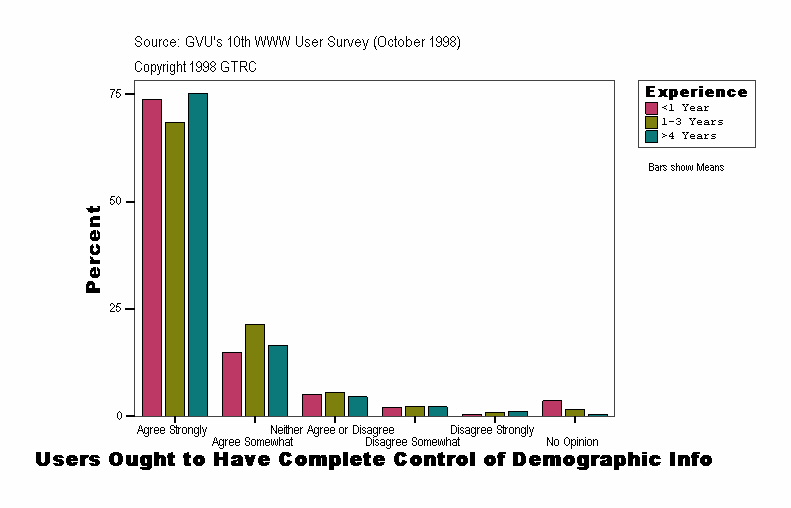
Users Ought to Have Complete Control of Demographic Info
| Experience |
Frequency |
Percent |
Valid Percent |
Cumulative Percent |
|---|
| . |
Valid |
Agree Strongly |
17
| 70.8
| 70.8
| 70.8
|
|---|
| Agree Somewhat |
2
| 8.3
| 8.3
| 79.2
|
|---|
| Neither Agree or Disagree |
1
| 4.2
| 4.2
| 83.3
|
|---|
| Disagree Somewhat |
2
| 8.3
| 8.3
| 91.7
|
|---|
| Disagree Strongly |
1
| 4.2
| 4.2
| 95.8
|
|---|
| No Opinion |
1
| 4.2
| 4.2
| 100.0
|
|---|
| Total |
24
| 100.0
| 100.0
|
|
|---|
| <1 Year |
Valid |
Agree Strongly |
143
| 73.7
| 73.7
| 73.7
|
|---|
| Agree Somewhat |
29
| 14.9
| 14.9
| 88.7
|
|---|
| Neither Agree or Disagree |
10
| 5.2
| 5.2
| 93.8
|
|---|
| Disagree Somewhat |
4
| 2.1
| 2.1
| 95.9
|
|---|
| Disagree Strongly |
1
| .5
| .5
| 96.4
|
|---|
| No Opinion |
7
| 3.6
| 3.6
| 100.0
|
|---|
| Total |
194
| 100.0
| 100.0
|
|
|---|
| 1-3 Years |
Valid |
Agree Strongly |
305
| 68.4
| 68.4
| 68.4
|
|---|
| Agree Somewhat |
95
| 21.3
| 21.3
| 89.7
|
|---|
| Neither Agree or Disagree |
25
| 5.6
| 5.6
| 95.3
|
|---|
| Disagree Somewhat |
10
| 2.2
| 2.2
| 97.5
|
|---|
| Disagree Strongly |
4
| .9
| .9
| 98.4
|
|---|
| No Opinion |
7
| 1.6
| 1.6
| 100.0
|
|---|
| Total |
446
| 100.0
| 100.0
|
|
|---|
| >4 Years |
Valid |
Agree Strongly |
615
| 75.2
| 75.2
| 75.2
|
|---|
| Agree Somewhat |
135
| 16.5
| 16.5
| 91.7
|
|---|
| Neither Agree or Disagree |
37
| 4.5
| 4.5
| 96.2
|
|---|
| Disagree Somewhat |
18
| 2.2
| 2.2
| 98.4
|
|---|
| Disagree Strongly |
9
| 1.1
| 1.1
| 99.5
|
|---|
| No Opinion |
4
| .5
| .5
| 100.0
|
|---|
| Total |
818
| 100.0
| 100.0
|
|
|---|
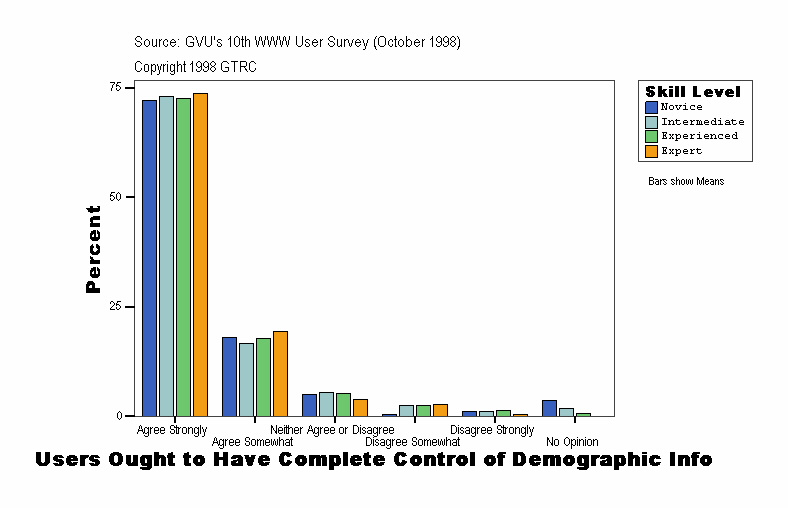
Users Ought to Have Complete Control of Demographic Info
| Skill Level |
Frequency |
Percent |
Valid Percent |
Cumulative Percent |
|---|
| . |
Valid |
Agree Strongly |
17
| 70.8
| 70.8
| 70.8
|
|---|
| Agree Somewhat |
2
| 8.3
| 8.3
| 79.2
|
|---|
| Neither Agree or Disagree |
1
| 4.2
| 4.2
| 83.3
|
|---|
| Disagree Somewhat |
2
| 8.3
| 8.3
| 91.7
|
|---|
| Disagree Strongly |
1
| 4.2
| 4.2
| 95.8
|
|---|
| No Opinion |
1
| 4.2
| 4.2
| 100.0
|
|---|
| Total |
24
| 100.0
| 100.0
|
|
|---|
| Novice |
Valid |
Agree Strongly |
144
| 72.0
| 72.0
| 72.0
|
|---|
| Agree Somewhat |
36
| 18.0
| 18.0
| 90.0
|
|---|
| Neither Agree or Disagree |
10
| 5.0
| 5.0
| 95.0
|
|---|
| Disagree Somewhat |
1
| .5
| .5
| 95.5
|
|---|
| Disagree Strongly |
2
| 1.0
| 1.0
| 96.5
|
|---|
| No Opinion |
7
| 3.5
| 3.5
| 100.0
|
|---|
| Total |
200
| 100.0
| 100.0
|
|
|---|
| Intermediate |
Valid |
Agree Strongly |
301
| 73.1
| 73.1
| 73.1
|
|---|
| Agree Somewhat |
68
| 16.5
| 16.5
| 89.6
|
|---|
| Neither Agree or Disagree |
22
| 5.3
| 5.3
| 94.9
|
|---|
| Disagree Somewhat |
10
| 2.4
| 2.4
| 97.3
|
|---|
| Disagree Strongly |
4
| 1.0
| 1.0
| 98.3
|
|---|
| No Opinion |
7
| 1.7
| 1.7
| 100.0
|
|---|
| Total |
412
| 100.0
| 100.0
|
|
|---|
| Experienced |
Valid |
Agree Strongly |
404
| 72.7
| 72.7
| 72.7
|
|---|
| Agree Somewhat |
99
| 17.8
| 17.8
| 90.5
|
|---|
| Neither Agree or Disagree |
29
| 5.2
| 5.2
| 95.7
|
|---|
| Disagree Somewhat |
13
| 2.3
| 2.3
| 98.0
|
|---|
| Disagree Strongly |
7
| 1.3
| 1.3
| 99.3
|
|---|
| No Opinion |
4
| .7
| .7
| 100.0
|
|---|
| Total |
556
| 100.0
| 100.0
|
|
|---|
| Expert |
Valid |
Agree Strongly |
214
| 73.8
| 73.8
| 73.8
|
|---|
| Agree Somewhat |
56
| 19.3
| 19.3
| 93.1
|
|---|
| Neither Agree or Disagree |
11
| 3.8
| 3.8
| 96.9
|
|---|
| Disagree Somewhat |
8
| 2.8
| 2.8
| 99.7
|
|---|
| Disagree Strongly |
1
| .3
| .3
| 100.0
|
|---|
| Total |
290
| 100.0
| 100.0
|
|
|---|
Source: GVU's Tenth WWW User Survey (Conducted October 1998)
URL:http://www.gvu.gatech.edu/user_surveys/
Copyright 1998 GTRC - ALL RIGHTS RESERVED
Contact: www-survey@cc.gatech.edu
For more information or to submit comments:
send email to www-survey@cc.gatech.edu.
GVU's WWW Surveying Team
Graphics, Visualization, & Usability Center
College of Computing
Georgia Institute of Technology
Atlanta, GA 30332-0280
