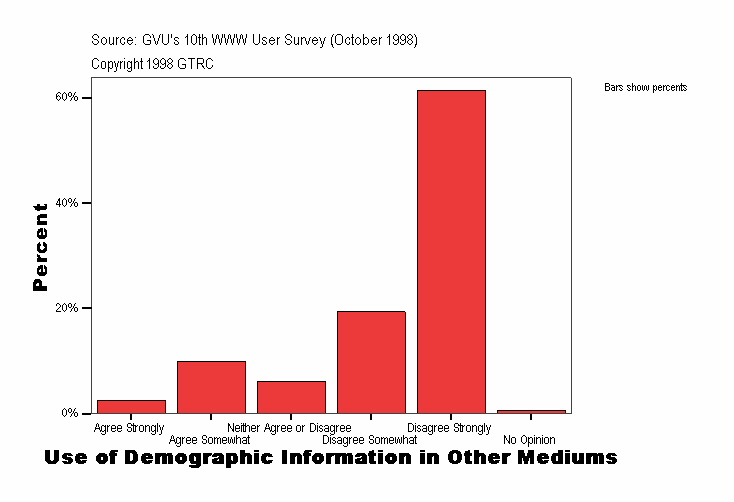
Use of Demographic Information in Other Mediums
|
Frequency |
Percent |
Valid Percent |
Cumulative Percent |
|---|
| Valid |
Agree Strongly |
38
| 2.6
| 2.6
| 2.6
|
|---|
| Agree Somewhat |
147
| 9.9
| 9.9
| 12.5
|
|---|
| Neither Agree or Disagree |
92
| 6.2
| 6.2
| 18.7
|
|---|
| Disagree Somewhat |
287
| 19.4
| 19.4
| 38.1
|
|---|
| Disagree Strongly |
909
| 61.3
| 61.3
| 99.4
|
|---|
| No Opinion |
9
| .6
| .6
| 100.0
|
|---|
| Total |
1482
| 100.0
| 100.0
|
|
|---|
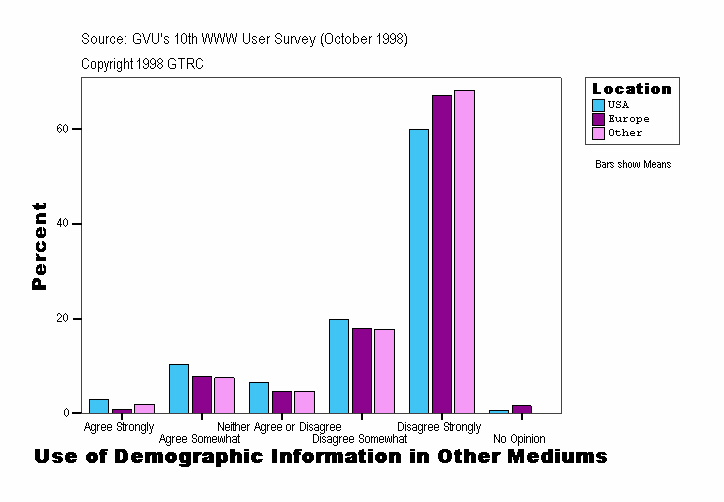
Use of Demographic Information in Other Mediums
| Location |
Frequency |
Percent |
Valid Percent |
Cumulative Percent |
|---|
| . |
Valid |
Agree Somewhat |
3
| 12.5
| 12.5
| 12.5
|
|---|
| Neither Agree or Disagree |
1
| 4.2
| 4.2
| 16.7
|
|---|
| Disagree Somewhat |
2
| 8.3
| 8.3
| 25.0
|
|---|
| Disagree Strongly |
17
| 70.8
| 70.8
| 95.8
|
|---|
| No Opinion |
1
| 4.2
| 4.2
| 100.0
|
|---|
| Total |
24
| 100.0
| 100.0
|
|
|---|
| USA |
Valid |
Agree Strongly |
35
| 2.9
| 2.9
| 2.9
|
|---|
| Agree Somewhat |
126
| 10.3
| 10.3
| 13.2
|
|---|
| Neither Agree or Disagree |
80
| 6.5
| 6.5
| 19.7
|
|---|
| Disagree Somewhat |
243
| 19.9
| 19.9
| 39.6
|
|---|
| Disagree Strongly |
733
| 59.9
| 59.9
| 99.5
|
|---|
| No Opinion |
6
| .5
| .5
| 100.0
|
|---|
| Total |
1223
| 100.0
| 100.0
|
|
|---|
| Europe |
Valid |
Agree Strongly |
1
| .8
| .8
| .8
|
|---|
| Agree Somewhat |
10
| 7.8
| 7.8
| 8.6
|
|---|
| Neither Agree or Disagree |
6
| 4.7
| 4.7
| 13.3
|
|---|
| Disagree Somewhat |
23
| 18.0
| 18.0
| 31.3
|
|---|
| Disagree Strongly |
86
| 67.2
| 67.2
| 98.4
|
|---|
| No Opinion |
2
| 1.6
| 1.6
| 100.0
|
|---|
| Total |
128
| 100.0
| 100.0
|
|
|---|
| Other |
Valid |
Agree Strongly |
2
| 1.9
| 1.9
| 1.9
|
|---|
| Agree Somewhat |
8
| 7.5
| 7.5
| 9.3
|
|---|
| Neither Agree or Disagree |
5
| 4.7
| 4.7
| 14.0
|
|---|
| Disagree Somewhat |
19
| 17.8
| 17.8
| 31.8
|
|---|
| Disagree Strongly |
73
| 68.2
| 68.2
| 100.0
|
|---|
| Total |
107
| 100.0
| 100.0
|
|
|---|
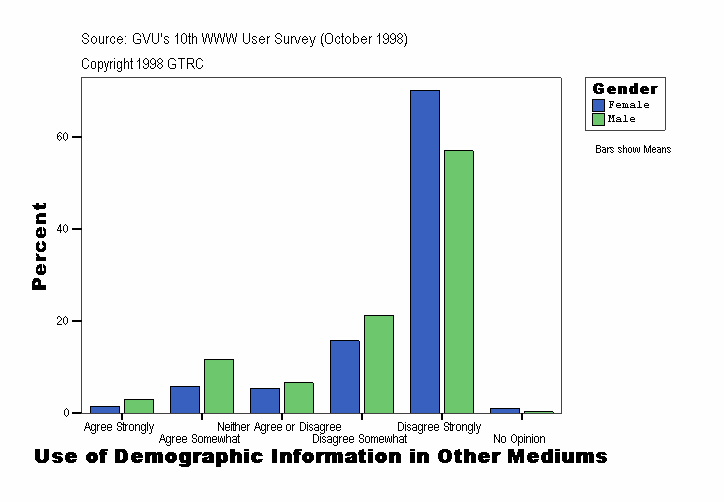
Use of Demographic Information in Other Mediums
| Gender |
Frequency |
Percent |
Valid Percent |
Cumulative Percent |
|---|
| . |
Valid |
Agree Somewhat |
3
| 12.5
| 12.5
| 12.5
|
|---|
| Neither Agree or Disagree |
1
| 4.2
| 4.2
| 16.7
|
|---|
| Disagree Somewhat |
2
| 8.3
| 8.3
| 25.0
|
|---|
| Disagree Strongly |
17
| 70.8
| 70.8
| 95.8
|
|---|
| No Opinion |
1
| 4.2
| 4.2
| 100.0
|
|---|
| Total |
24
| 100.0
| 100.0
|
|
|---|
| Female |
Valid |
Agree Strongly |
7
| 1.5
| 1.5
| 1.5
|
|---|
| Agree Somewhat |
27
| 5.9
| 5.9
| 7.4
|
|---|
| Neither Agree or Disagree |
25
| 5.5
| 5.5
| 12.9
|
|---|
| Disagree Somewhat |
72
| 15.8
| 15.8
| 28.7
|
|---|
| Disagree Strongly |
321
| 70.2
| 70.2
| 98.9
|
|---|
| No Opinion |
5
| 1.1
| 1.1
| 100.0
|
|---|
| Total |
457
| 100.0
| 100.0
|
|
|---|
| Male |
Valid |
Agree Strongly |
31
| 3.1
| 3.1
| 3.1
|
|---|
| Agree Somewhat |
117
| 11.7
| 11.7
| 14.8
|
|---|
| Neither Agree or Disagree |
66
| 6.6
| 6.6
| 21.4
|
|---|
| Disagree Somewhat |
213
| 21.3
| 21.3
| 42.7
|
|---|
| Disagree Strongly |
571
| 57.0
| 57.0
| 99.7
|
|---|
| No Opinion |
3
| .3
| .3
| 100.0
|
|---|
| Total |
1001
| 100.0
| 100.0
|
|
|---|
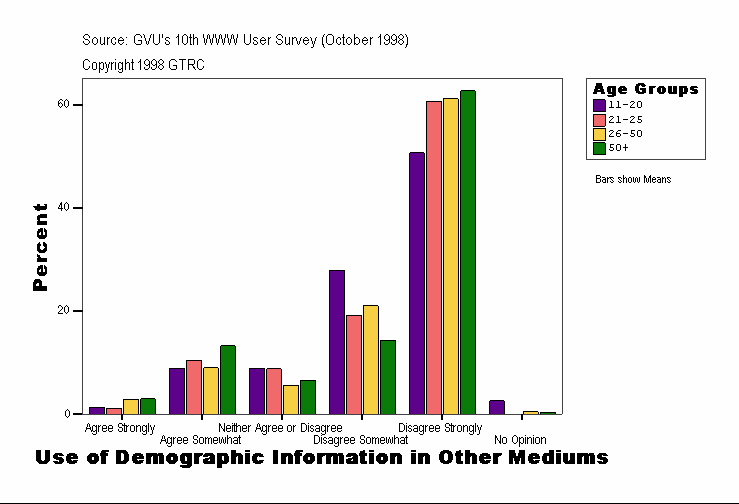
Use of Demographic Information in Other Mediums
| Age Groups |
Frequency |
Percent |
Valid Percent |
Cumulative Percent |
|---|
| . |
Valid |
Agree Strongly |
1
| 1.9
| 1.9
| 1.9
|
|---|
| Agree Somewhat |
5
| 9.6
| 9.6
| 11.5
|
|---|
| Neither Agree or Disagree |
1
| 1.9
| 1.9
| 13.5
|
|---|
| Disagree Somewhat |
3
| 5.8
| 5.8
| 19.2
|
|---|
| Disagree Strongly |
40
| 76.9
| 76.9
| 96.2
|
|---|
| No Opinion |
2
| 3.8
| 3.8
| 100.0
|
|---|
| Total |
52
| 100.0
| 100.0
|
|
|---|
| 11-20 |
Valid |
Agree Strongly |
1
| 1.3
| 1.3
| 1.3
|
|---|
| Agree Somewhat |
7
| 8.9
| 8.9
| 10.1
|
|---|
| Neither Agree or Disagree |
7
| 8.9
| 8.9
| 19.0
|
|---|
| Disagree Somewhat |
22
| 27.8
| 27.8
| 46.8
|
|---|
| Disagree Strongly |
40
| 50.6
| 50.6
| 97.5
|
|---|
| No Opinion |
2
| 2.5
| 2.5
| 100.0
|
|---|
| Total |
79
| 100.0
| 100.0
|
|
|---|
| 21-25 |
Valid |
Agree Strongly |
2
| 1.1
| 1.1
| 1.1
|
|---|
| Agree Somewhat |
19
| 10.4
| 10.4
| 11.5
|
|---|
| Neither Agree or Disagree |
16
| 8.7
| 8.7
| 20.2
|
|---|
| Disagree Somewhat |
35
| 19.1
| 19.1
| 39.3
|
|---|
| Disagree Strongly |
111
| 60.7
| 60.7
| 100.0
|
|---|
| Total |
183
| 100.0
| 100.0
|
|
|---|
| 26-50 |
Valid |
Agree Strongly |
26
| 2.9
| 2.9
| 2.9
|
|---|
| Agree Somewhat |
80
| 8.9
| 8.9
| 11.8
|
|---|
| Neither Agree or Disagree |
50
| 5.6
| 5.6
| 17.4
|
|---|
| Disagree Somewhat |
188
| 21.0
| 21.0
| 38.4
|
|---|
| Disagree Strongly |
547
| 61.1
| 61.1
| 99.6
|
|---|
| No Opinion |
4
| .4
| .4
| 100.0
|
|---|
| Total |
895
| 100.0
| 100.0
|
|
|---|
| 50+ |
Valid |
Agree Strongly |
8
| 2.9
| 2.9
| 2.9
|
|---|
| Agree Somewhat |
36
| 13.2
| 13.2
| 16.1
|
|---|
| Neither Agree or Disagree |
18
| 6.6
| 6.6
| 22.7
|
|---|
| Disagree Somewhat |
39
| 14.3
| 14.3
| 37.0
|
|---|
| Disagree Strongly |
171
| 62.6
| 62.6
| 99.6
|
|---|
| No Opinion |
1
| .4
| .4
| 100.0
|
|---|
| Total |
273
| 100.0
| 100.0
|
|
|---|
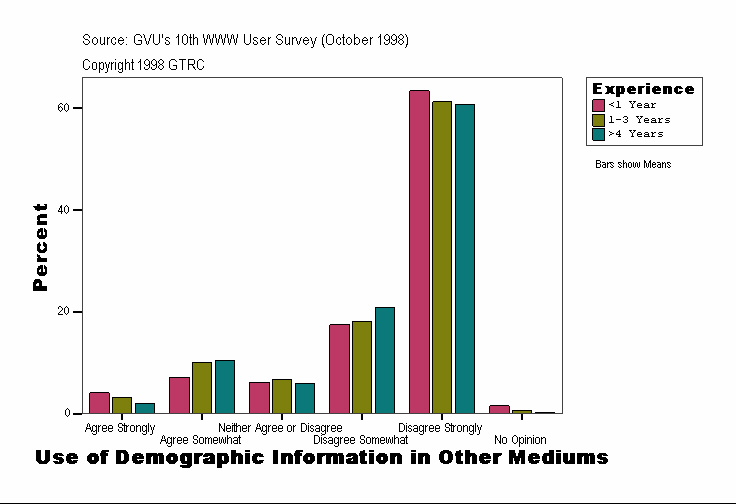
Use of Demographic Information in Other Mediums
| Experience |
Frequency |
Percent |
Valid Percent |
Cumulative Percent |
|---|
| . |
Valid |
Agree Somewhat |
3
| 12.5
| 12.5
| 12.5
|
|---|
| Neither Agree or Disagree |
1
| 4.2
| 4.2
| 16.7
|
|---|
| Disagree Somewhat |
2
| 8.3
| 8.3
| 25.0
|
|---|
| Disagree Strongly |
17
| 70.8
| 70.8
| 95.8
|
|---|
| No Opinion |
1
| 4.2
| 4.2
| 100.0
|
|---|
| Total |
24
| 100.0
| 100.0
|
|
|---|
| <1 Year |
Valid |
Agree Strongly |
8
| 4.1
| 4.1
| 4.1
|
|---|
| Agree Somewhat |
14
| 7.2
| 7.2
| 11.3
|
|---|
| Neither Agree or Disagree |
12
| 6.2
| 6.2
| 17.5
|
|---|
| Disagree Somewhat |
34
| 17.5
| 17.5
| 35.1
|
|---|
| Disagree Strongly |
123
| 63.4
| 63.4
| 98.5
|
|---|
| No Opinion |
3
| 1.5
| 1.5
| 100.0
|
|---|
| Total |
194
| 100.0
| 100.0
|
|
|---|
| 1-3 Years |
Valid |
Agree Strongly |
14
| 3.1
| 3.1
| 3.1
|
|---|
| Agree Somewhat |
45
| 10.1
| 10.1
| 13.2
|
|---|
| Neither Agree or Disagree |
30
| 6.7
| 6.7
| 20.0
|
|---|
| Disagree Somewhat |
81
| 18.2
| 18.2
| 38.1
|
|---|
| Disagree Strongly |
273
| 61.2
| 61.2
| 99.3
|
|---|
| No Opinion |
3
| .7
| .7
| 100.0
|
|---|
| Total |
446
| 100.0
| 100.0
|
|
|---|
| >4 Years |
Valid |
Agree Strongly |
16
| 2.0
| 2.0
| 2.0
|
|---|
| Agree Somewhat |
85
| 10.4
| 10.4
| 12.3
|
|---|
| Neither Agree or Disagree |
49
| 6.0
| 6.0
| 18.3
|
|---|
| Disagree Somewhat |
170
| 20.8
| 20.8
| 39.1
|
|---|
| Disagree Strongly |
496
| 60.6
| 60.6
| 99.8
|
|---|
| No Opinion |
2
| .2
| .2
| 100.0
|
|---|
| Total |
818
| 100.0
| 100.0
|
|
|---|
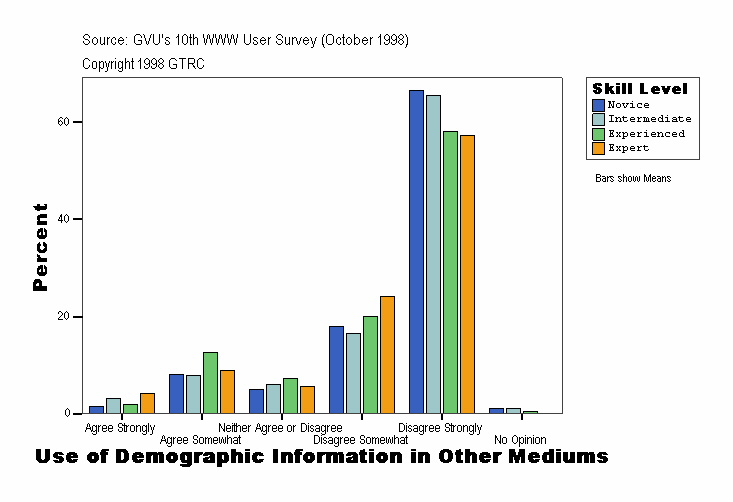
Use of Demographic Information in Other Mediums
| Skill Level |
Frequency |
Percent |
Valid Percent |
Cumulative Percent |
|---|
| . |
Valid |
Agree Somewhat |
3
| 12.5
| 12.5
| 12.5
|
|---|
| Neither Agree or Disagree |
1
| 4.2
| 4.2
| 16.7
|
|---|
| Disagree Somewhat |
2
| 8.3
| 8.3
| 25.0
|
|---|
| Disagree Strongly |
17
| 70.8
| 70.8
| 95.8
|
|---|
| No Opinion |
1
| 4.2
| 4.2
| 100.0
|
|---|
| Total |
24
| 100.0
| 100.0
|
|
|---|
| Novice |
Valid |
Agree Strongly |
3
| 1.5
| 1.5
| 1.5
|
|---|
| Agree Somewhat |
16
| 8.0
| 8.0
| 9.5
|
|---|
| Neither Agree or Disagree |
10
| 5.0
| 5.0
| 14.5
|
|---|
| Disagree Somewhat |
36
| 18.0
| 18.0
| 32.5
|
|---|
| Disagree Strongly |
133
| 66.5
| 66.5
| 99.0
|
|---|
| No Opinion |
2
| 1.0
| 1.0
| 100.0
|
|---|
| Total |
200
| 100.0
| 100.0
|
|
|---|
| Intermediate |
Valid |
Agree Strongly |
13
| 3.2
| 3.2
| 3.2
|
|---|
| Agree Somewhat |
32
| 7.8
| 7.8
| 10.9
|
|---|
| Neither Agree or Disagree |
25
| 6.1
| 6.1
| 17.0
|
|---|
| Disagree Somewhat |
68
| 16.5
| 16.5
| 33.5
|
|---|
| Disagree Strongly |
270
| 65.5
| 65.5
| 99.0
|
|---|
| No Opinion |
4
| 1.0
| 1.0
| 100.0
|
|---|
| Total |
412
| 100.0
| 100.0
|
|
|---|
| Experienced |
Valid |
Agree Strongly |
10
| 1.8
| 1.8
| 1.8
|
|---|
| Agree Somewhat |
70
| 12.6
| 12.6
| 14.4
|
|---|
| Neither Agree or Disagree |
40
| 7.2
| 7.2
| 21.6
|
|---|
| Disagree Somewhat |
111
| 20.0
| 20.0
| 41.5
|
|---|
| Disagree Strongly |
323
| 58.1
| 58.1
| 99.6
|
|---|
| No Opinion |
2
| .4
| .4
| 100.0
|
|---|
| Total |
556
| 100.0
| 100.0
|
|
|---|
| Expert |
Valid |
Agree Strongly |
12
| 4.1
| 4.1
| 4.1
|
|---|
| Agree Somewhat |
26
| 9.0
| 9.0
| 13.1
|
|---|
| Neither Agree or Disagree |
16
| 5.5
| 5.5
| 18.6
|
|---|
| Disagree Somewhat |
70
| 24.1
| 24.1
| 42.8
|
|---|
| Disagree Strongly |
166
| 57.2
| 57.2
| 100.0
|
|---|
| Total |
290
| 100.0
| 100.0
|
|
|---|
Source: GVU's Tenth WWW User Survey (Conducted October 1998)
URL:http://www.gvu.gatech.edu/user_surveys/
Copyright 1998 GTRC - ALL RIGHTS RESERVED
Contact: www-survey@cc.gatech.edu
For more information or to submit comments:
send email to www-survey@cc.gatech.edu.
GVU's WWW Surveying Team
Graphics, Visualization, & Usability Center
College of Computing
Georgia Institute of Technology
Atlanta, GA 30332-0280
