The instances were drawn randomly from a database
of 7 outdoor images. The images were handsegmented
to create a classification for every pixel. Each
instance is a 3x3 region.
Number of Instances: 2310
Number of Attributes: 19 continuous attributes
Attribute Information:
- 1. region-centroid-col: the column of the
center pixel of the region.
- 2. region-centroid-row: the row of the center
pixel of the region.
- 3. region-pixel-count: the number of pixels
in a region = 9.
- 4. short-line-density-5: the results of a line
extractoin algorithm that counts how many lines
of length 5 (any orientation) with low contrast,
less than or equal to 5, go through the region.
- 5. short-line-density-2: same as short-line-
density-5 but counts lines of high contrast,
greater than 5.
- 6. vedge-mean: measure the contrast of
horizontally adjacent pixels in the region.
There are 6, the mean and standard deviation
are given. This attribute is used as a vertical
edge detector.
- 7. vegde-sd: (see 6)
- 8. hedge-mean: measures the contrast of
vertically adjacent pixels. Used for horizontal
line detection.
- 9. hedge-sd: (see 8).
- 10. intensity-mean: the average over the region
of (R + G + B)/3
- 11. rawred-mean: the average over the region of the R value.
- 12. rawblue-mean: the average over the region of the B
value.
- 13. rawgreen-mean: the average over the region of the G
value.
- 14. exred-mean: measure the excess red: (2R - (G + B))
- 15. exblue-mean: measure the excess blue: (2B - (G + R))
- 16. exgreen-mean: measure the excess green: (2G - (R +
B))
- 17. value-mean: 3-d nonlinear transformation of RGB. (Algorithm
can be found in Foley and VanDam, Fundamentals of Interactive Computer Graphics)
- 18. saturatoin-mean: (see 17)
- 19. hue-mean: (see 17)
Class Distribution:
- 1 = brickface,
- 2 = sky,
- 3 = foliage,
- 4 = cement,
- 5 = window,
- 6 = path,
- 7 = grass.
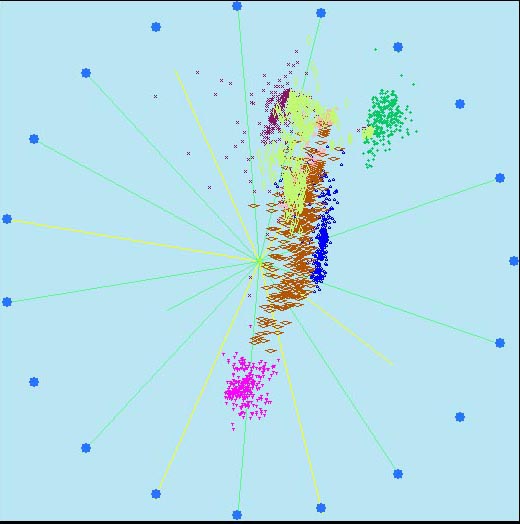
Vista visualization: that's an example
that Vista can't not seperate all classes very well by only one plane.
Download the dataset