The
goal of interactive operations is to explore and visualize the dataset in different projection planes that separate the overlapped clusters. The set of interactive
operations supported in VISTA include alpha parameter adjustment, random rendering, subset selection, zooming, focus changing, axis rotation, cluster marking/unmarking, and labeling/unlabeling. Continuous interactive operations, mainly
alpha parameter adjustment, zooming (and axis rotation), can create dynamic visualization.
Our experience shows that the
user can often get much more information from dynamic visualizations than static ones.
1.
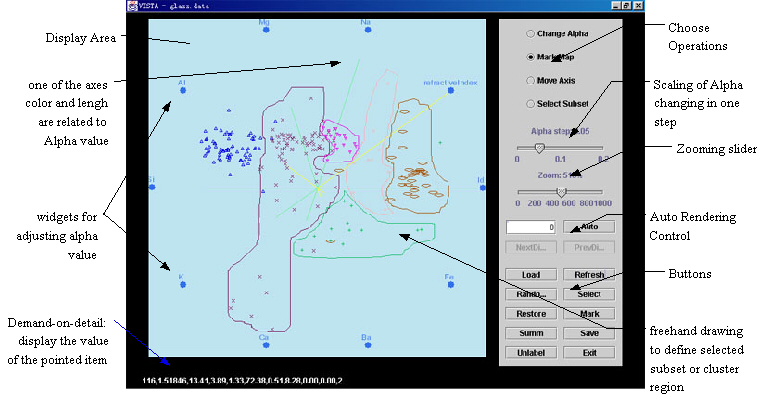
Operation Modes at the right upper corner
Operation
modes are used to clarify the semantics of different operations and to
make all of the operations compatible in the cluster rendering system.
"Change alpha", "move axis", "select subset" and "mark map" specify the
four kinds of operation modes. Before adjusting the alpha values, the mode should be shifted to "change alpha". Before moving axes, make sure to set the mode to "move axis". In the mode of "Select subset", the user can do a couple of operations: choosing
a subset for drill-down showing, or for marking a cluster. The "mark map" mode is used for marking
the "cluster map", which is used for ClusterMap labeling algorithm. Other
operations can be done in any modes, such as "unmarking a cluster",
"loading", "labeling" and so on.
2.
Basic operations
-
Alpha
parameter adjustment changes the projection
plane and refreshes the dataset in real time. The alpha widgets follow the distribution of star coordinates(the small blue circle at the end of each axis, used
to adjust the dimensional alpha values). After loading a dataset, the
axes ( i = 1, 2, … , k), which correspond to the k dimensions,
are created, and the initial alpha values i (i = 1, 2, … , k)
are set to 0.5. To change alpha values, you need to set the operation
mode to "change alpha" first. By pressing and holding the mouse button
on some alpha widget, the corresponding alpha value is increased, and by pressing
mouse button plus "Ctrl" key the alpha value will be decreased. With the
increasing or decreasing of alpha value, the length and the color of axis are changed too. Longer axis represents the larger absolute alpha value. Green color represents the positive value from 0 to 1, and yellow color represents the negative value from -1 to 0.
-
Zooming
helps users explore the details or the overview of the dataset. Sliding
the zooming silder, you will see the visualization being changed with the
zooming percentage.
-
Subset
Selection by region defines the subset by drawing the selected area on screen. A defined subset can be used for further processing, such as cluster
marking or exclusively showing the selected subset. Subset selection is done by freehand drawing on the area you are interested in the "select subset" operation mode.
-
Range
selection defines the subset by selecting a range of values for the interested dimension.
The visualization is changed in real time when the range is changed. The
selected subest has the same properties as those defined by region selection.
-
Focus
changing shifts the center of visualization, which allows the user to move the focus to certain part of a large visualization. Move the mouse ponter to the new focus on the screen, hold "shift" key and click the left mouse button to finish this operation.
-
Axis
rotation changes the position of an axis and thus changes the weight
of a dimension or a set of dimensions to observe the correlation between
dimensions. Before doing rotation, you need to shift the operation mode to "move axis" and then drag the corresponding
alpha widget to a different angle. The visualization will be changed with
the axis rotation. Axis rotation is usually not necessary since it is equivalent to the combination of alpha adjustments and zooming
-
Cluster
marking/unmarking marks the selected subset as a cluster or cancels
the marked cluster. After selecting the subset, click the "mark" button
to mark the cluster. You can also move the mouse pointer to any data point in a marked
cluster area and press "ctrl" key and the left mouse button at the same time to unmark the
cluster.
-
Subset
Extraction shows the selected subset only, removing all other points from the visualization. Click the "select" button after you select a subset region.
Subset extraction can also be done repeatedly upon an existing extraction. Therefore, the user can go into any level of details of a dense point cloud by subset abstraction.
The visualizaiton can be recovered by press the "restore" button.
-
Label
loading loads the clustering result produced by other systems. By clicking
the "label" button, you are able to choose the label file,
usually with an extension ".lbl" if you loaded a labeled dataset. A label file contains a single column of labels, corresponding to the data records.
-
Random
rendering changes all of the alpha parameters randomly at the same
time and thus helps users to find interesting visual clues quickly. Click the "random" button, the name of the "random" button will be changed to "stop" and the visualizatoin starts changing randomly - not totally randomly, the nearby visualizations are similar and they are actually smoothly changed. When you find any interesting
pattern, click the "stop" button to quit random rendering.
-
Auto
rendering changes each alpha parameters in counter-clockwise order.
The "auto rendering" control area has 1 textbox and 3 control buttons. To
start auto rendering, set the number of the beginning dimension at the
textbox and click the "Auto" button. The corresponding alpha value will being changed circularly -- being increased to 1 then decreased to -1 and then
increased to 1 again... When you need to stop the rendering at some visualization,
click the "Stop" button, or the "NextDim" button to switch to the next dimension,
or the "PrevDim" button to render the previous one.
3.
Sliders
-
Alpha
slider: is used to adjust the scale of an alpha adjustment
step
-
Zooming
slider: is used to change the zooming percentage.
4.
Buttons
-
Load:
allows to select a file to load, with option settings After loading the file, the initial visualization
is created and shown on screen.
-
Refresh:
when part of visualization is destroyed by upper windows, press "refresh"
button to update the visualization
-
Random:
for "random rendering"
-
Select
and restore: for "subset abstraction"
-
Mark:
for "cluster marking"
-
Summ:
summary of the marked clusters, including some statistical info.
-
Save:
for saving the "cluster map", the visual parameter setting, and other information
-
Label:
for loading cluster labels and marking each
clusters automatically
-
Exit:
exiting the system
5.
Demand-on-detail
Move the
mouse pointer to any data point in visualization. The corresponding data record (the row in the original data file) will
be shown at the bottom of the visualization.