School of computer science
Georgia Institute of Technology
CS6290HPCA Fall 2009
Programming assignment #1
Due: Friday, September 11, 6:00 pm
Hyesoon Kim, Instructor
This is an individual assignment. You can discuss this assignment with other classmates but you should do your assignment individually. Please follow the submission instructions. If you do not follow the submission file names, you will not receive the full credit. Please check the class homepage to see the latest update. Your code must run on killerbee[1-5].cc.gatech.edu with g++4.1.
Introduction
In this assignment, you will implement a simple one-wide in-order 5
stage pipeline trace driven simulator. We provide a simulator frame
to help your assignment. Your job is to complete the simulator to
simulate the following architecture.
Descriptions of the pipeline
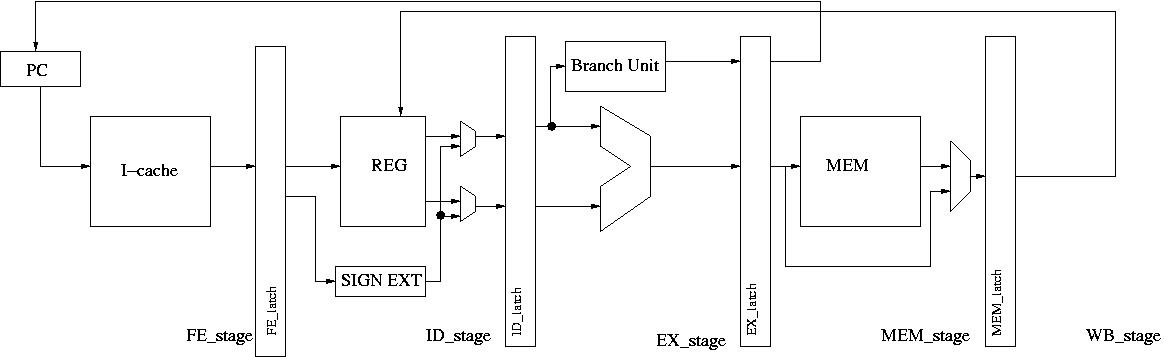
This is a simple in order 5-Stage pipeline processor. The simulator executes RISC type ops which are defined at sim.h file.
The major features of each pipeline are as follows:
FE_stage: it accesses the I-cache and it reads an op (instruction) from a trace file.
ID_stage: It reads the register file. If source register files are not
ready, there should be a pipeline stall. If an instruction is a control flow
instruction, the FE_stage stalls until the branch instruction forwards
the target address at the MEM-stage.
EX_stage: Instructions are executed here. If an instruction takes more
than one cycle, (there is the get_op_latency function to check the
latency of each instruction), the FE_stage, and ID_stage should stall.
MEM_stage: It accesses the d-cache. The branch target address is
forwarded at this stage.
The front end can fetch a new instruction from the following cycle. Note that
the target address is the input of the PC latch
WB_stage: An instruction is retired at this stage. A destination
register is available at this moment. During the first half cycle, it writes value into the register file and
the second half cycle, the processor reads the register file. Note that, there is no data
forwarding and no branch prediction for this assignment.
Simulator Description
The simulator simulates one processor cycle via the run_a_cycle function. This function calls the following functions, each of which corresponds to one of the stages in the pipeline:
1. FE_stage():
2. ID_stage();
3. EX_stage();
4. MEM_stage();
5. WB_stage();
Your main job is to implement the above five functions which represent
each pipeline stage respectively. Note that there are other functions
you still need to add more features such as init_structures() but the
above 5 functions are the main functions which you need to implement.
We have also provided you with interfaces to the instruction and data
caches: icache_access and dcache_access functions. Icache_access and
dcache_access function always return TRUE for this assignment which
models a perfect I-cache and D-cache. However, in the later labs you
will implement a real cache and change the pipeline to handle cache
miss.
Some important tips
You may add more elements in the Op structure. However, if you update more elements, you must update the init_op function whenever you add new elements.
The simulator must call free_op after an op is retired.
If you call get_free_op but if you do not use the op, you must call free_op to free the resources
You may not understand and should not modify the following functions: get_ld_ea, get_st_ea, get_target, ins_decode, write_inst, dprint_inst, init_op_latency, copy_trace_op, init_trace_op, print_stats, print_pipeline.
You may modify init_op, init_op_pool, get_free_op, free_op, get_op, get_op_latency, print_heartbeat, and functions, but it is better for you to look at them.
We assume 32 number architecture register file system.
Data structures are in the code: We provide data structures to guide your programming. You can modify data structures to add more data elements.
You can add your own knobs but please do not modify the existing knob variables. Knob variables are used for grading. Please look at the Pin manual to understand more about the KNOB data structure. (Understanding Knob variables are required to do this assignment. )
Do not modify print_stats and print_pipeline function. You must implement the following variables correctly (retired_instruction, data_hazard_count, control_hazard_count, pipeline_latch data structure (op_arrays, op_array_valid), register_file (valid bit) ) to receive a full credit. Note that data_hazard_count and control_hazard_count are only incremented at the DE_stage. One op should not increment data_hazard_count more than once.
In assignment #2, you will extend your first assignment. The code contains some simulator frame structures for assignment #2.
How to execute the simulator
Instruction:
Download pin , version 27887, gcc 4.0
copy lab1.tar.gz file under your pin directory (pin-2.6-27887-gcc.4.0.0-ia32_intel64-linux/source/tools)
cd pin-2.6-27887-gcc.4.0.0-ia32_intel64-linux/source/tools
tar -xvf lab1.tar.gz
cd lab1
make
../../../pin -t obj-intel64/sim.so -readtrace 1 -printinst 1 -max_sim_count 10 -print_pipe_freq 1 -- /bin/ls
../../../pin -t obj-intel64/sim.so -readtrace 1 -printinst 1 -max_inst_count 10 -print_pipe_freq 1 -- /bin/ls
Useful knob variables:
KNOB_OUTPUT_FILE: set the output filename of the print_stats function
KNOB_TRACE_NAME: set the input trace file name
KNOB_READ_TRACE: (1): read trace and execute the simulator (0): execute the binary
You should not set 1 for both KNOB_WRITE_TRACE and KNOB_READ_TRACE. Only one of them has to be 1.
KNOB_MAX_SIM_COUNT: set the maximum cycle_count for the simulation
KNOB_MAX_INST_COUNT: set the maximum inst_count for the simulation
KNOB_PRINIT_PIPE_FREQ: set the frequency of calling print_pipeline() function
The same sim.so tool is used for generating traces and also simulating a trace driven simulator. When sim.so is used for a trace driven simulator, the tool does not execute the binary.
How to generate trace file:
We provided a simple trace file (/bin/ls) to help your program. If you want to generate more traces, you need to execute the following command line.
../../../pin -t obj-intel64/sim.so -writetrace 1 -printinst 0 -- /a.out
Useful knob variables
KNOB_TRACE_NAME: set the output trace file name
KNOB_WRITE_TRACE: (1): write trace while executing the binary
You should not set 1 for both KNOB_WRITE_TRACE and KNOB_READ_TRACE. Only one of them has to be 1.
KNOB_PRINT_INST: print out debug message while generating traces.
Before Submission
Before you submit, you should check whether your assignment runs until it finishes.
../../../pin -t obj-intel64/sim.so -readtrace 1 -print_pipe_freq 1 -- /bin/ls
IPC should be greater than 0.
Before you submit, you must run your code at killerbee[1-5].cc.gatech.edu
Submission Guide
cd pin-2.6-27887-gcc.4.0.0-ia32_intel64-linux/sources/tools
cd lab1
make clean
cd ..
tar cvf lab1.tar lab1/*.h lab1/*.cpp
gzip lab1.tar
Please do not include any trace files
You submit lab1.tar.gz file at T-square.
Grading
We will use the output file from the print_stats function and output
of print_pipeline. We might use output of the print_heartbeat
function.
If you do not follow the submission file name, or your code does not run at killerbee, there will be a penalty.
Note: The code itself explains more information. Please look at the code and the description together.