| Due September 21 | CS 7450 - Information Visualization | Fall 2015 |
We understand that some students in class do not have a programming background. Hence, we will provide tutorials to assist on the assignment both in class and outside class.
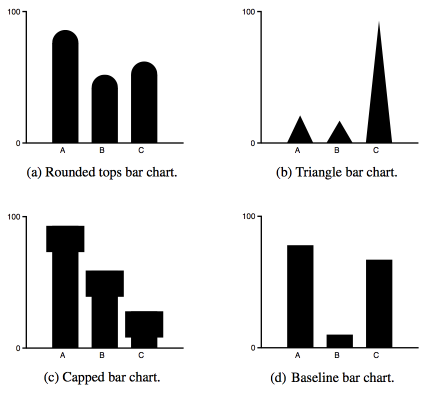
You are going to write a Processing sketch capable of visually representing product sales data. The data consists of a list of sales figures of coffee types over time. This is not a large data set, but you still must think carefully about how one might aggregate this data. You are going to write a sketch that generates bar charts of the coffee sales over time, similar to the chart in the image below. In addition to the standard rendering strategy for bar charts (item d), you will also be implementing three other types of embellished bar charts.
Your system must support the following capabilities:
Most of the information required for this assignment can be
found in the
Processing reference. The interactive components (e.g.,
buttons, dropdown menus) will be made much easier if you employ an
existing library such
as controlP5,
though you cannot use such a library to render your chart. Please
provide all of your code in a single sketch directory named
"barVis" that you submit. This directory must include a file named
"barVis.pde" with setup() and draw()
functions so that we can run it.
Grading: The assignment will be graded out of a total of 10 points. To receive the full 10 points, you need to get all of the capabilities above working. If you change your program so that instead of the four charts being shown together, the user can make an interactive selection as to which will be shown, then this will earn 2 extra credit points as a bonus.
Submitting your assignment: We will use t-square to submit the code for the assignment. It is due at the start of class on the due date. More details about the submission procedure will be given in class.
Coffee sales data (csv format)
The csv file contains data items with eight attributes in
comma-separated-value format. The data file has column headers, so the
data should be relatively self explanatory. Do not treat date as an
ordinal attribute for the height of the bars. You may, however, use
year or month as categorical attributes for the bar identity (this is
not a requirement).