Project 1: Image Filtering and Hybrid Images
For this project, I implemented a version of the Matlab imfilter() function. imfilter() is used for applying filters(in the form of filter matrices) to images. My function, called my_imfilter(), accepts any rectangular image array and an odd x odd filter matrix. This is how my_imfilter() works:
- Take an input image and filter to be applied.
- Apply padding to the image according to the filter size. The default padding method is to create border pixels with value 0.
- Create an image that has pixels corresponding to each the weighted sum of each pixel and its neighbors in the original image. The weights are decided by the filter function.
- Return this image.
Hybrid Images
Hybrid images are static images that change in interpretation as a function of the viewing distance. The basic idea is that high frequency tends to dominate perception when it is available, but, at a distance, only the low frequency (smooth) part of the signal can be seen. By blending the high frequency portion of one image with the low-frequency portion of another, you get a hybrid image that leads to different interpretations at different distances.[1]
Here, hybrid images are created according to the following steps:
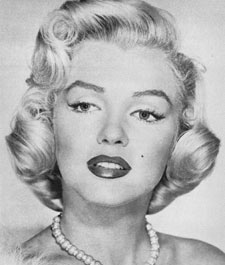
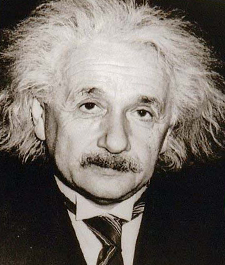
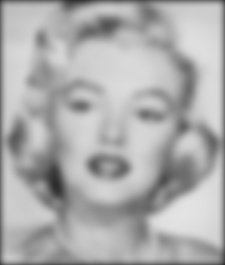
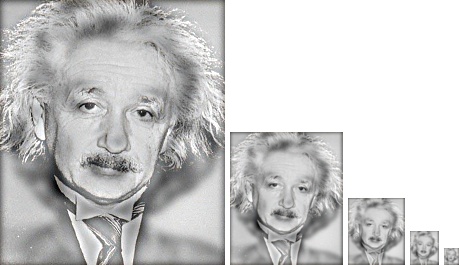
Take two images, in this example, we take Marilyn Monroe and Albert Einstein.
Create a Gaussian filter with a specified standard deviation. This standard deviation represents the cutoff frequency.
Create a low frequency version of the first image (Marilyn) by applying the Gaussian filter and a high frequency version of the second image(Einstein) by subtracting the filtered image from the original image. The filters are applied using my_imfilter()
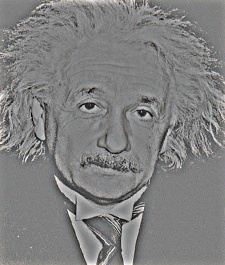
The standard deviation used in this case is 4. Also note that the einstein image displayed here is brightened to display the high frequency features more prominently.
Superimpose the above images.
-
Dog Cat: https://www.wolframcloud.com/objects/e249c090-8d6f-464f-a8e6-27f9e4ce3b8b
-
Bikes: https://www.wolframcloud.com/objects/611e796e-4627-4ac1-bc0b-3adcd3d3ee1a
-
Submarine Fish: https://www.wolframcloud.com/objects/06efd97c-47d6-493b-9032-7b09fc98d69c
-
Marilyn Einstein: https://www.wolframcloud.com/objects/6b269bf8-394c-48c1-8cf7-c446c01674fe
- Plane Bird: https://www.wolframcloud.com/objects/6ca262ba-37ce-4ad7-8b87-ba7ce196b03a
Results
Go to this Page to view the hybrid images I created using the above process.
Go to this Directory to view all the hybrid images organized into folders by name. The number in the image files denotes the standard deviation used.
I also made interactive hybrid images in Mathematica. Instead of implementing a filter function from scratch and then using Gaussian filters, I used the inbuilt Blur function that essentially does the same thing. You can change the amount of blur (which represents the cutoff frequency) by changing the value of the sliders. The code is:
hybridImage[x_]:=Manipulate[ImageAdd[Blur[x[[1]],b],ImageSubtract[x[[2]],Blur[x[[2]],b]]],{{b,20,"Blur"},0,100,5, Appearance -> "Labeled"}]
To download the notebook, click here (right click and select save link as): ShahPrj1.nb
To see a static pdf (including results) of the notebook, click here: ShahPrj1.pdf
You can also visit the webpage of the notebook, click here: ShahPrj1.html. This might not work without plug ins. To play with individual hybrid images from your browser without any plugins, click on the following links (wait for a couple of seconds after it loads. It reacts a bit slowly):
Observations
I played around with the cut off frequency and the order of images (which image should be smoothed and which one should be sharpened). I realized that the image with finer features should be used as the high frequency image and the image with relatively less detailed fetures should be used as the low frequency image. The high frequency image loses some color information while the low frequency image loses some detail. Also, the presence and absence of color can affect the quality of the hybrid image.
Future experiments can include finding more samples and playing with the padding method.