Project 2: Local Feature Matching
For this project, I more or less followed the base requirements and didn't really do much in terms of pursuing extra credit. For this writeup, I will explain the basics in terms of how each of the functions were implemented and what they do. The following are the methods that had to be implemented and are listed in the order they are discussed
- get_interest_points.m
- get_features.m
- match_features.m
get_interest_points.m
For this method, the idea is we're trying to implement a Harris corner detector to determine a reasonable set of interest points to analyze and generate feature descriptors for. By using the Sobel filter (this is the default for imgradientxy) and applying a gaussian filter on the split up x and y attributes of the image, we can apply the Harris cornerness function and use a threshold to determine which are the more relevant points we want to pass on as the interest points of the image. Figuring out a good sigma value and alpha value in the equations for the Gaussian filter and Harris cornerness function, respectively, is key to finding the right balance for selecting interest points. I found good success with an alpha of 0.07 and a sigma of 1.8.
get_features.m
With this method, we consider each of the individual interest points. For each interest point, we more or less center it in a 16x16 area (with 16 being the feature width) and take the gradient of the area to look for angles and magnitudes. Within this 16x16 area, we look at 4x4 "cells" and generate a histogram that provides 8 different bins: -135 degrees, -90 degrees, -45 degrees, 0 degrees, 45 degrees, 90 degrees, 135 degrees: 180 degrees. We sum up the magnitudes that fit into each of these separate bins and essentially append each of the sums to generate a feature descriptor. This is ultimately appended to the overall list of feature descriptors that we return at the end of the method (8 angles for each of the 16 4x4 cells gives us a size of 128 per feature descriptor).
match_features.m
This method is more or less a confidence check in terms of checking whether a feature in one image matches a feature in the other. We consider the euclidean distance between each of the features being paired together for the check and then sort them. Once we have the distances, we consider how wide the range is via a ratio test that involves comparing two given distances and finding the ratio between them; if the ratio fits within a certain threshold we are confident with, we consider them matched. If not, we consider them as different features. For this part, I found a threshold of 0.7 to be effective.
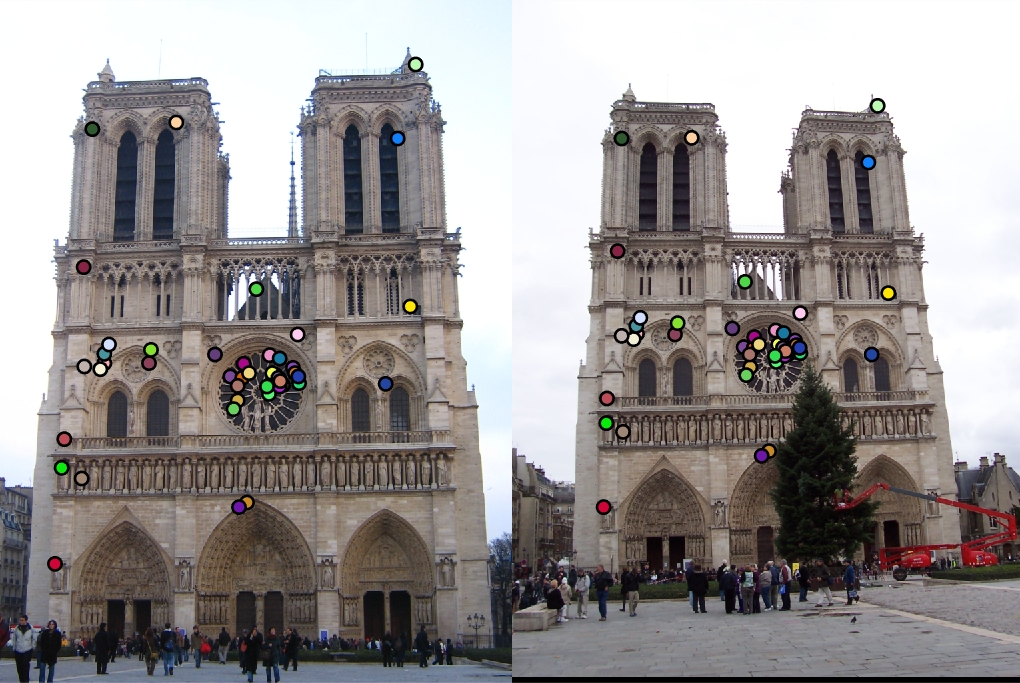
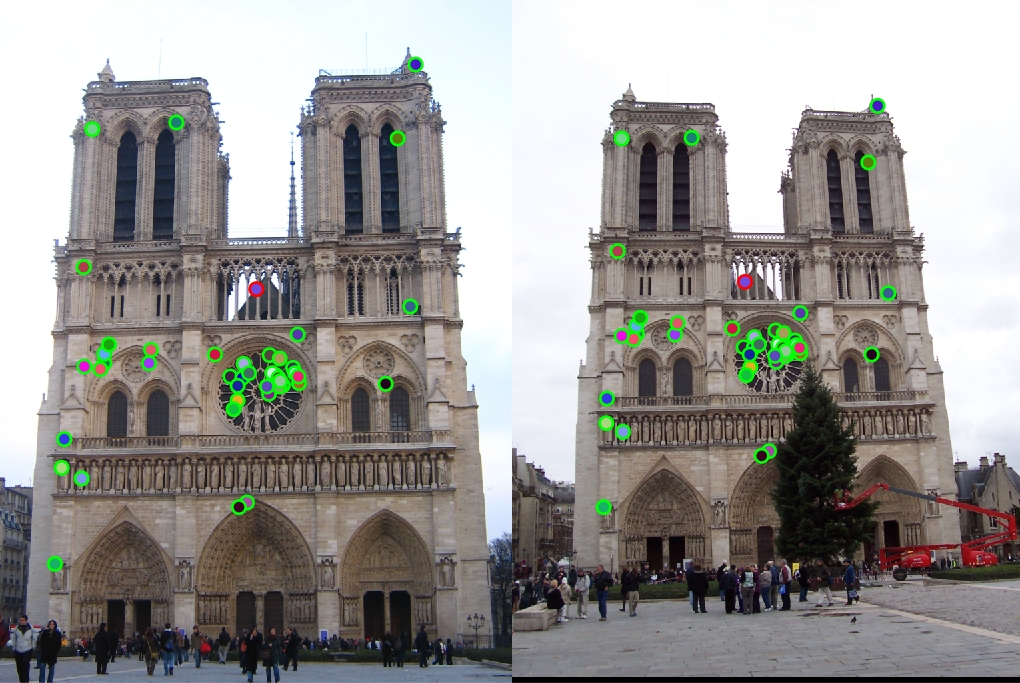
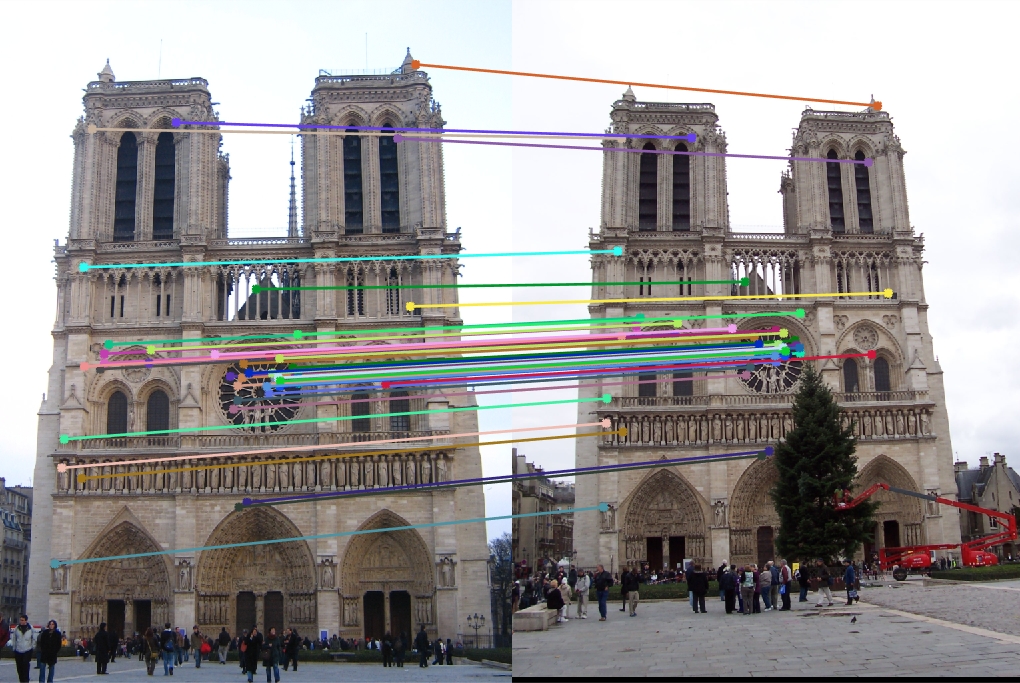
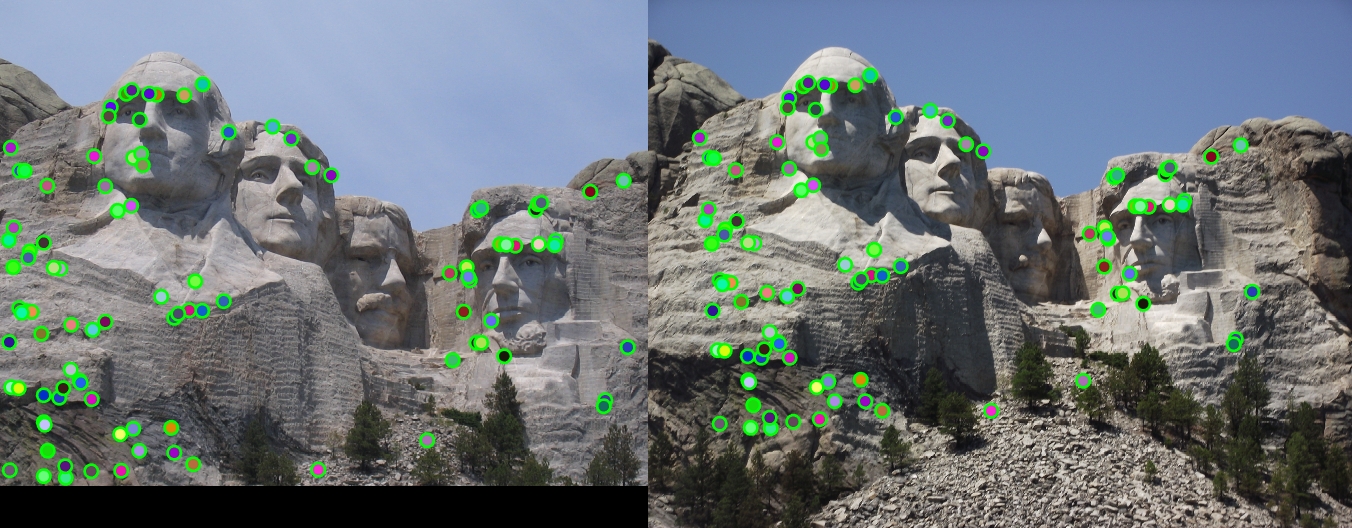
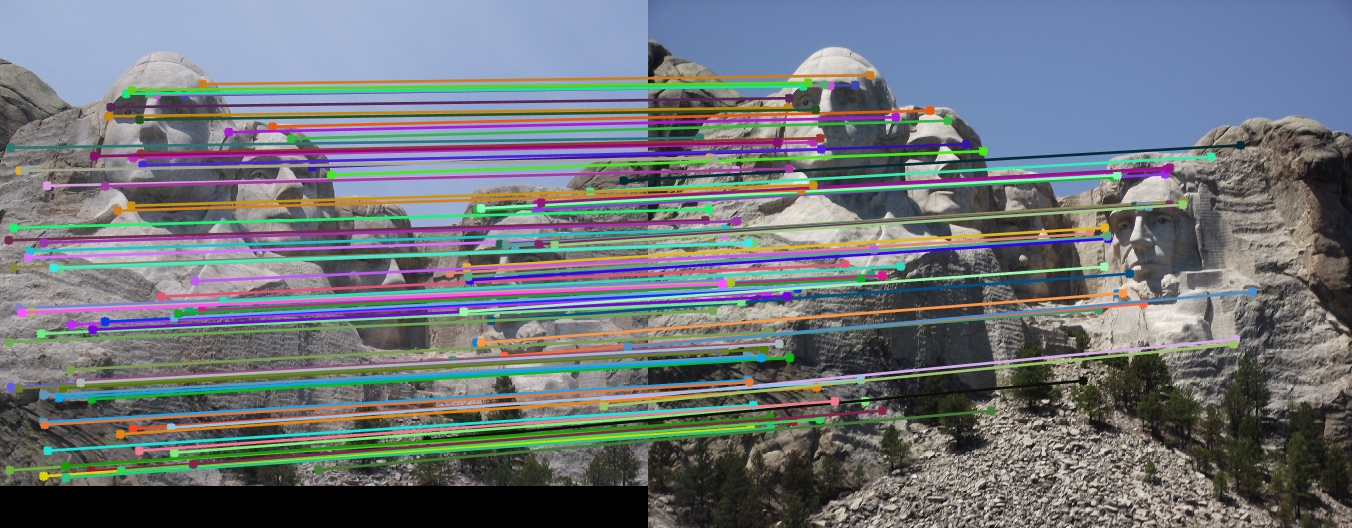
Feature Matching In Action
Below are some examples of feature matching in action. For each row, the first image shows the interest points found, the second image shows which images are considered matched (red circle means they don't match, green circle means they do), and the third image displays lines connecting any two features that are considered to be a match to show the connection between the two. When you run the code, you'll see that I got 98% on NotreDame and 100% accuracy on Mount Rushmore.
|

|