Project 2: Local Feature Matching
For project 2, I worked to implement Harris Corner Detection, Sift Feature Matching, and the Nearest Neighbor Distance Ratio test to match collected features. The basic algorithm ran in the following fashion.
- Find pertinent interest points using the Harris Corner Detection. We then want to supress the points to return the maximum value in a given region.
- Create feature elements around the interest points using the SIFT histogram design. Features are composite histograms of smaller, internal cells. These histograms are then stored in a features array.
- Two sets of features are passed into the match_features function, which compares the points and used Euclidean distances to identify corresponding points from the two sets of features. The NNDR is then calculated to cull that list to a thresholded group of most accurate matches.
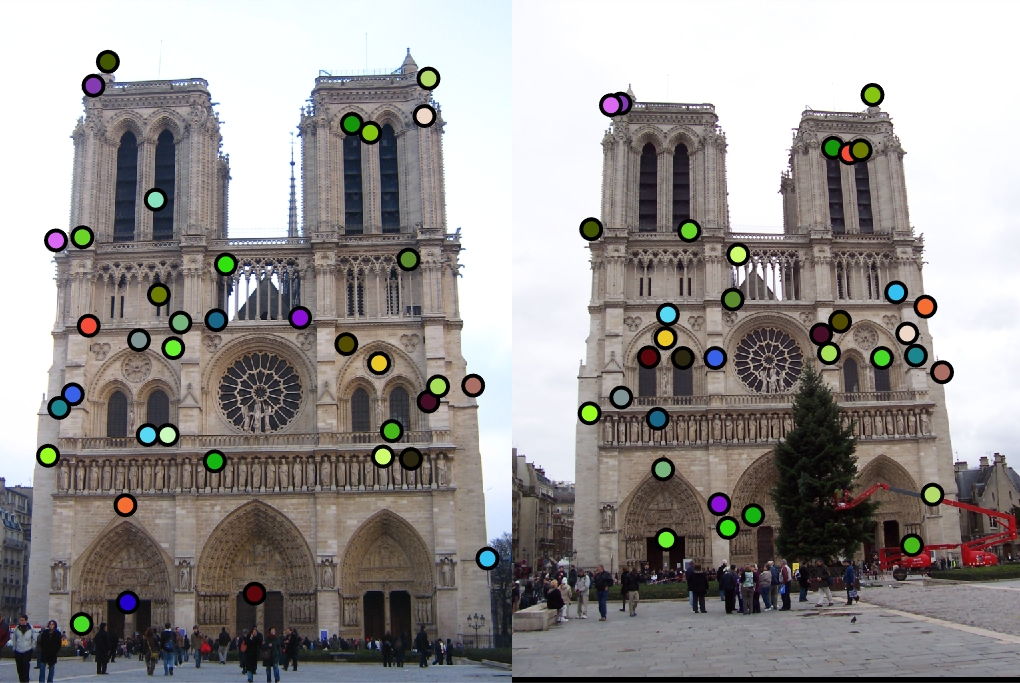
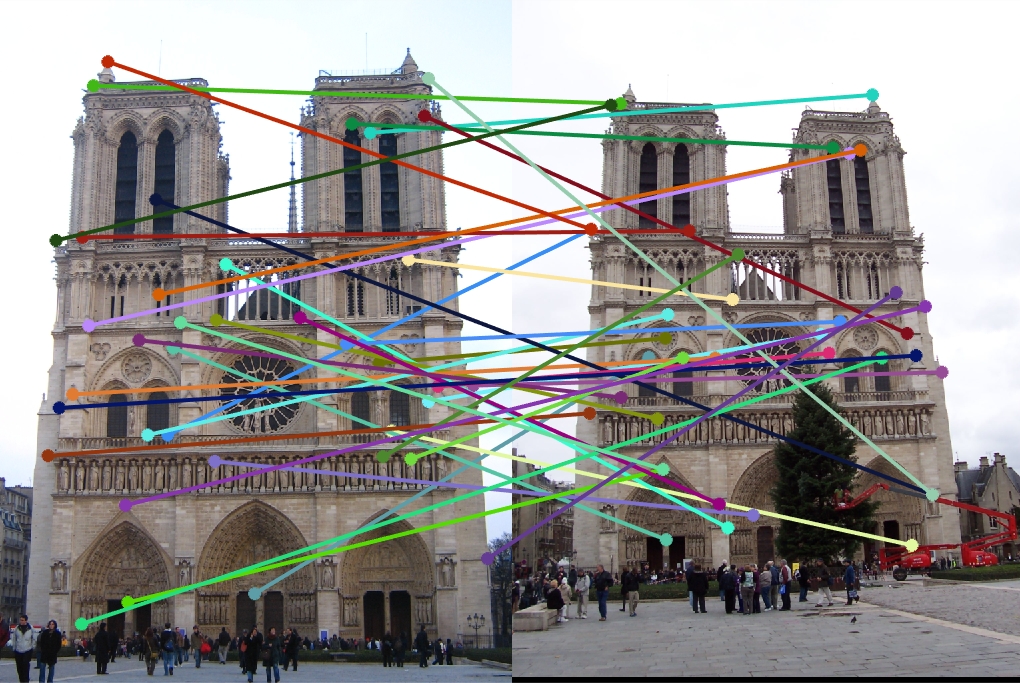
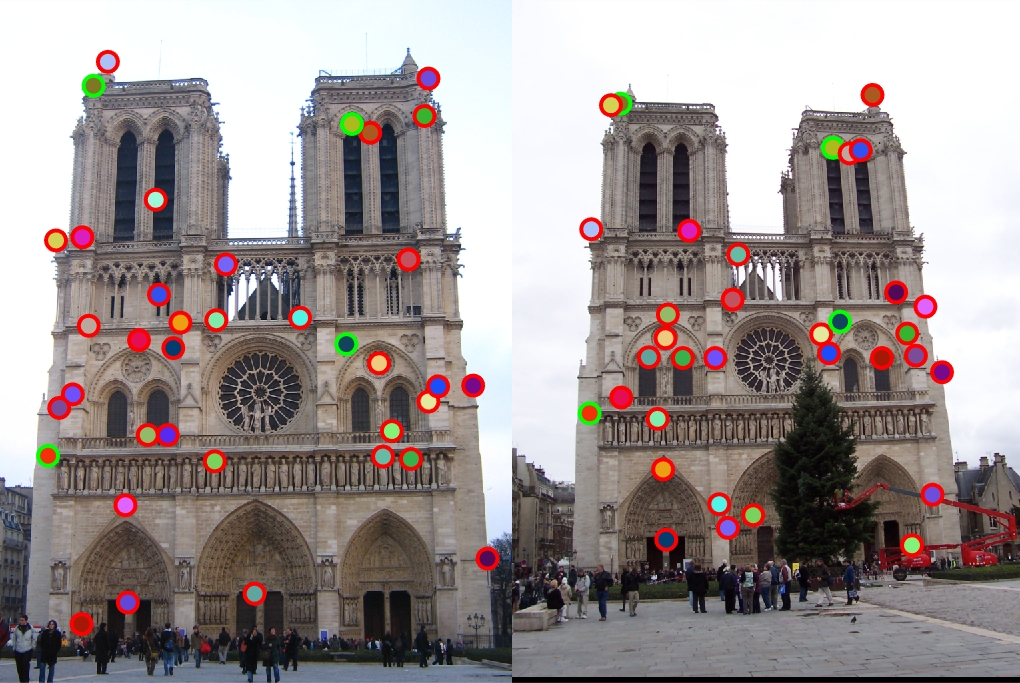
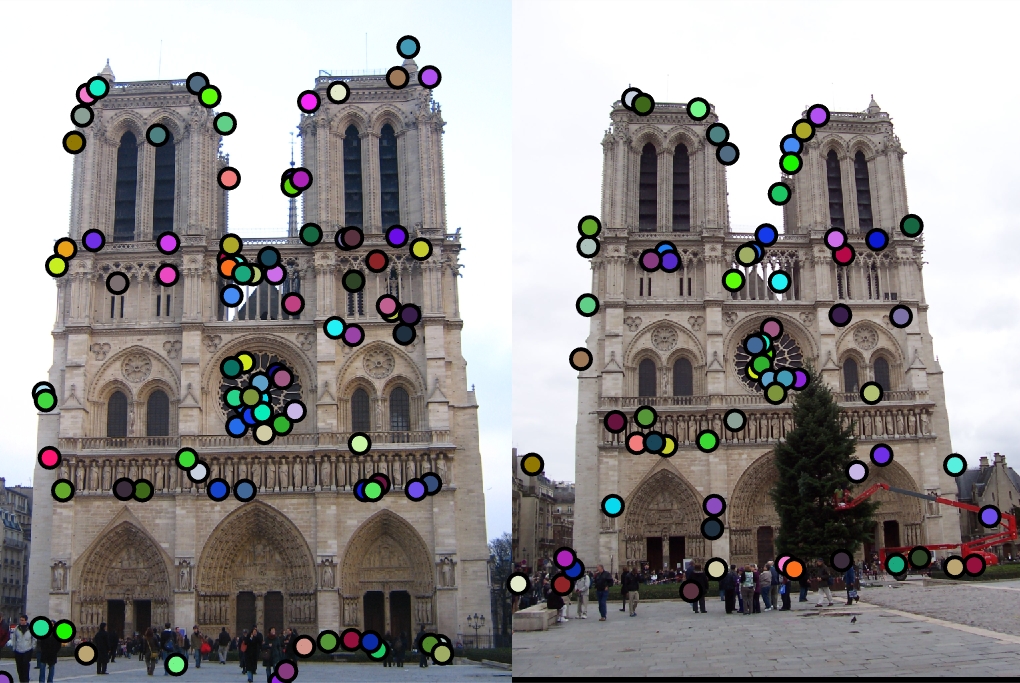
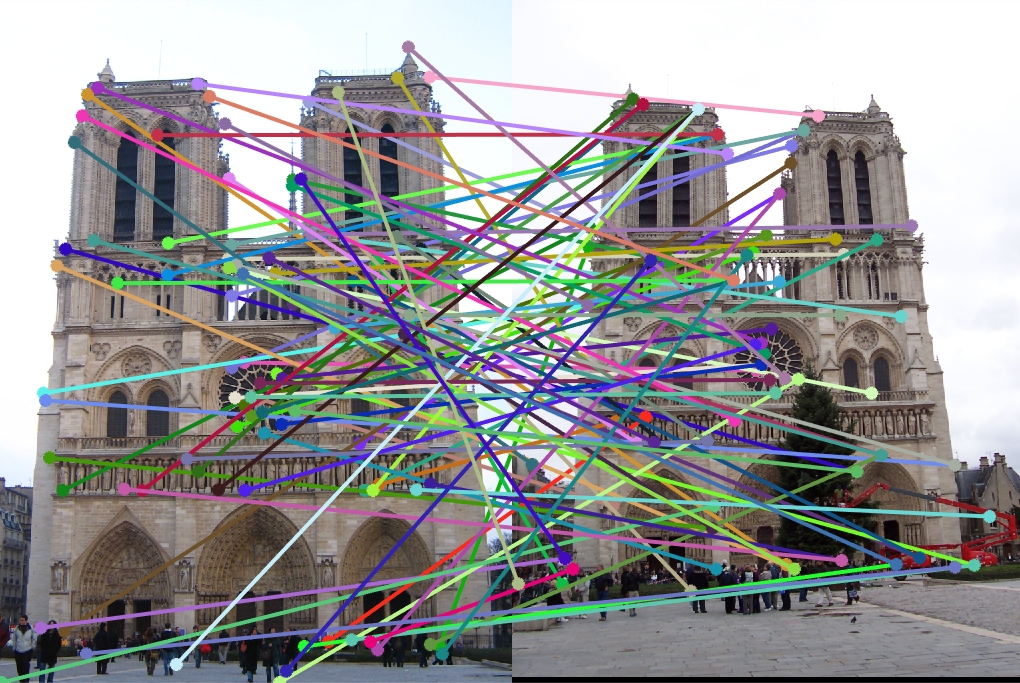
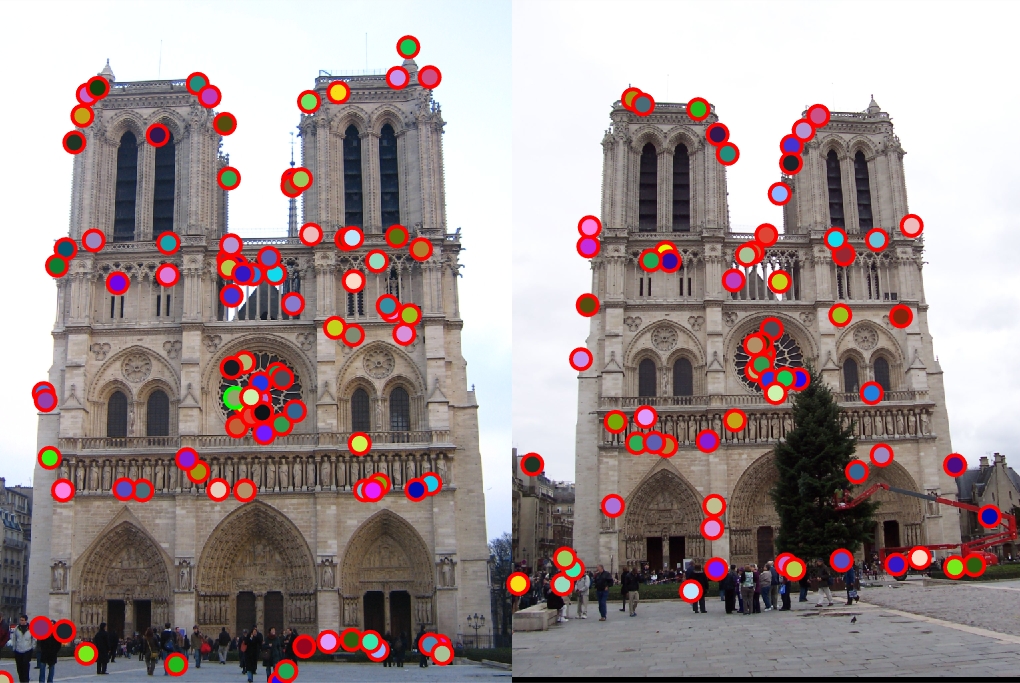
Results
However, despite my attempted implementation, my feature detection project did not return a substantial accuracy to merit full credit. While using cheat_interest_points, my accuracy was as high a 27 percent, but then dropped to around 2% when get_interest_points was added. This leads me to believe that a substantial bug was present in either my get_features function or get_interest_points function.
SIFT Feature Creation
Below is the part of my get_features function that I believe is faulty, and I intend to still try and understand where my interpretation and implementation failed.
%example code
    while j <= feature_width && k <= feature_width
        cell_Matrix = feature_Matrix(j:j + (cell_width - 1), ...
            k:k + (cell_width - 1));
        %Gmag, Gdir are both matrices
        [Gmag, Gdir] = imgradient(cell_Matrix);
        hValue = zeros(1, 8);
        for n = 1:cell_width
            for m = 1:cell_width
                curDirection = Gdir(n, m);
                curMagnitude = Gmag(n, m);

                if (-180 < curDirection <= -135)
                    hValue(1) = hValue(1) + curMagnitude;
                elseif (-135 < curDirection && curDirection <= -90)
                    hValue(2) = hValue(2) + curMagnitude;
                elseif (-90 < curDirection && curDirection <= -45)
                    hValue(3) = hValue(3) + curMagnitude;
                elseif (-45 < curDirection && curDirection <= 0)
                    hValue(4) = hValue(4) + curMagnitude;
                elseif (0 < curDirection && curDirection <= 45)
                    hValue(5) = hValue(5) + curMagnitude;
                elseif (45 < curDirection && curDirection <= 90)
                    hValue(6) = hValue(6) + curMagnitude;
                elseif (90 < curDirection && curDirection <= 135)
                    hValue(7) = hValue(7) + curMagnitude;
                elseif (135 < curDirection && curDirection <= 180)
                    hValue(8) = hValue(8) + curMagnitude;
                end

            end
        end

        hValue = hValue ./ feature_width;

        histogram_Matrix = [histogram_Matrix, hValue];
        %histSz = size(histogram_Matrix)
        if (j == feature_width + 4)
            k = k + 4;
            j = 1;
        else
            j = j + 4;
        end
    end
Results in a table
|
|
Above are the pictures from the Notre Dame test case. The top row is using cheat_interest_points and the bottom is using get_interest_points.