Project 2: Local Feature Matching
This algorithm was divided into 3 parts, matching features, getting features, and getting interest points.
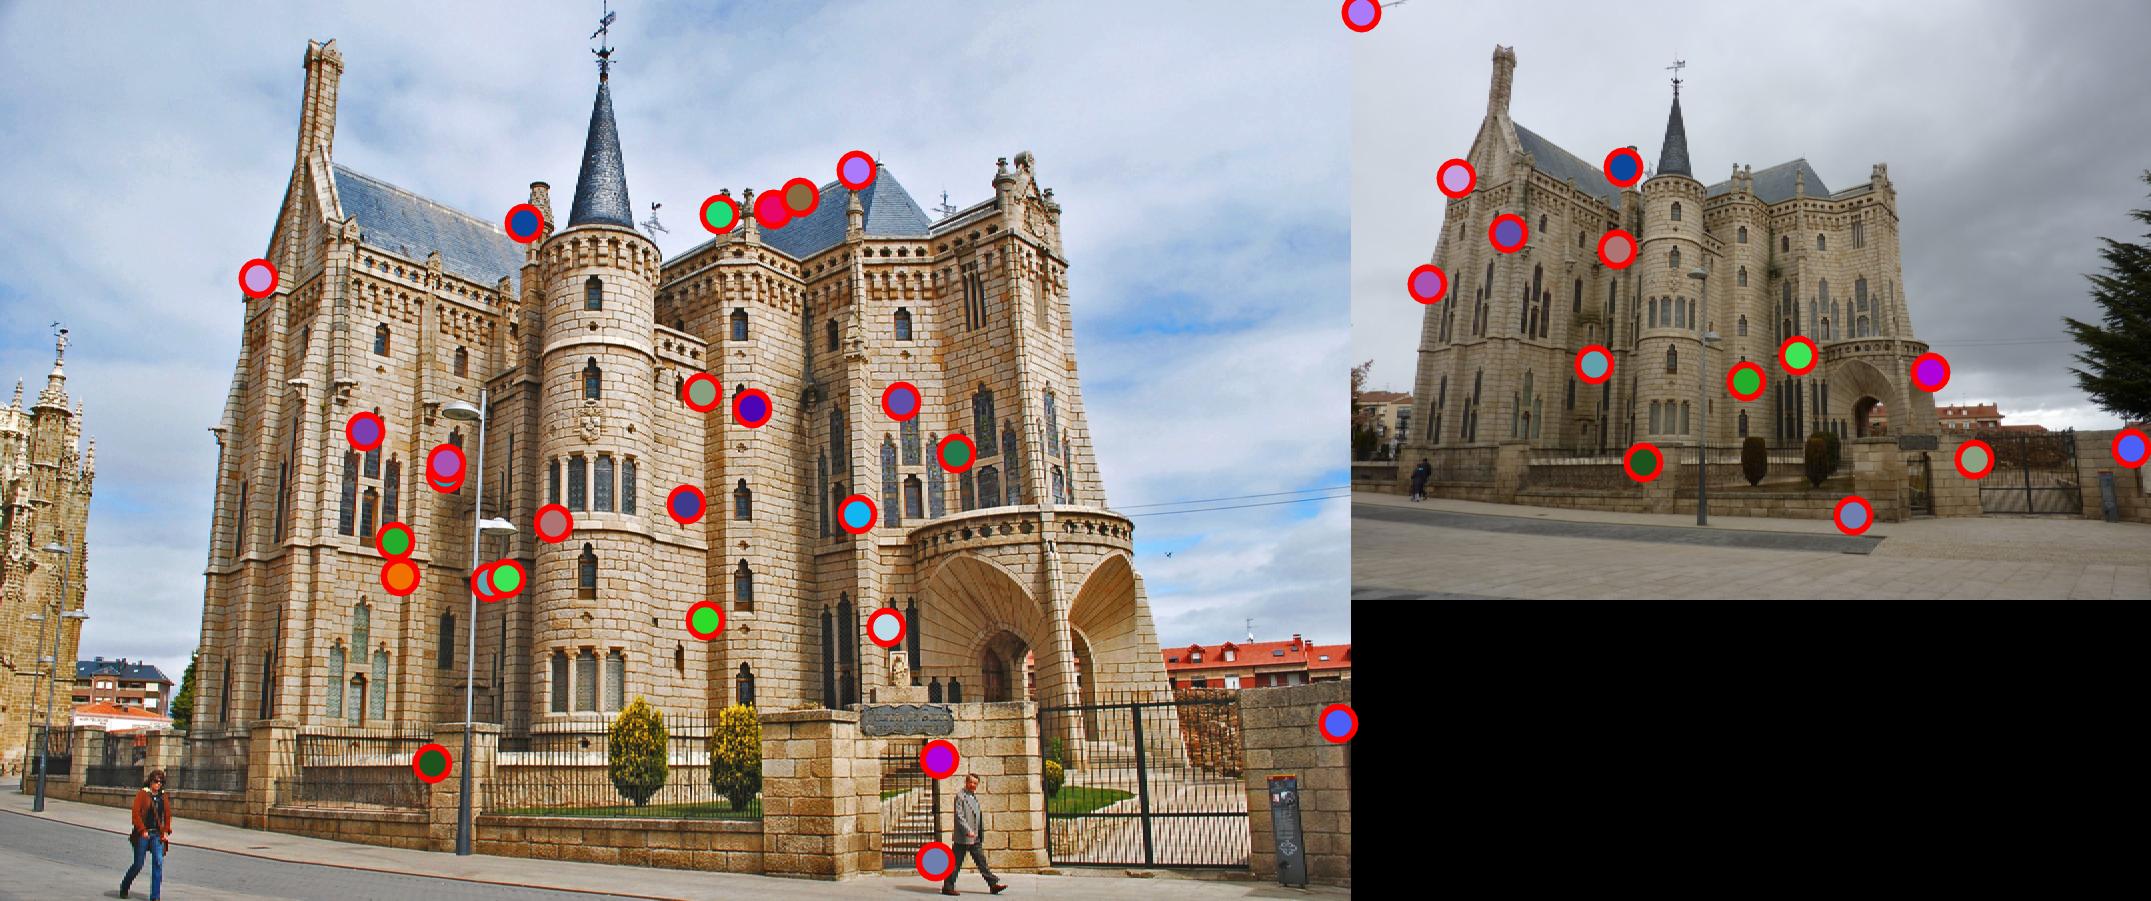
In get_interest_points I calculated the cornerness using the Harris Corner Detector algorithm. This algorithm allows for a change in alpha and a change in the Gaussian applied to the area. I found that increasing and decreasing the alpha greatly changed the output of my interest points. If my alpha was too high I either returned all negative interest points or interest points so small they were nearly impossible to work with. The Gaussian hsize and sigma were clear in that increasing them lead to 25 and 2 respectively while once past that point the accuracies began to decrease. I then determined the interest points by using a binary threshold on the cornerness and using that to find connected components. I iterated through the connected components and found their maximums as well their x and y values. I checked these values to ensure they were not too close to the edges of the image preventing me from indexing out of the image when creating a feature out of that point. I then added the x and y values to a matrix that would be passed on to get_features.
In get_features I looped over the interest points and created a feature from the area around the pixel. I then put a gradient over the feature and from that found the direction and the magnitude of the gradient at each pixel. I then divided the feature into cells that were a fourth of the size of the feature. In these cells I applied a Gaussian filter to the magnitudes in the cell and iterated over the pixels in the cell to create a histogram. For each cell I created a histogram of the Gaussian magnitudes of the gradient and added these magnitudes to eight bins that corresponded to the direction of the gradient at the location. I then added all of the cell histograms together to create a feature and passed the set of features obtained to match_features.
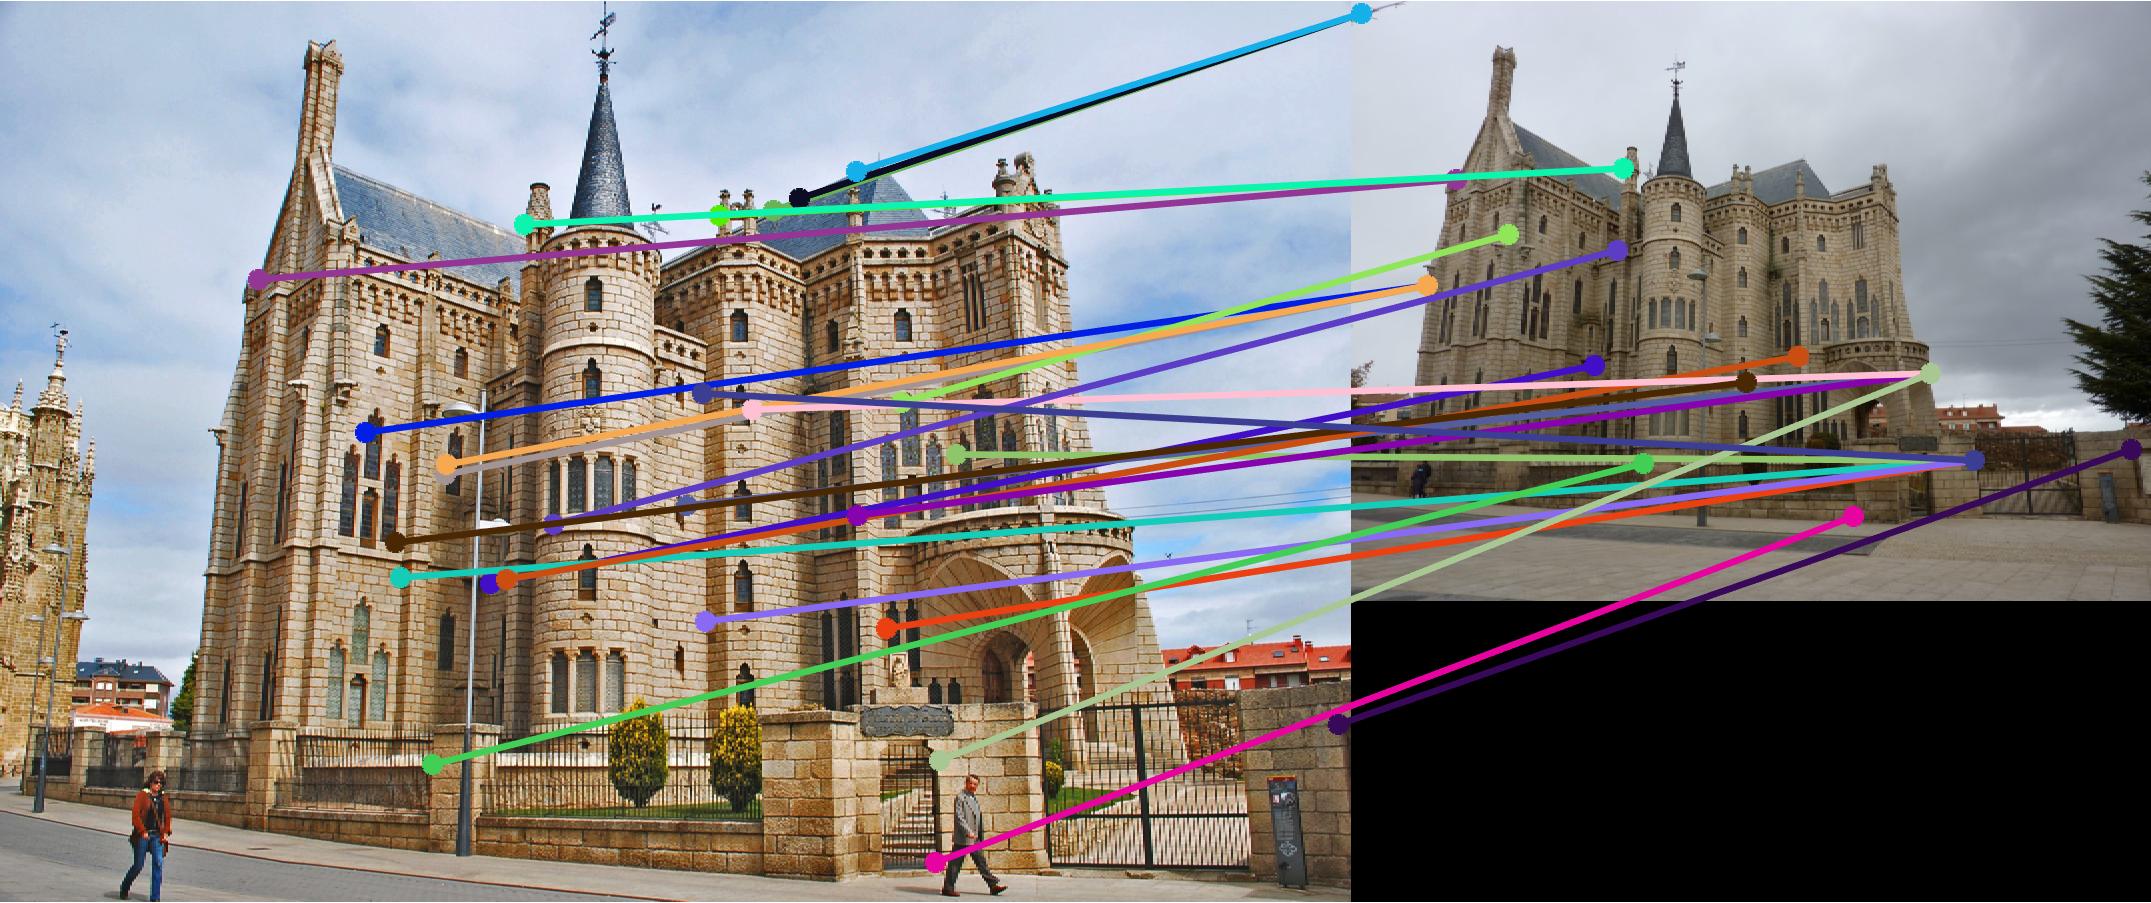
In match_features I iterated over all of the features from the first image and all of the features of the second image and compared each pair using the Euclidean distance between the two. I then saved the smallest and second smallest distances for each feature in image one and used those values to calculate a ratio. This ratio would correspond to the confidence of the match. I only appended matches that had a ratio of below .8. I found .8 through trial and error and found that lower numbers removed too many potential matches and higher numbers let in too many incorrect matches. The confidences and corresponding matches were then descendingly sorted. I truncated the matches and confidences so that only the 100 most confident matches were shown and evaluated.
Results in a table
| Correctness | Interest Points | Matching | Comments |

|

|

|
Notre Dame return a high accuracy of 91% with 100 interest points. |
|
|
|
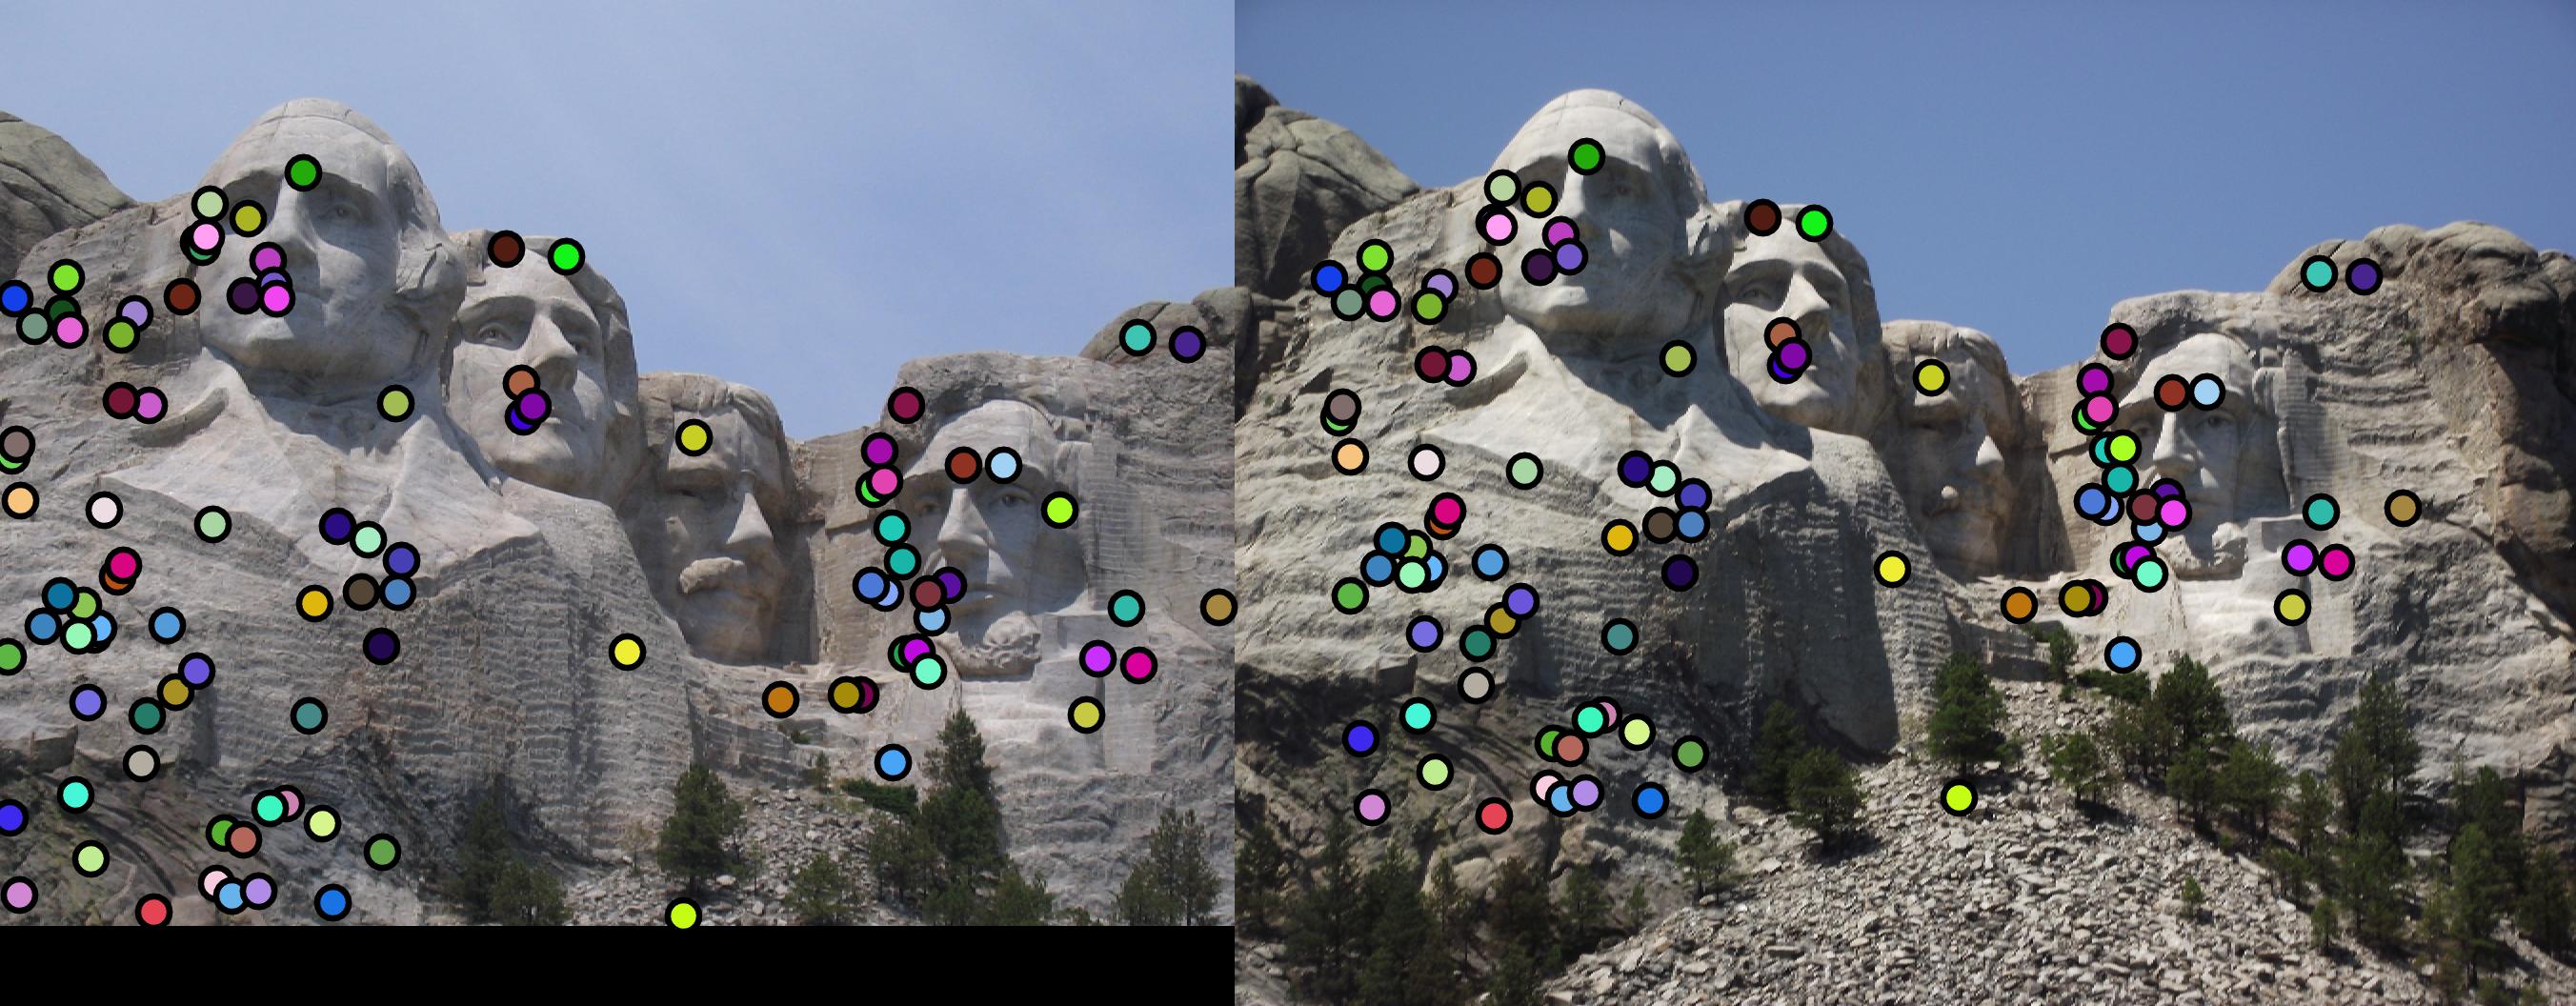
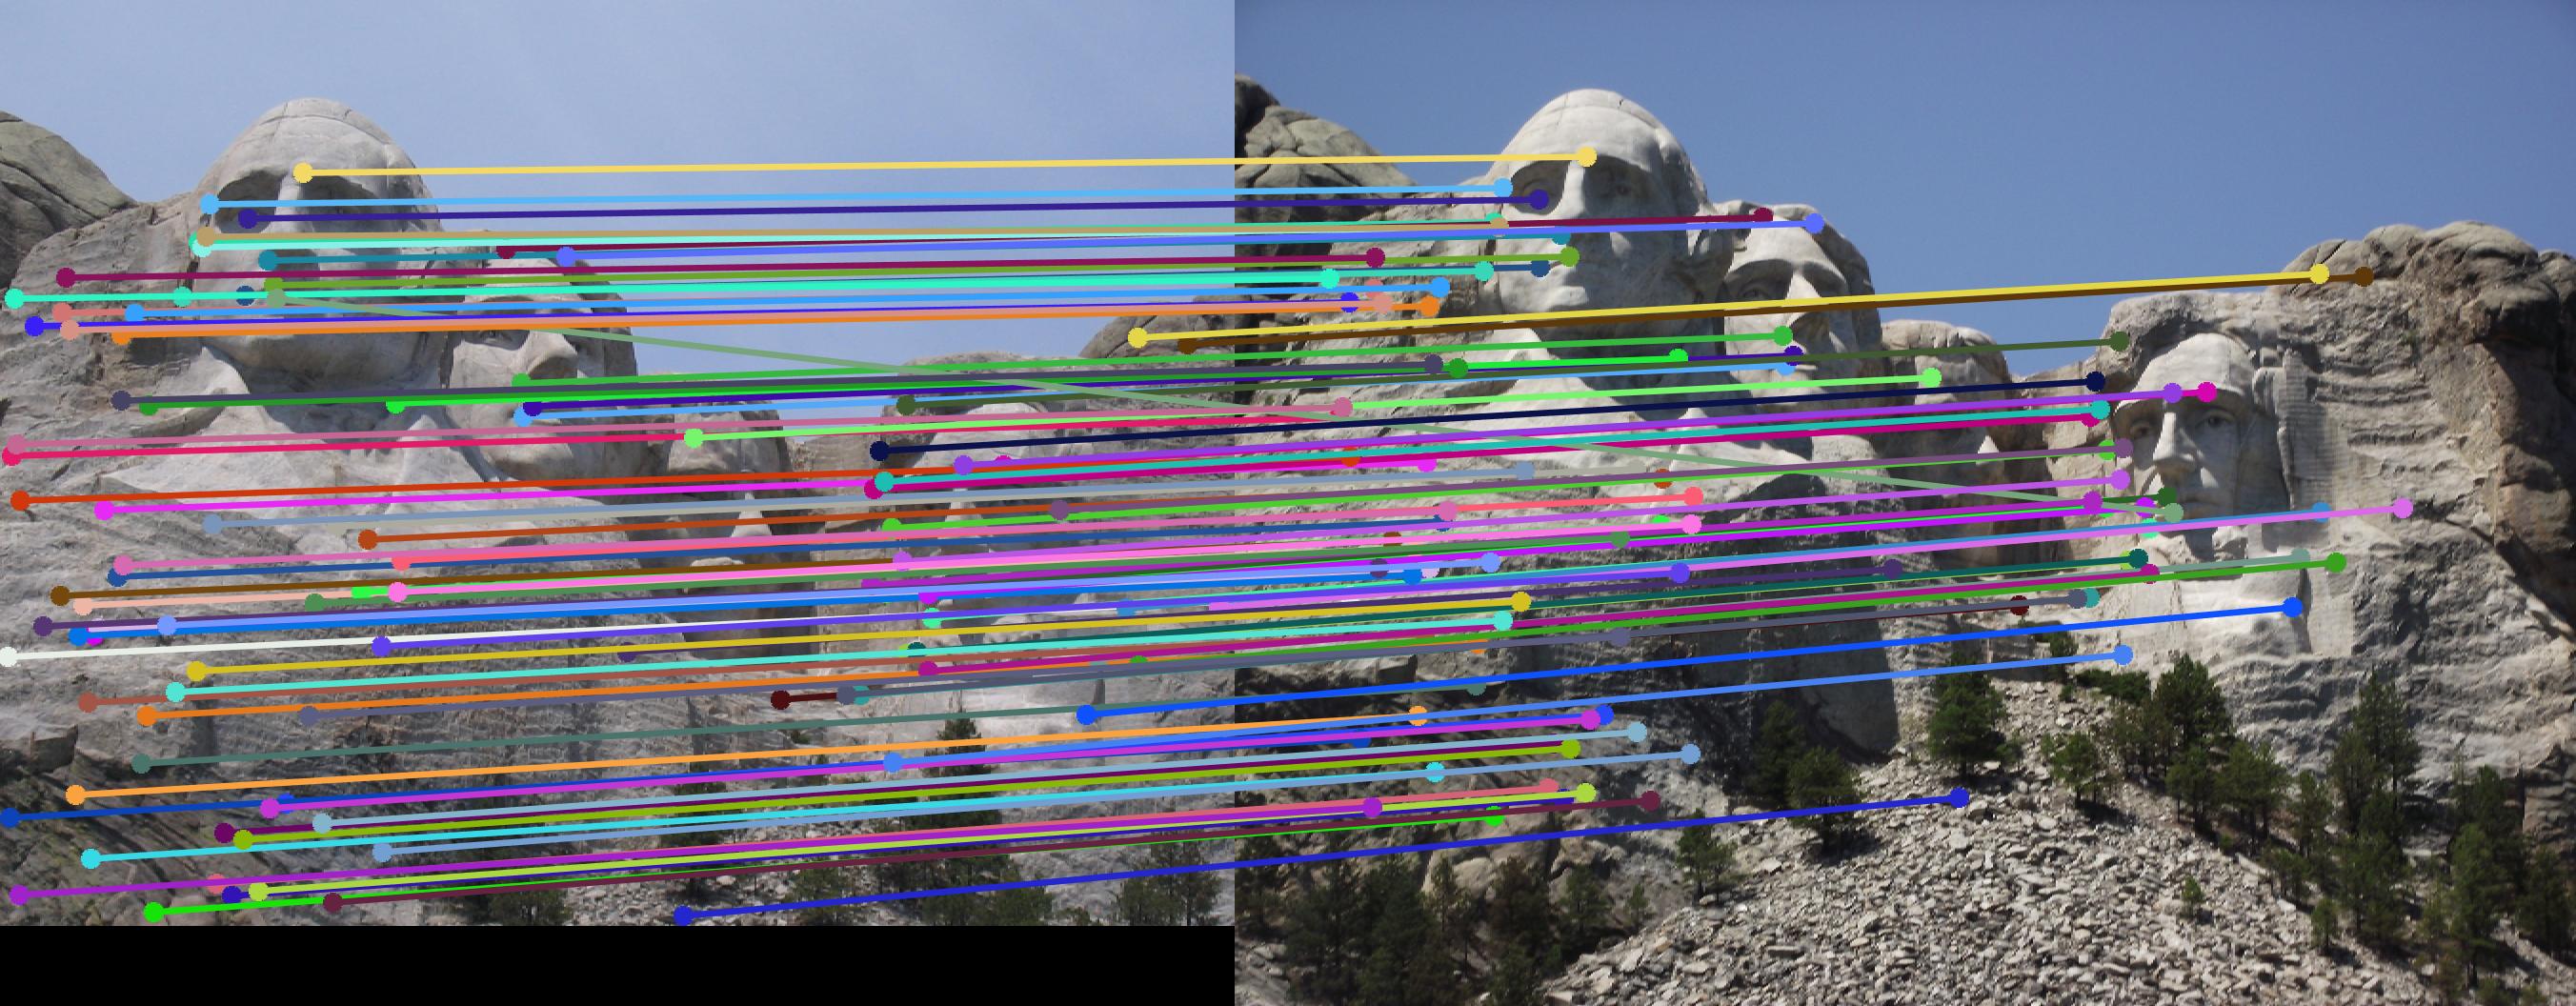
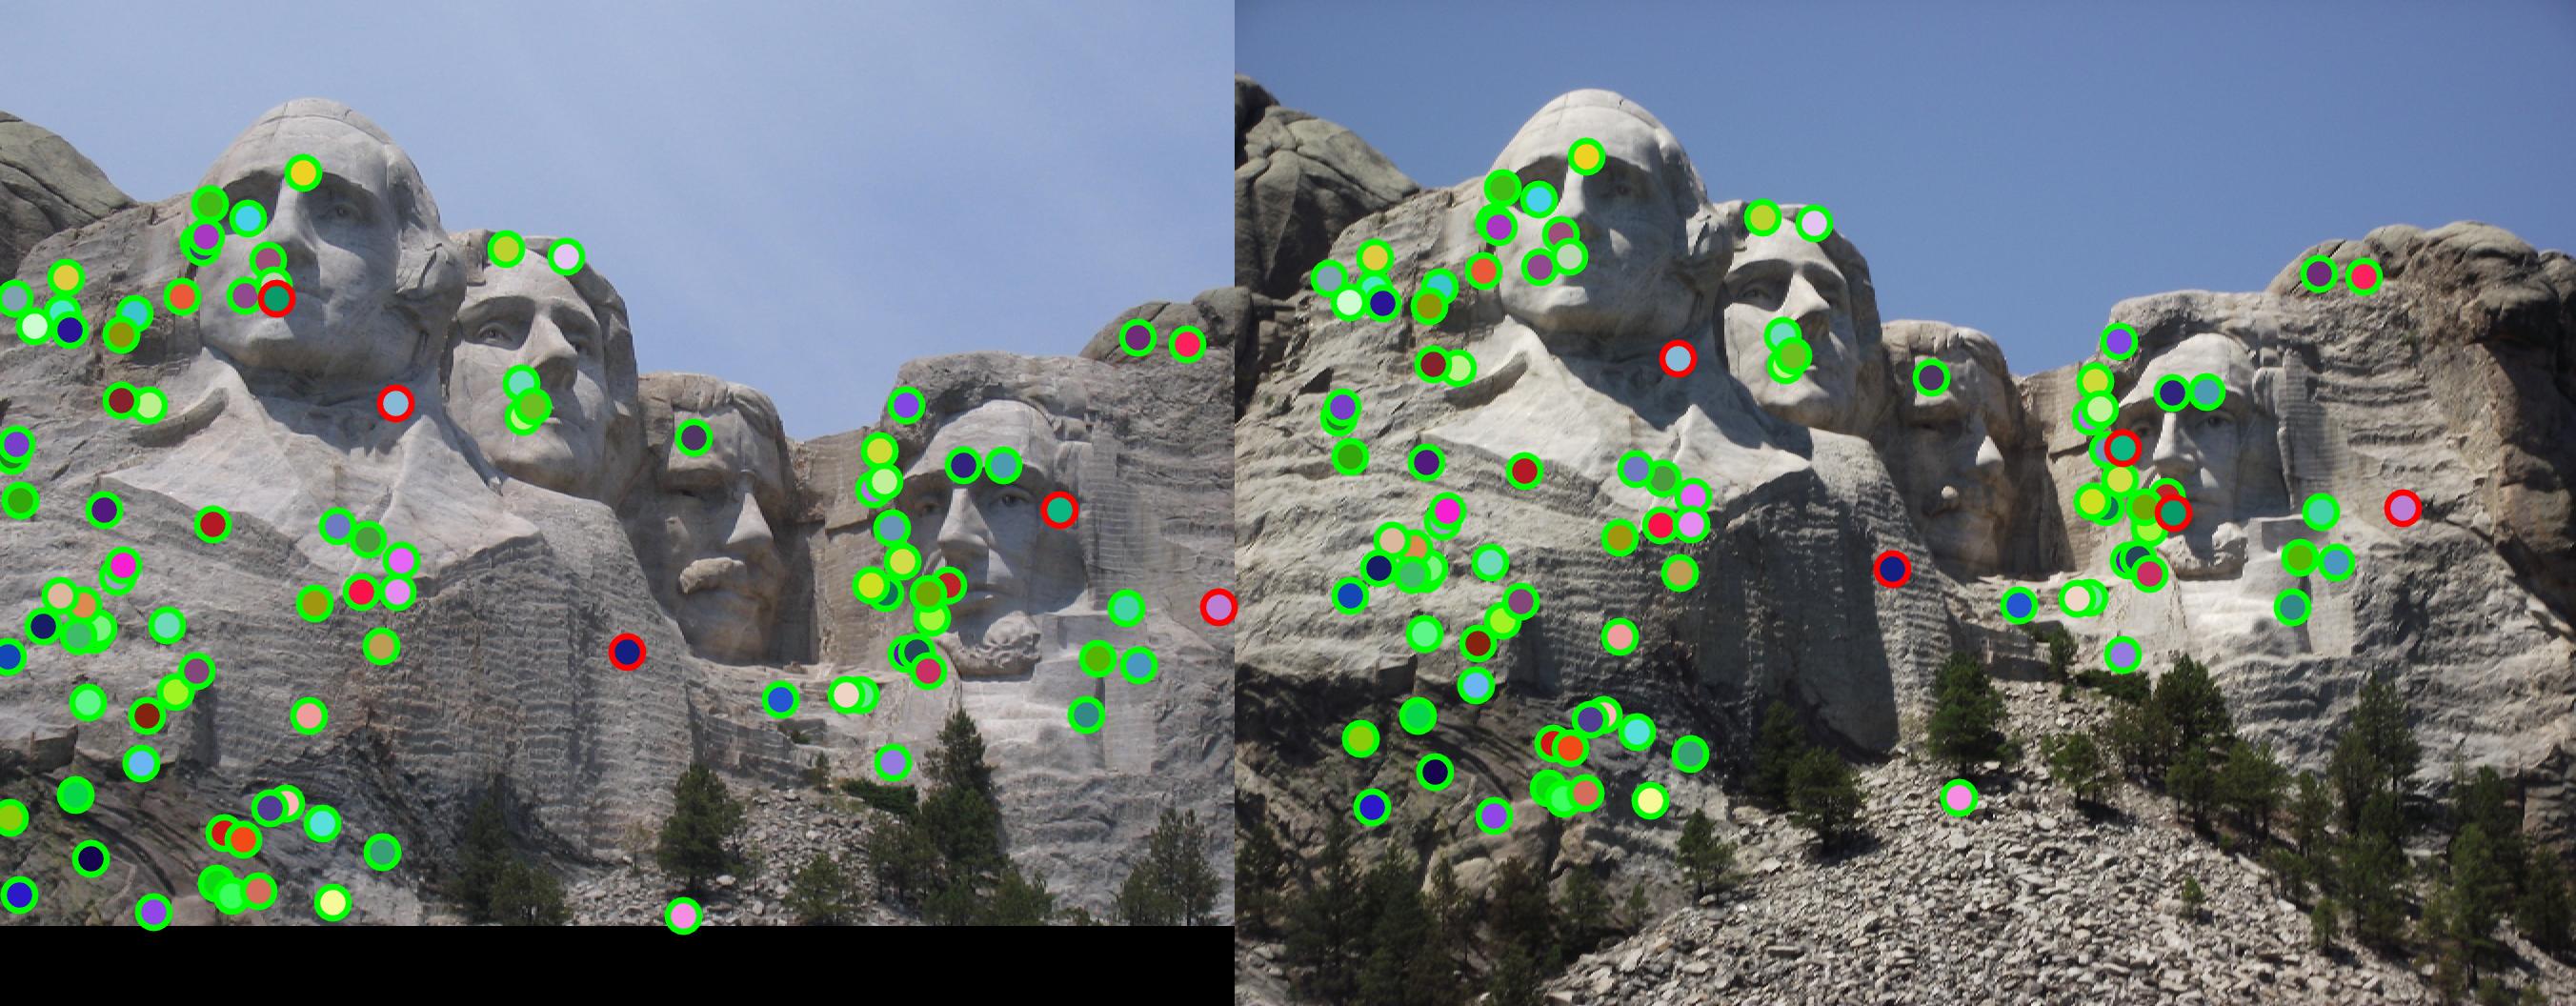
Mount Rushmore does well with 95% accuracy with 100 interest points. |
|
|
|
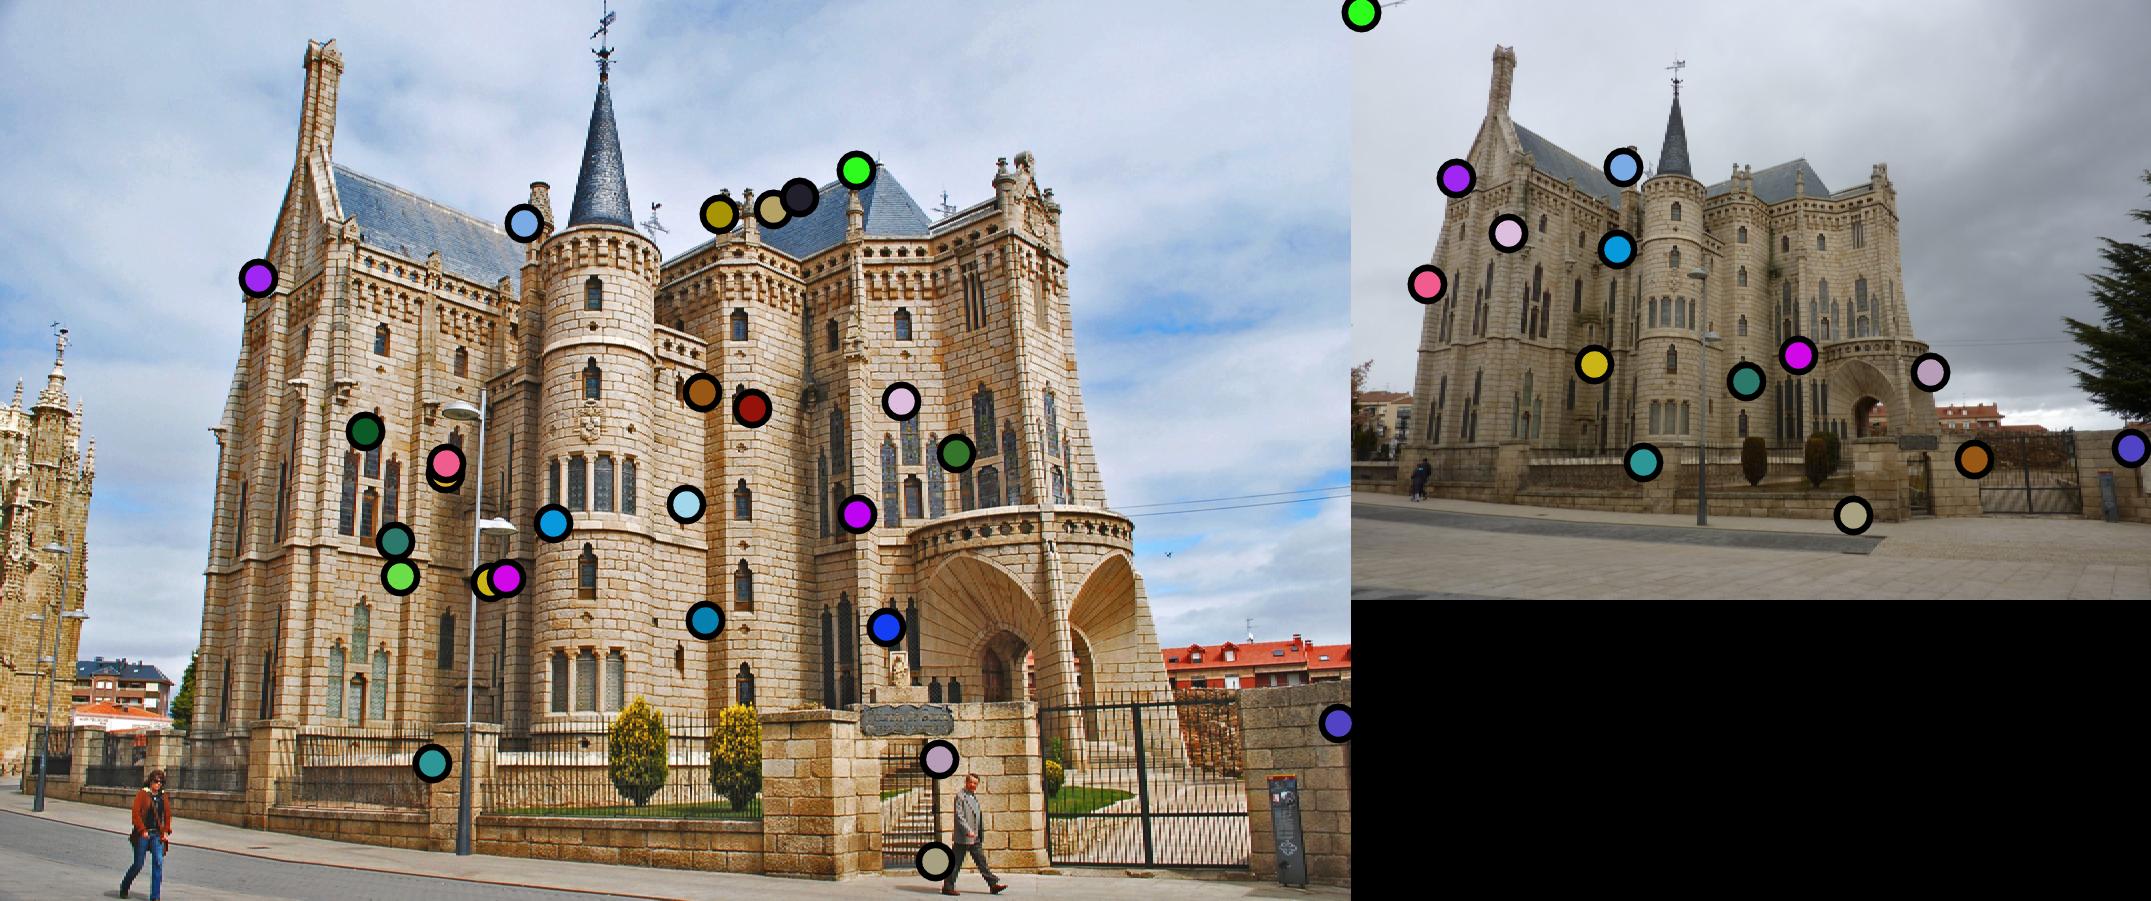
Episcopal Gaudi does poorly with 0 matches out of 26 interest points. |