Project 2: Local Feature Matching
The goal of this project is to create a local feature matching algorithm for 2 images. The algorithm follows a simplified version of the SIFT pipeline, which consists of the following 3 steps:
- Interest Point Detection
- Local Feature Description
- Feature Matching
Interest Point Detection
I smoothened the image with a gaussian filter to get rid of noise and calculate the x and y gradients on the image using the sobel filter. After, to find all the interesting points, I used the Harris Corner Detector algorithm with alpha = 0.04:
I thresholded the results to filter out the unimportant data and performed non-maximal suppression to get a better distribution of the points. I did this in two ways. The first way was to run a local non-maximal suppression (LNMS) by using a 3x3 sliding window. This eliminates all the non-maximal interesting points within the window. The other way, was to implement adaptive non-maximal suppression to get an even better distribution of points.
Adaptive Non-Maximal Suppression (ANMS)
ANMS is important for solving the problem of having too many interesting points in some region of the image that is denser than others. It evenly distributes the interesting points keeping only the strongest ones in a each region.
For the most part, ANMS was unable to increase the accuracy rate. This might be because the method tries to get a better distribution of interesting points but this may lead to eliminating some of the more important points in denser areas which contains better information than the weak ones in less dense areas the method tries to preserve. The same explanation can be used for explaining why there is a decrease in accurace as max_pts is being decreased.
Local Feature Descriptor
Once the interesting points have been detected, we need to construct a local feature around it. I created this descriptor using 128 dimensional vectors for each interest point. I take a 16x16 window around each point, calculate the gradient direction and magnitude in 8 buckets for each 4x4 block of the window (16 blocks per window) and concatenate this information together in a 16x8 = 128 dimensional vector.
Feature Matching
I used the ratio test to be able to match features. It compares every feature of the first image to every feature in the second image by calculating the distances between each feature. The raio of the lowest distance (best match) and the second-lowest distance (second-best match) is taken and thresholded with 0.75.
Results (Best 100 matches):
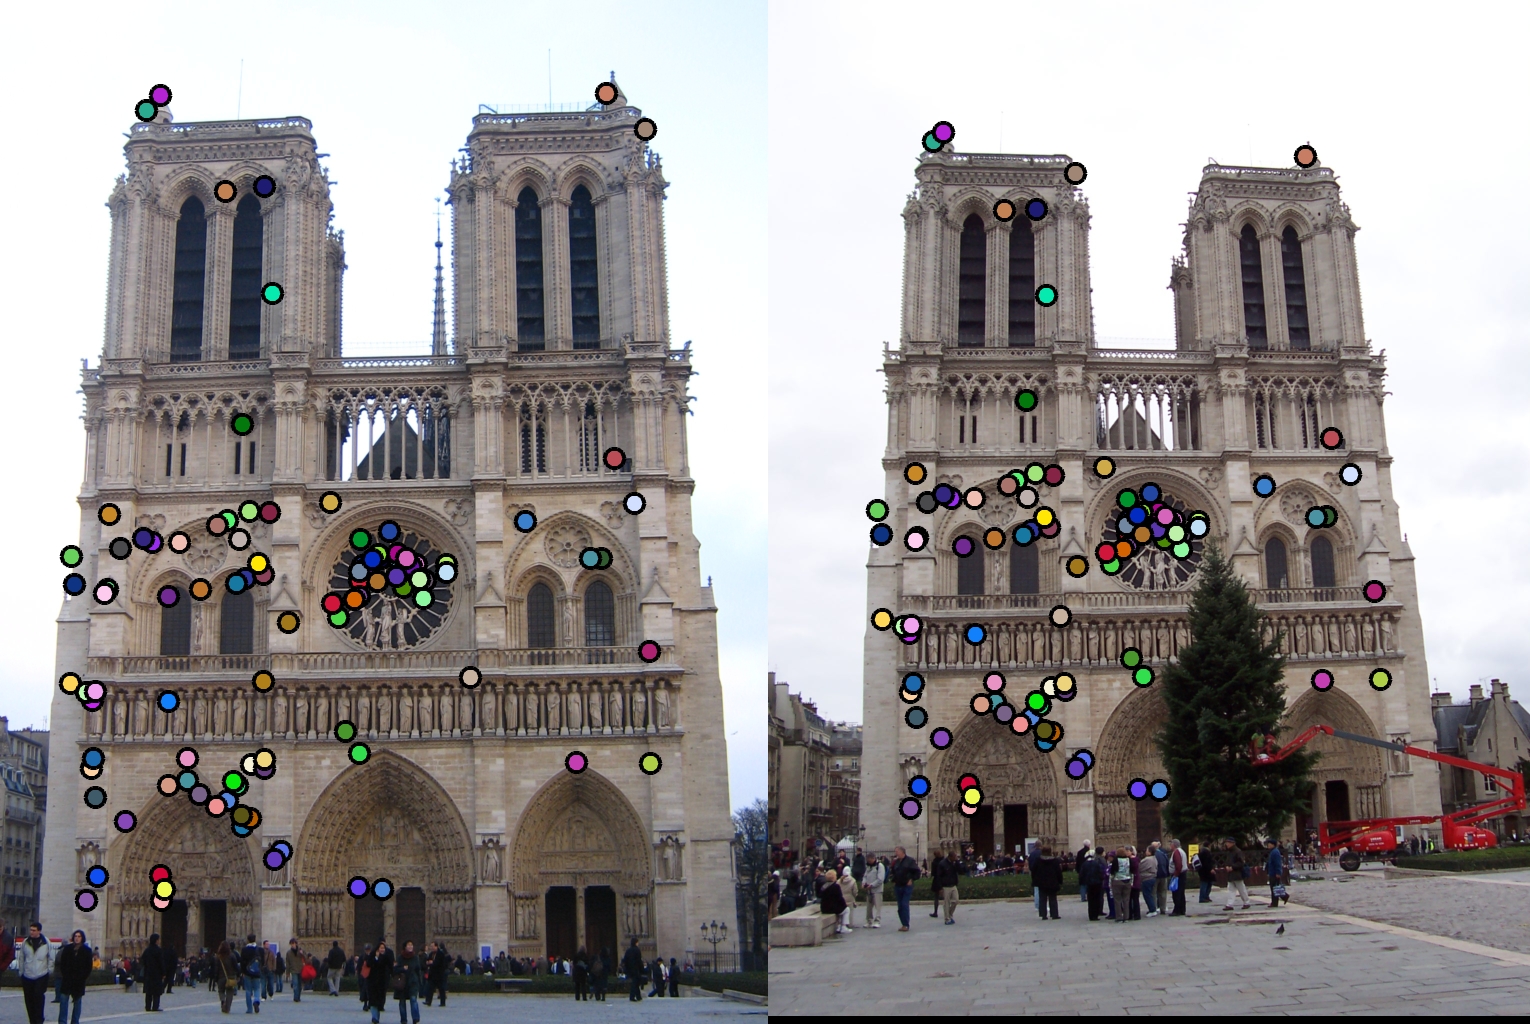
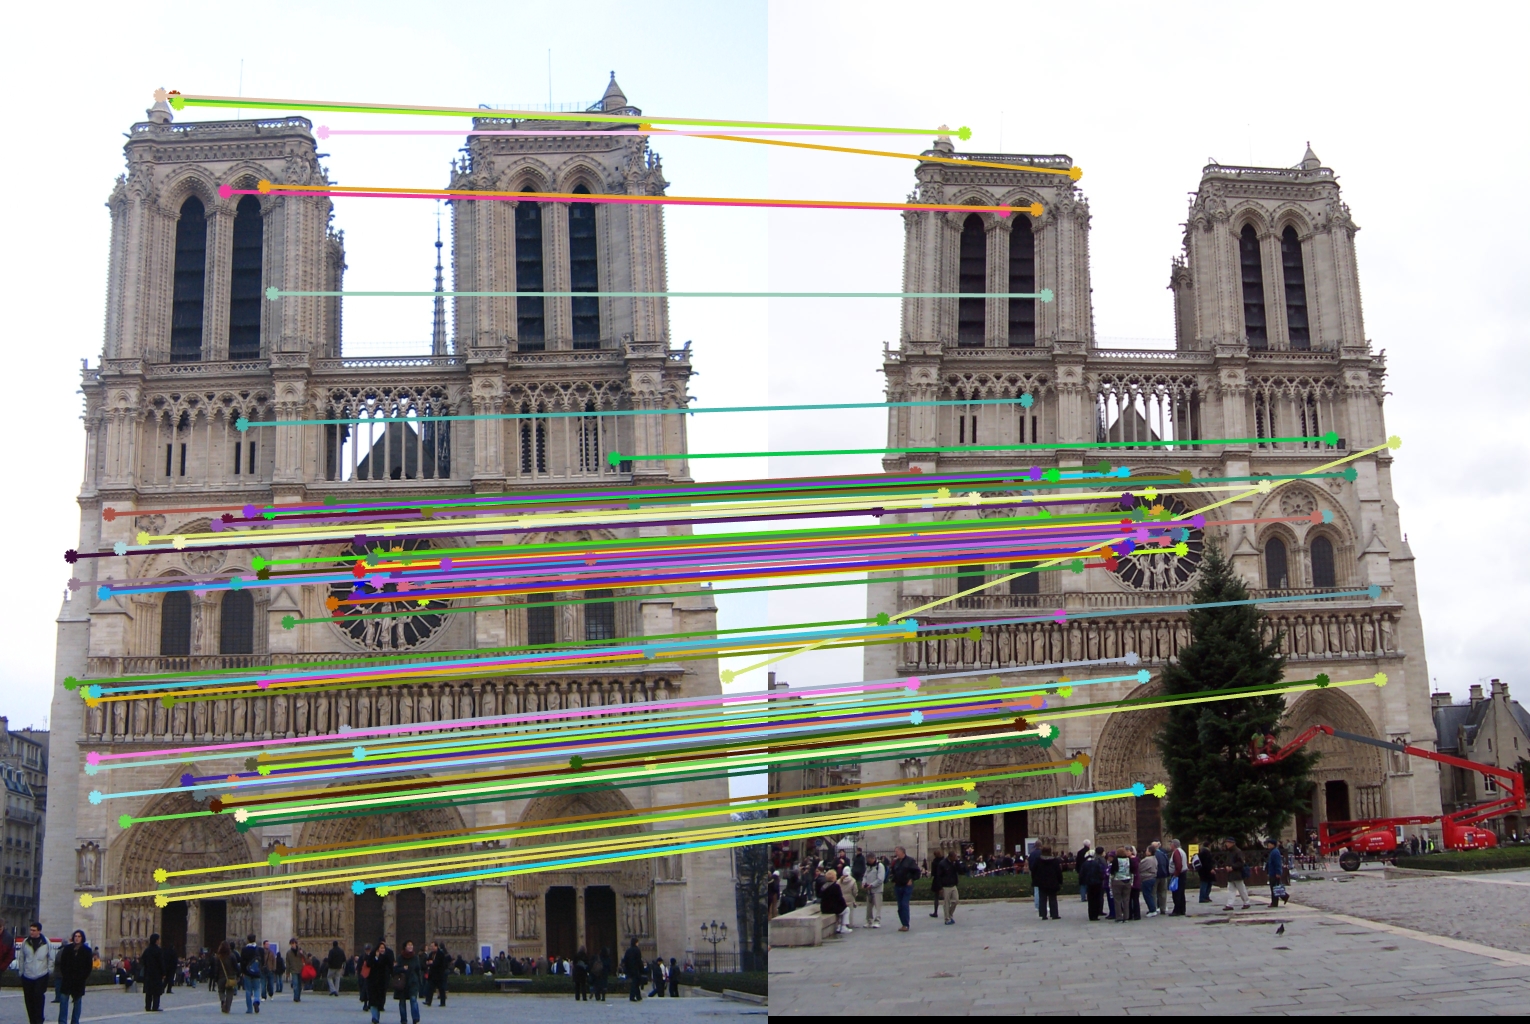
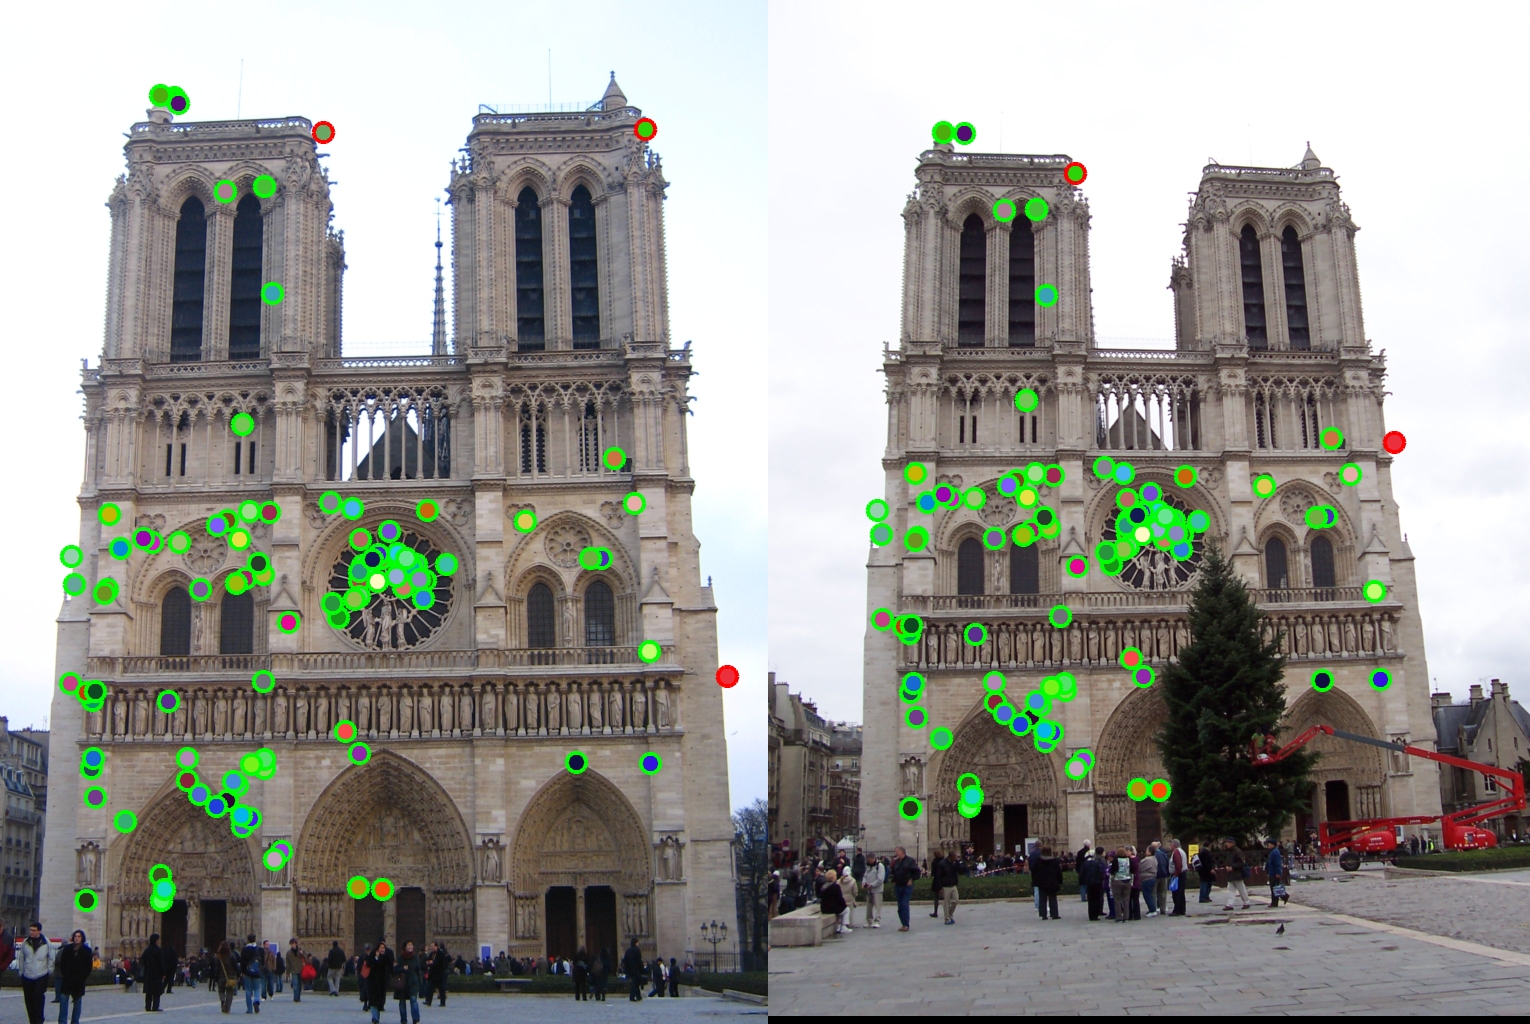
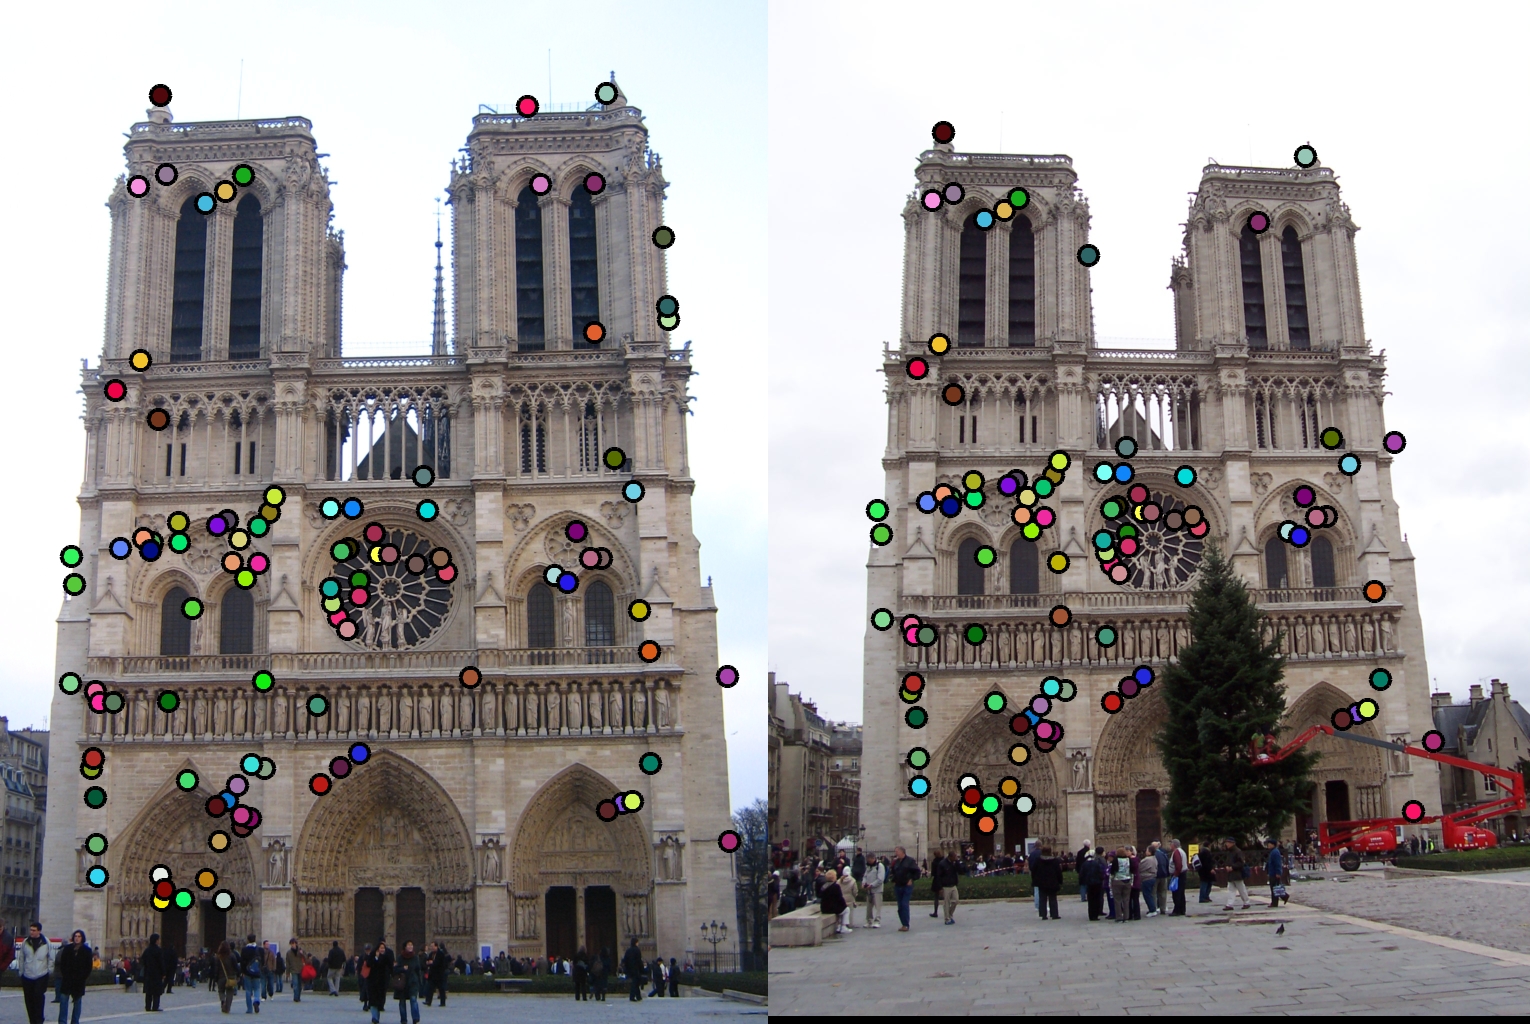
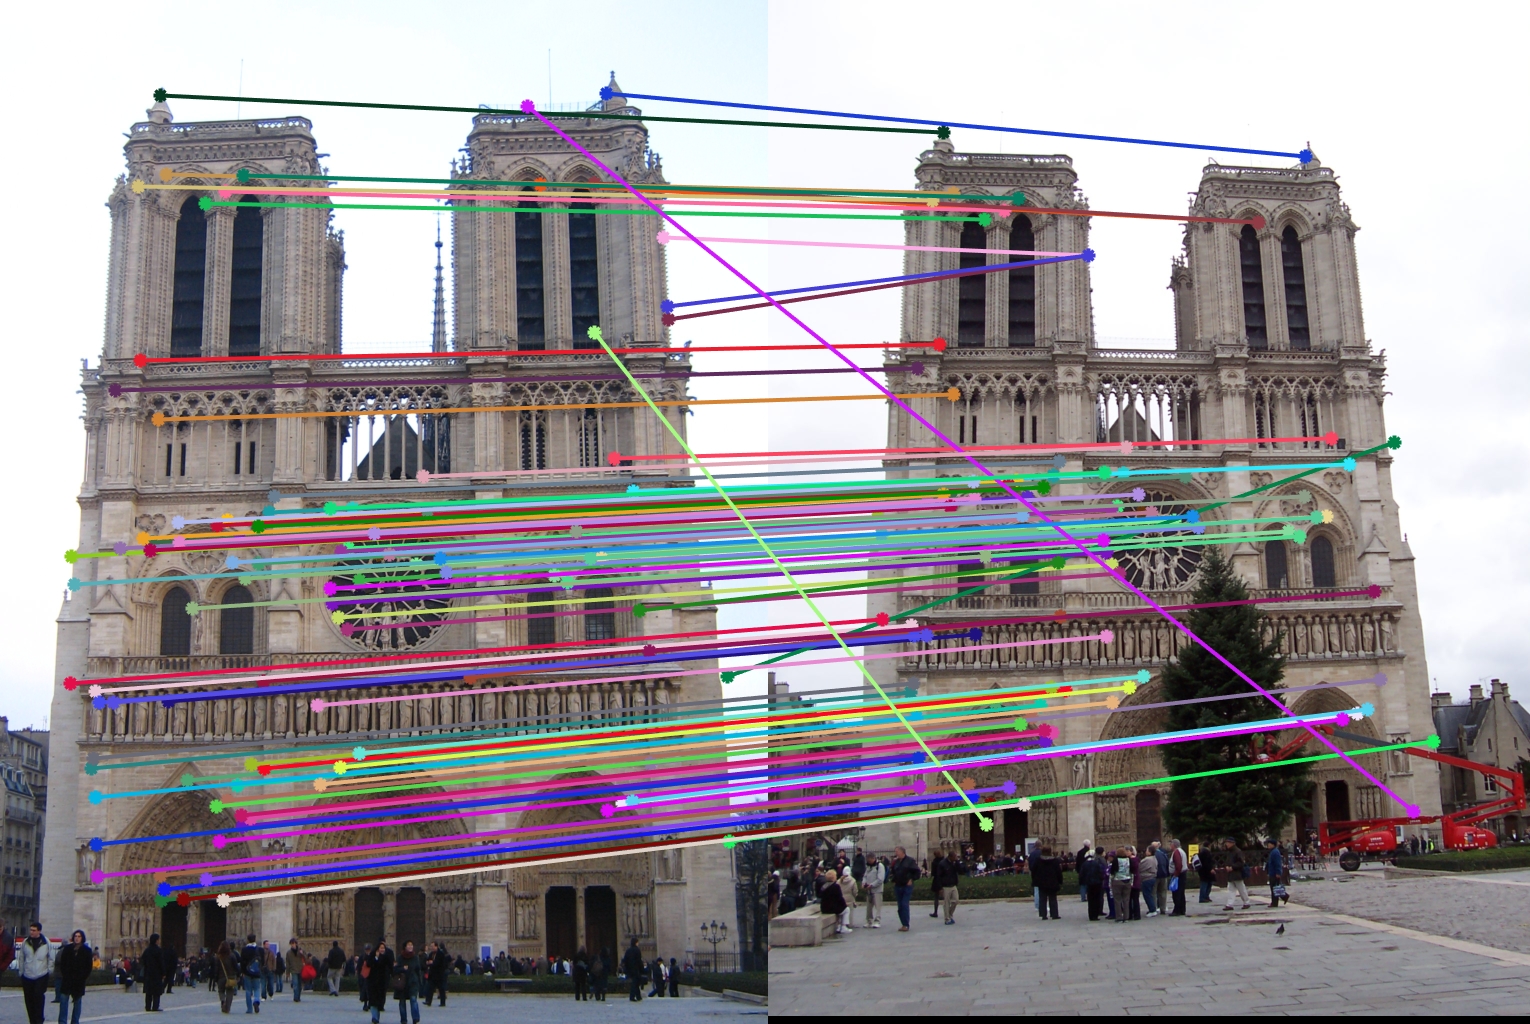
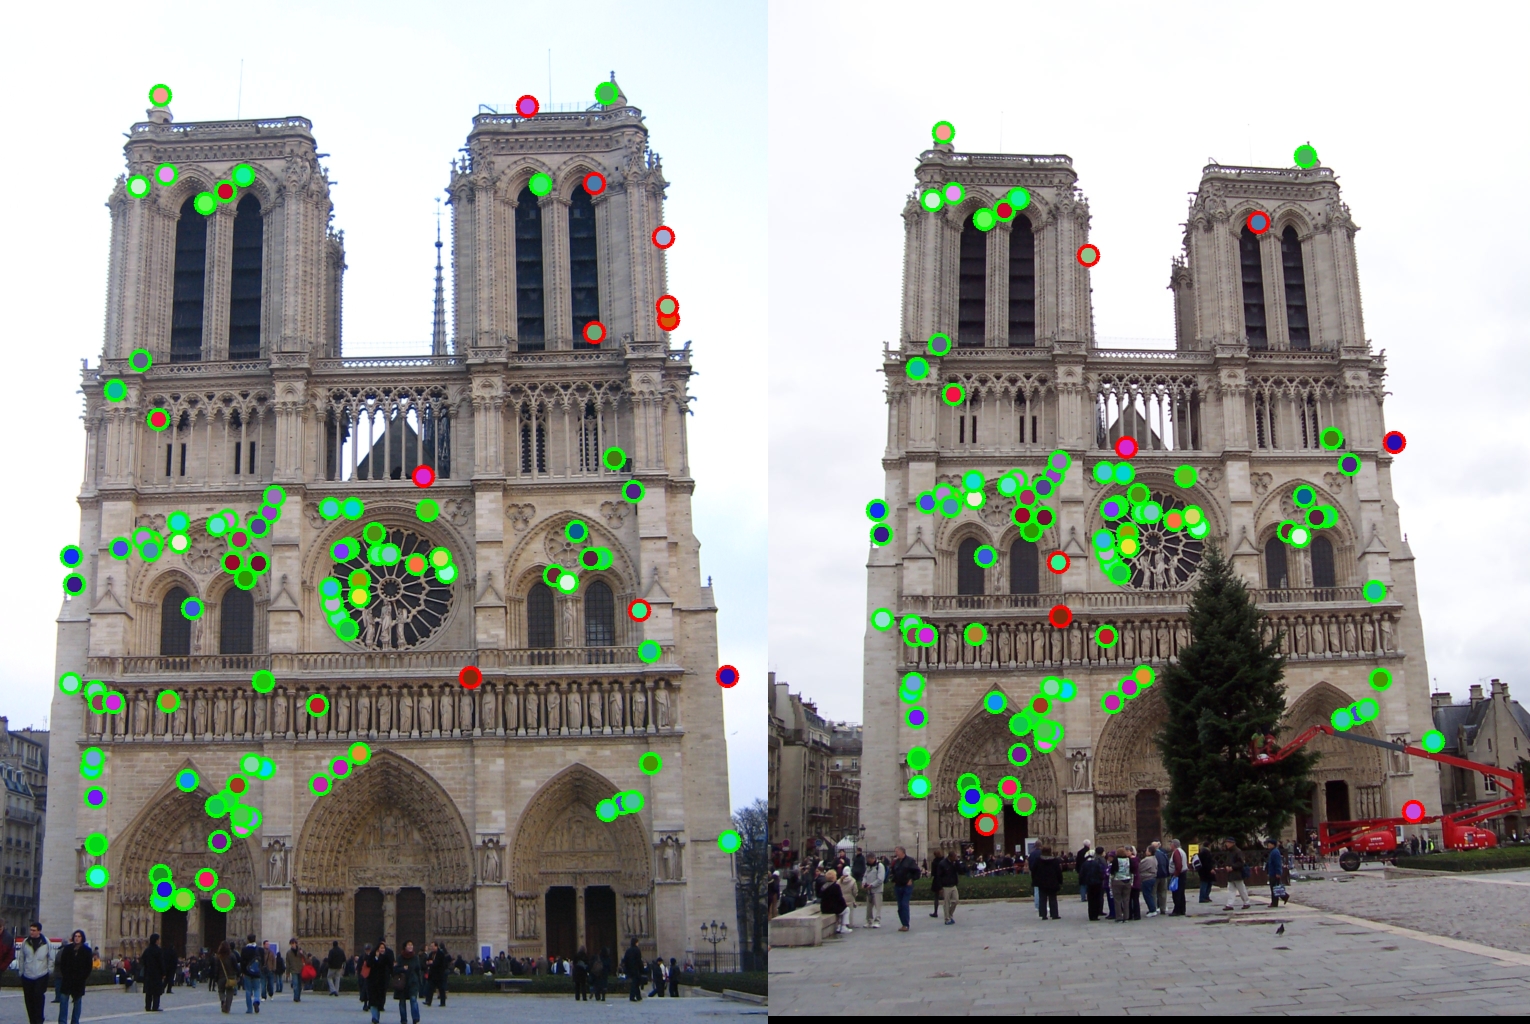
Notre Dame
LNMS:
|

|
|
98 total good matches, 2 total bad matches. 98.00% accuracy
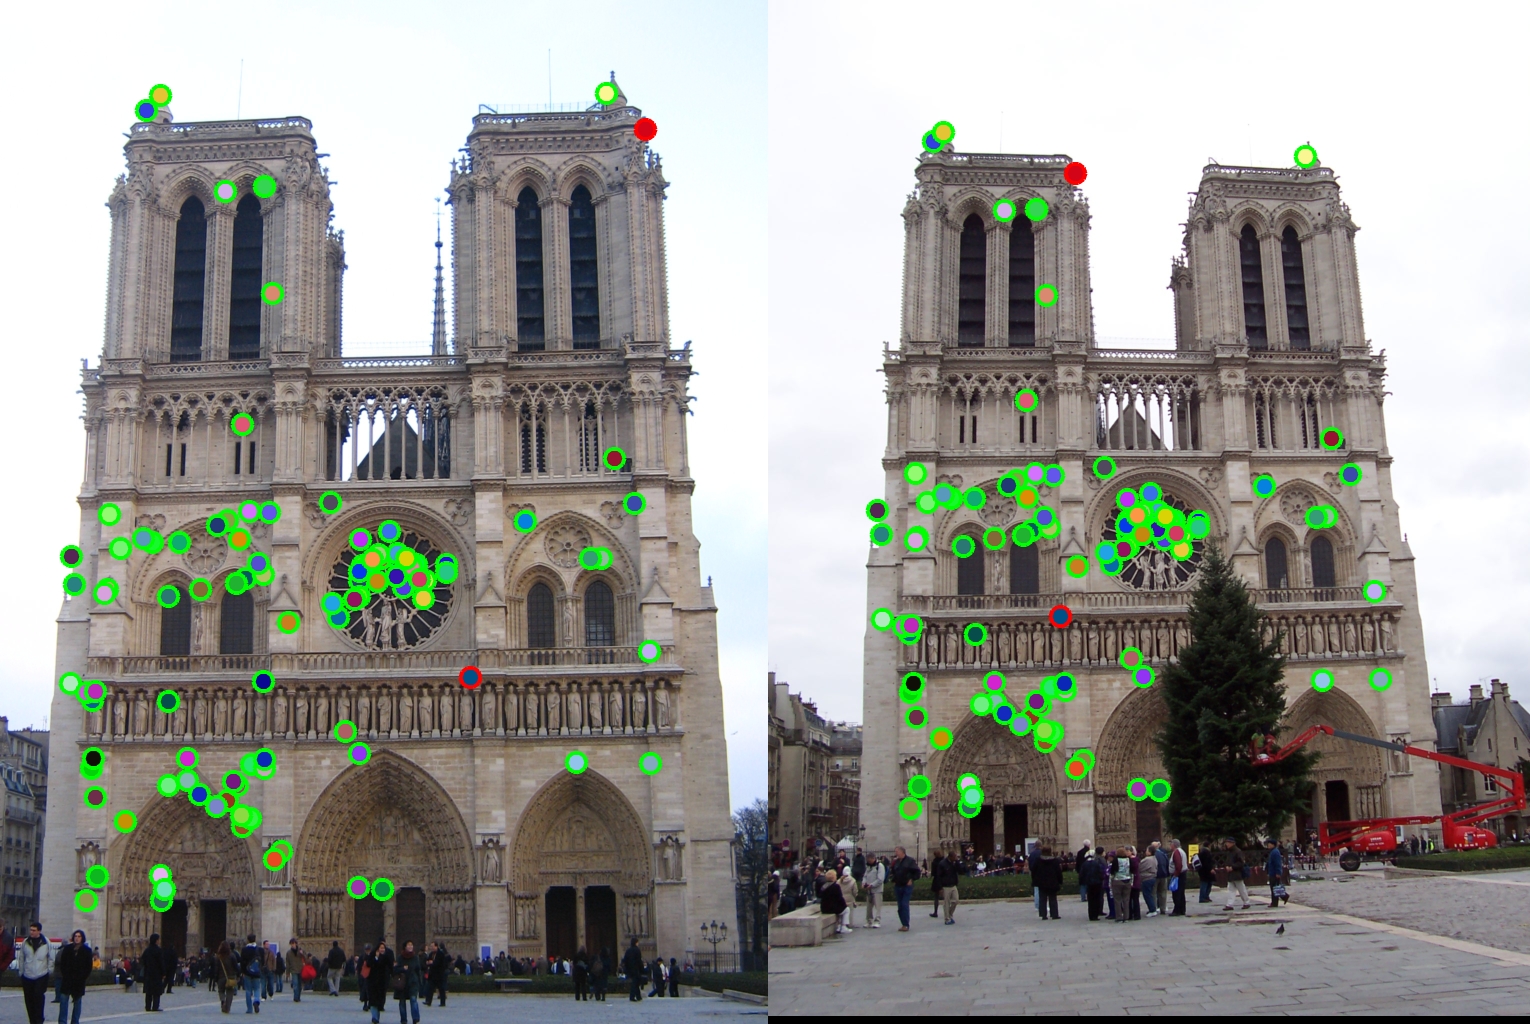
ANMS (max_pts = 7500):
|
|
|
97 total good matches, 3 total bad matches. 97.00% accuracy
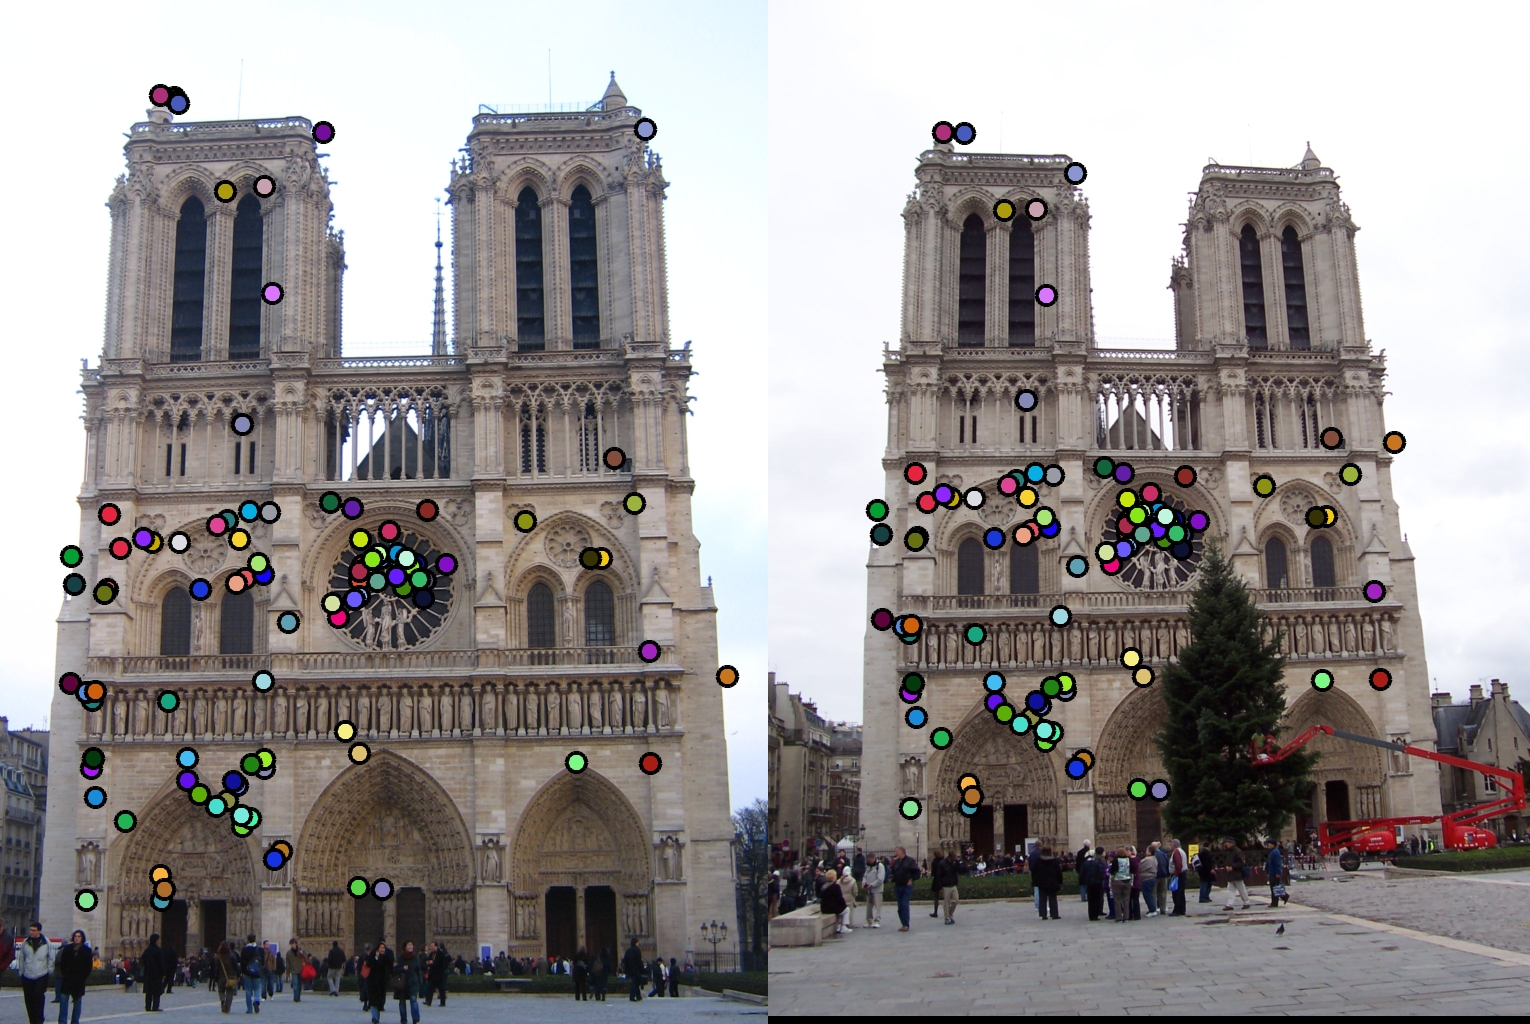
ANMS (max_pts = 3750):
|
|
|
90 total good matches, 10 total bad matches. 90.00% accuracy
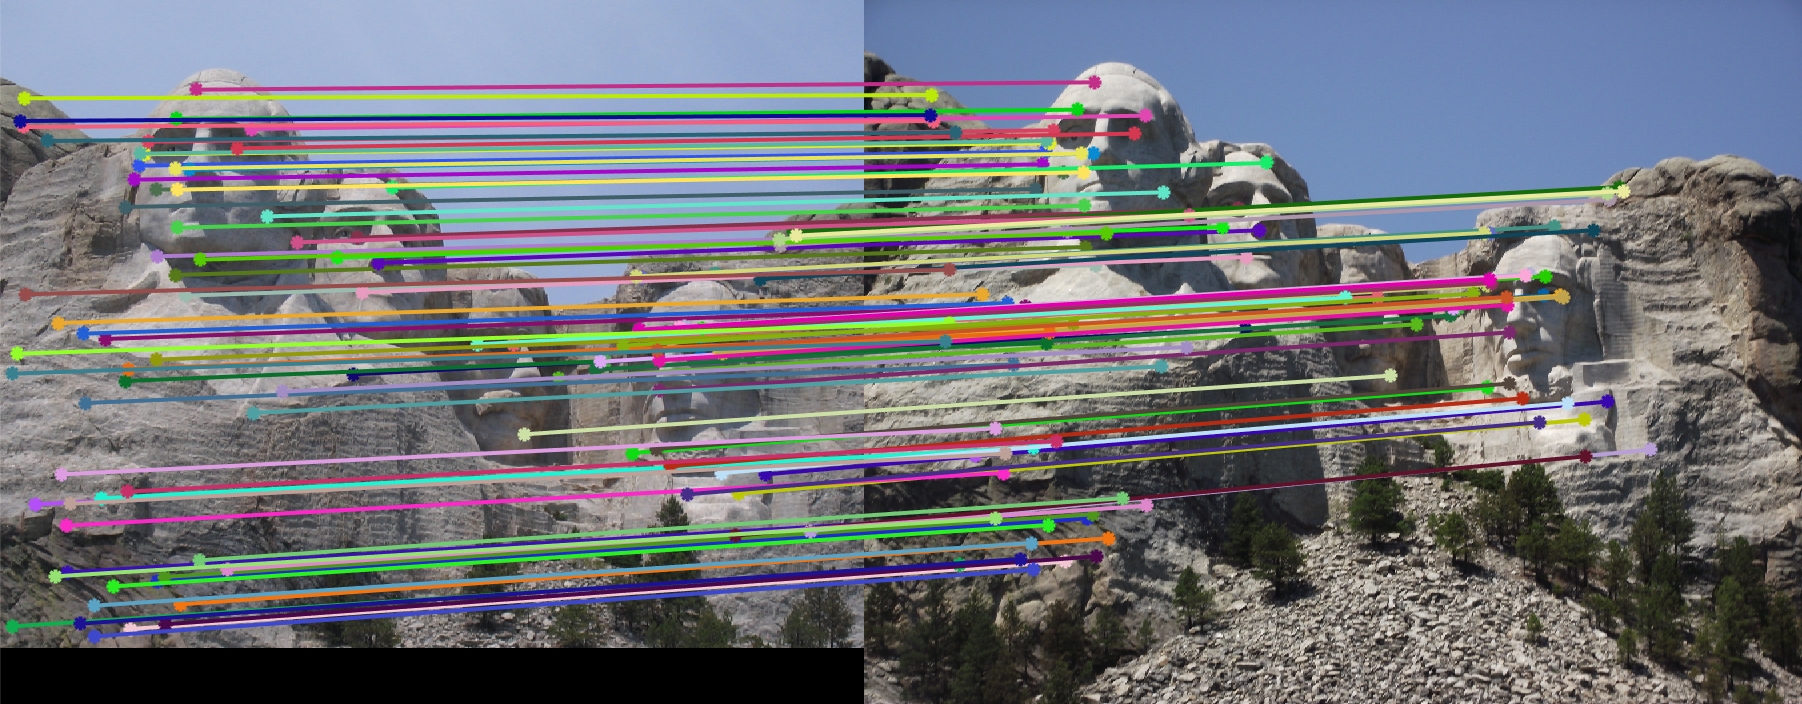
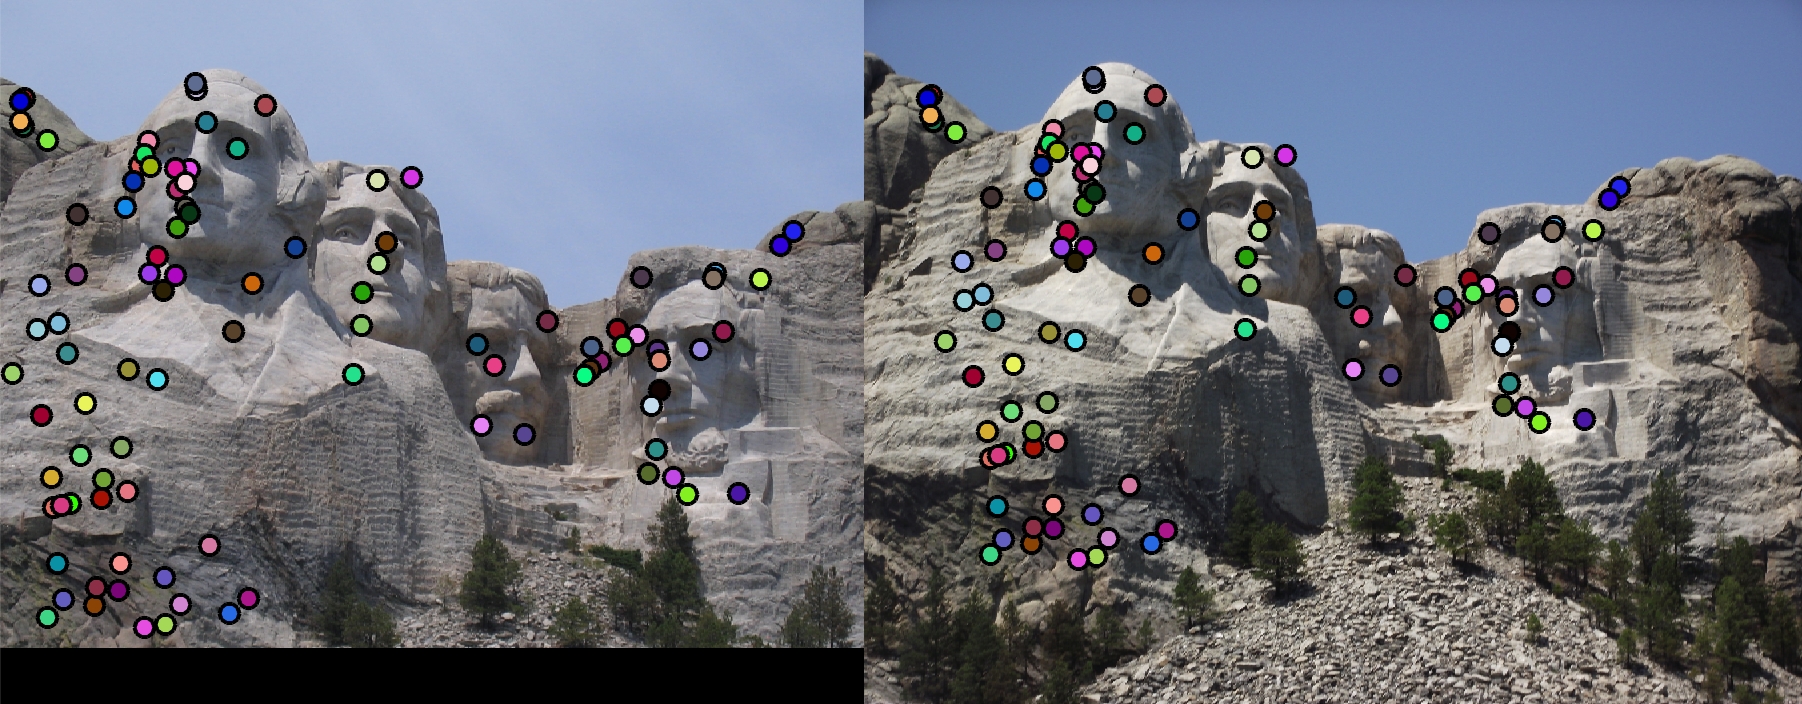
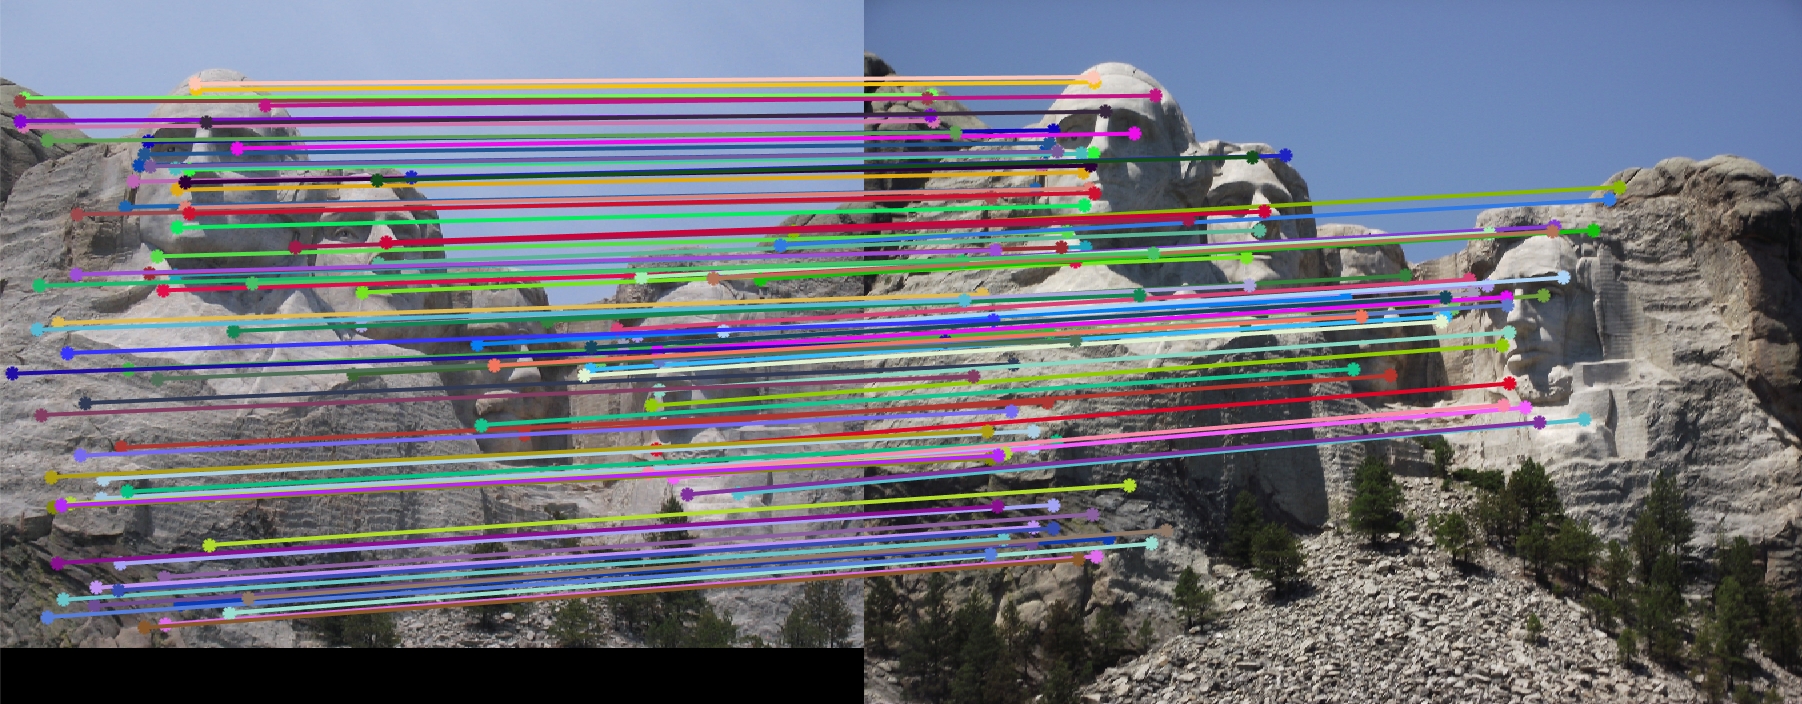
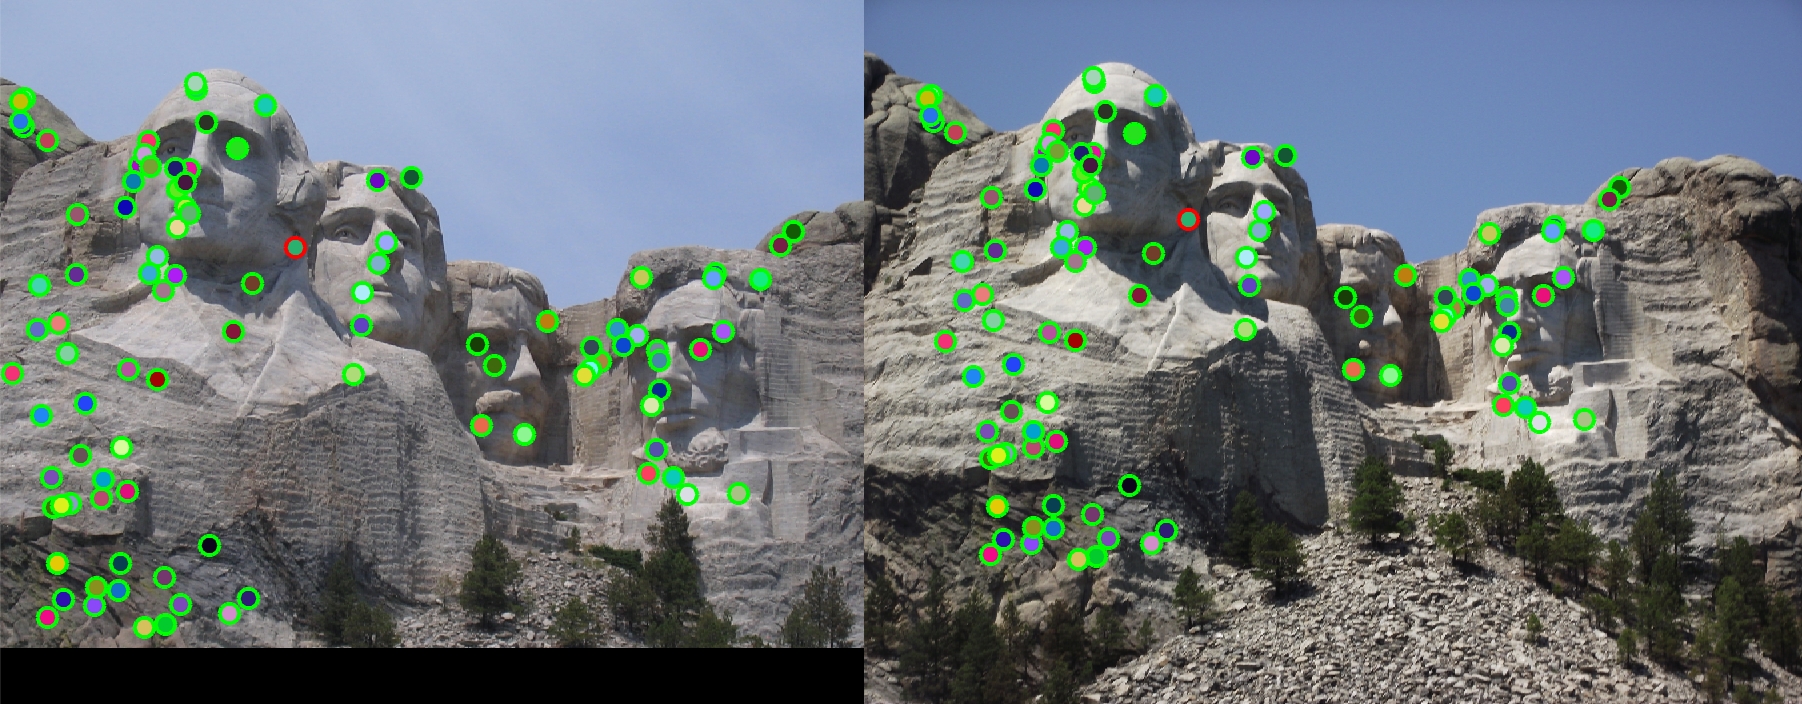
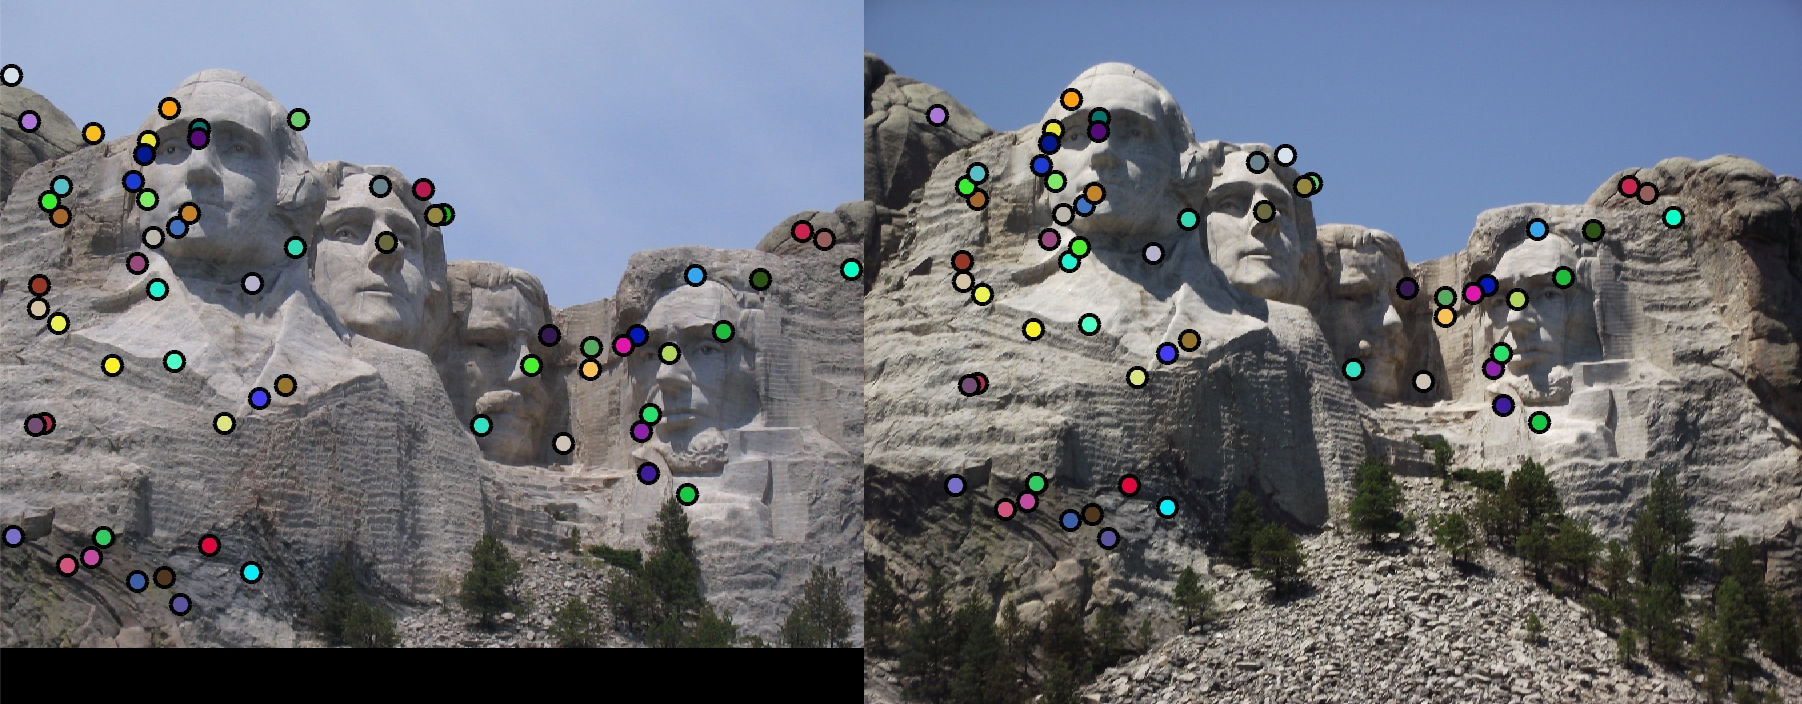
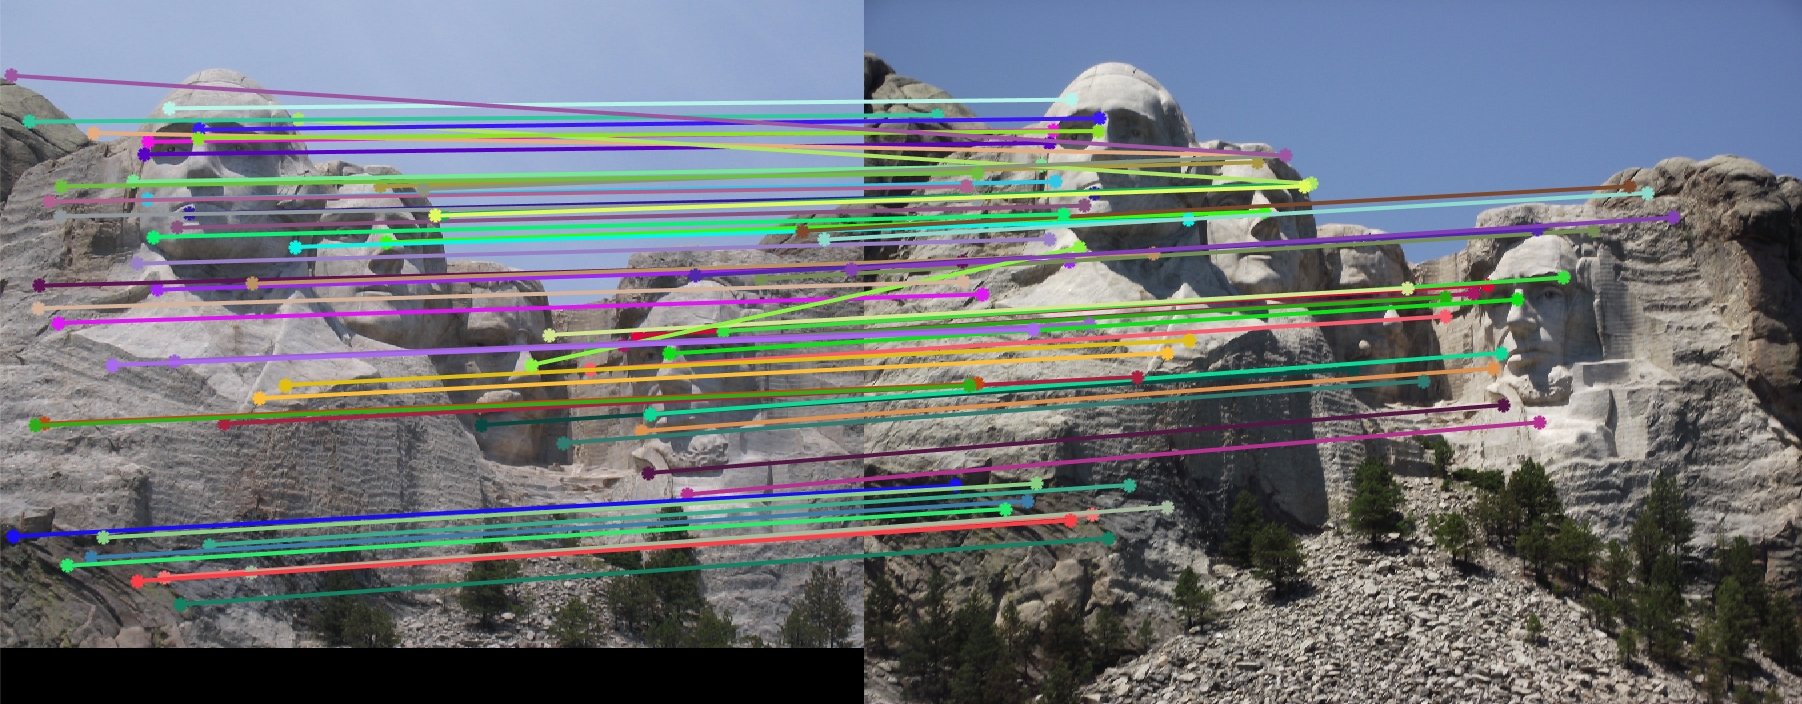
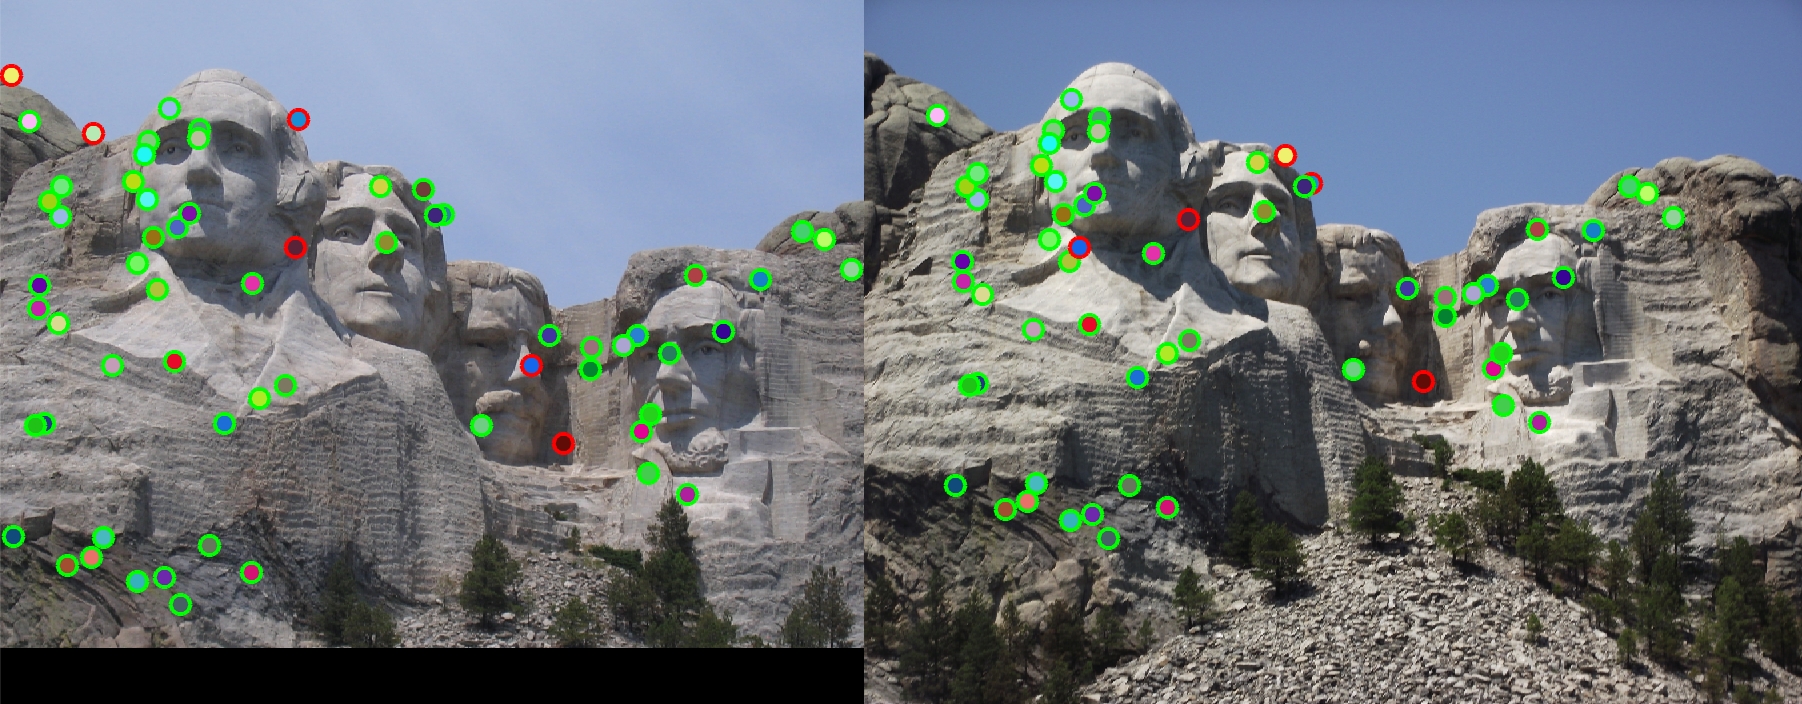
Mount Rushmore
LNMS:

|
|

|
98 total good matches, 2 total bad matches. 98.00% accuracy
ANMS (max_pts = 7500):
|
|
|
99 total good matches, 1 total bad matches. 99.00% accuracy
ANMS (max_pts = 3750):
|
|
|
58 total good matches, 6 total bad matches. 90.62% accuracy
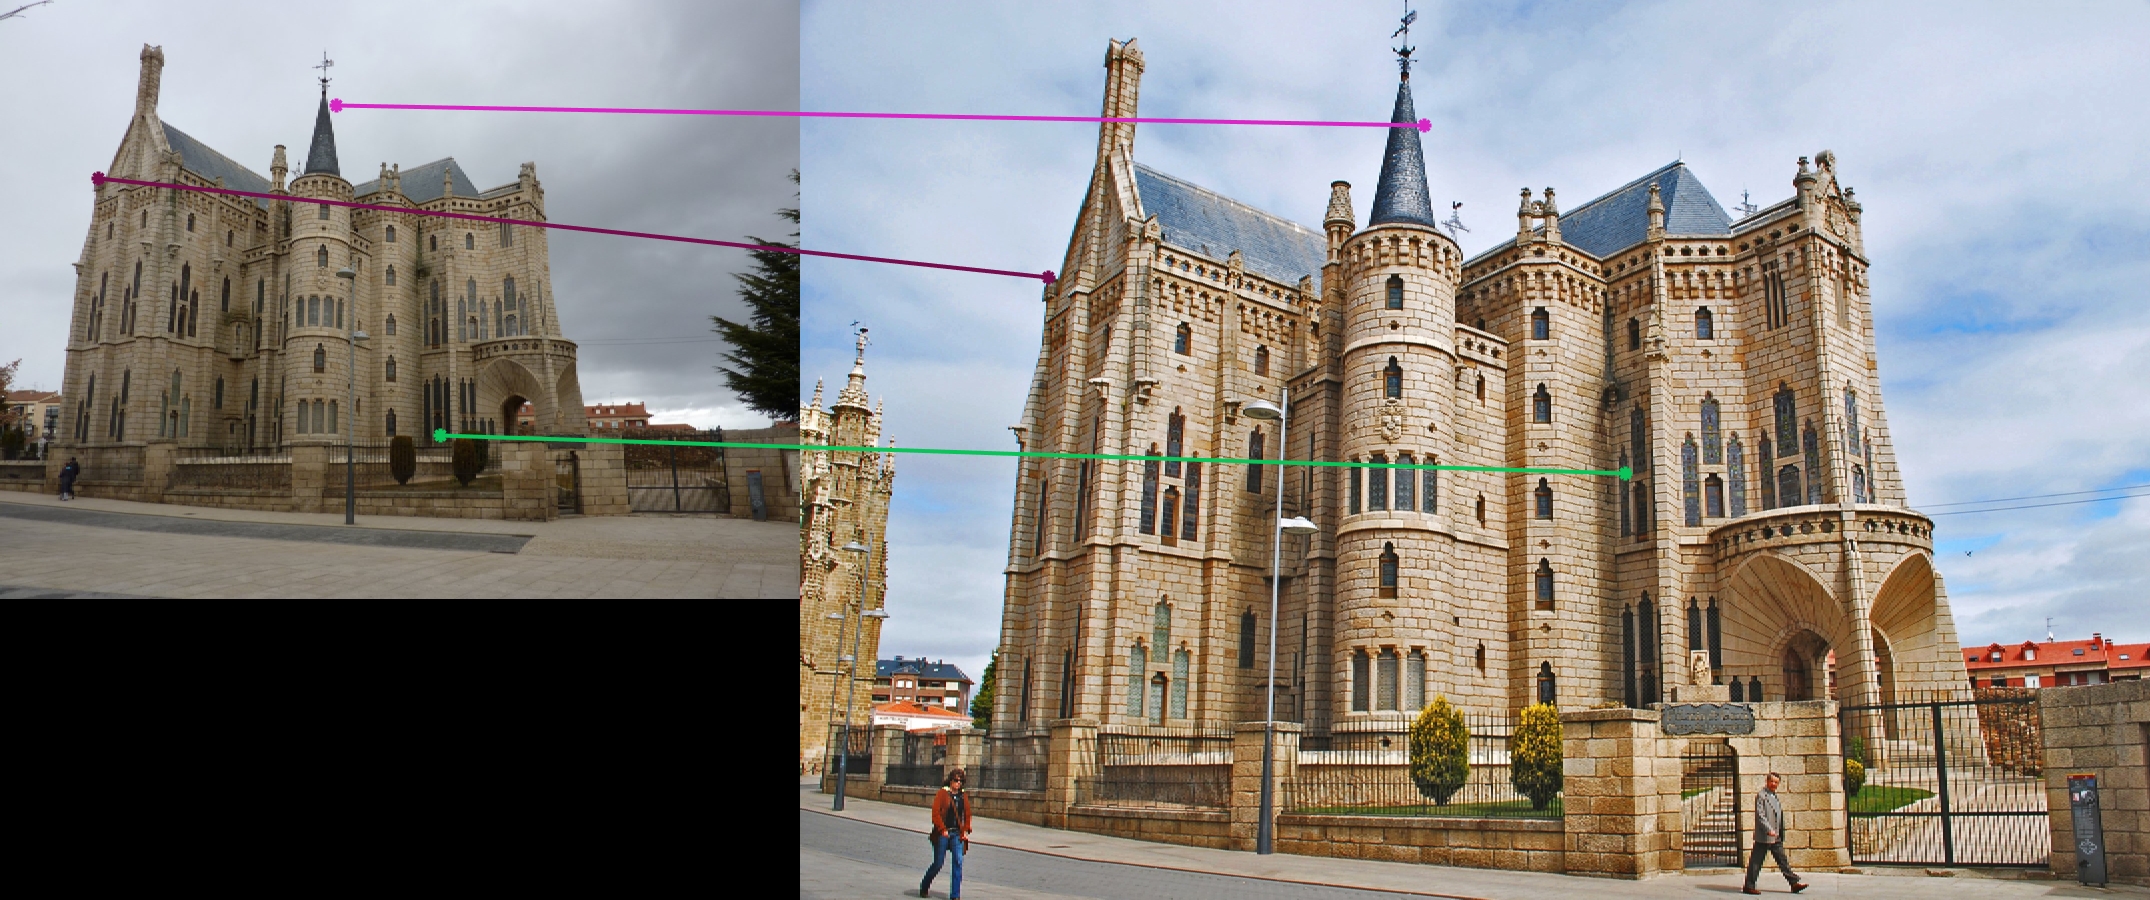
Episcopal Gaudi
LNMS:

|

|

|
0 total good matches, 1 total bad matches. 0.00% accuracy
ANMS (max_pts = 7500):

|
|

|
1 total good matches, 2 total bad matches. 33.33% accuracy
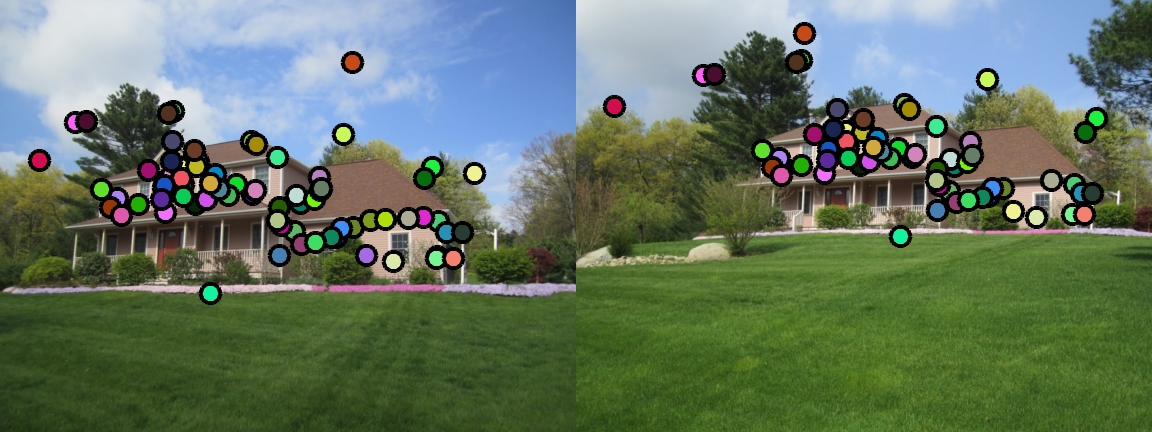
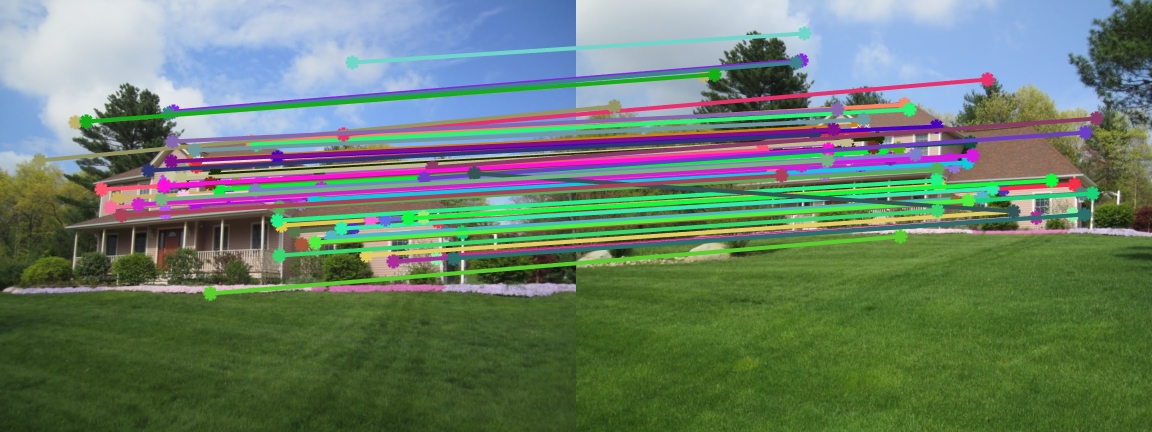
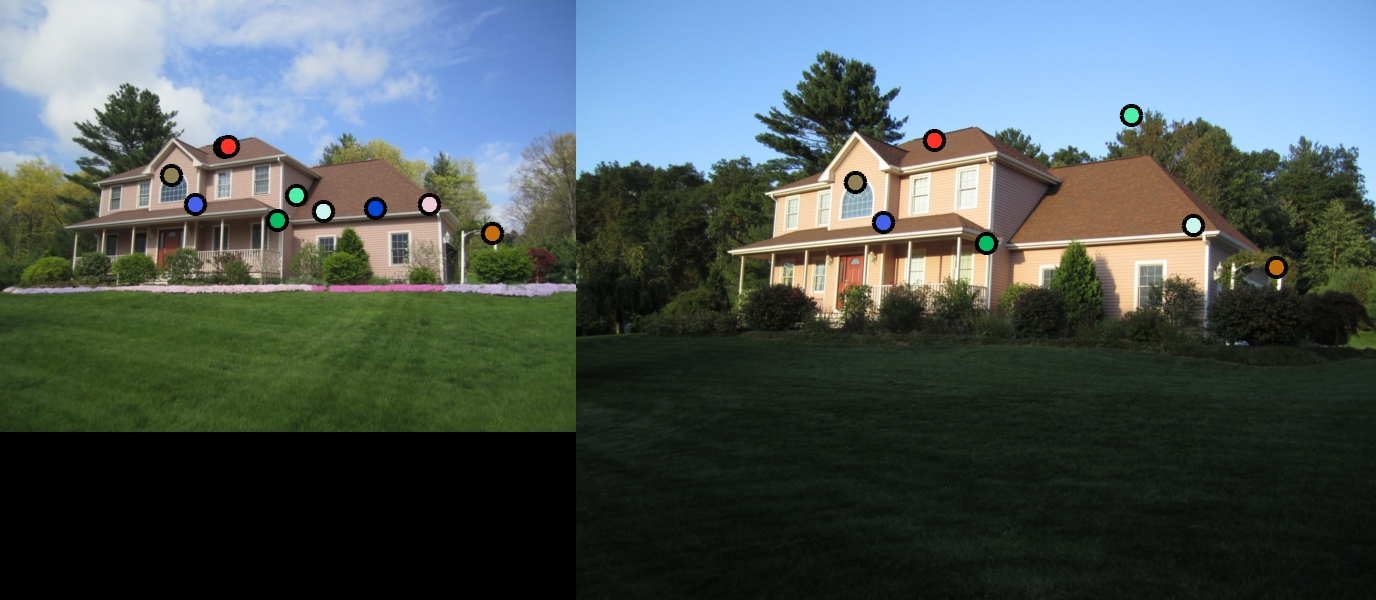
House
|
|
|

|
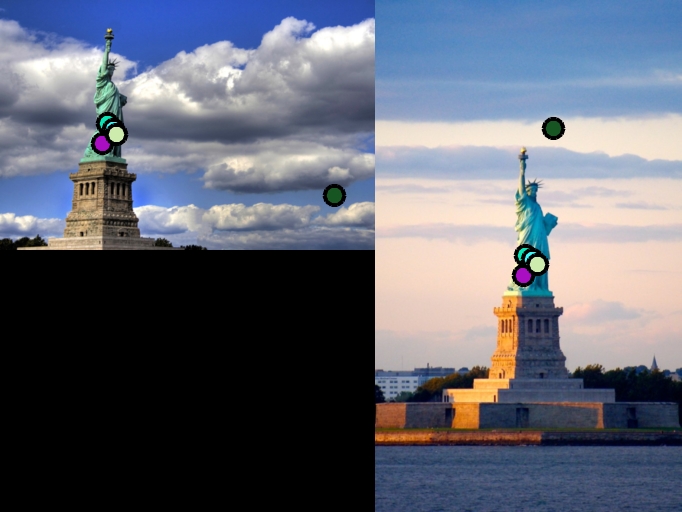
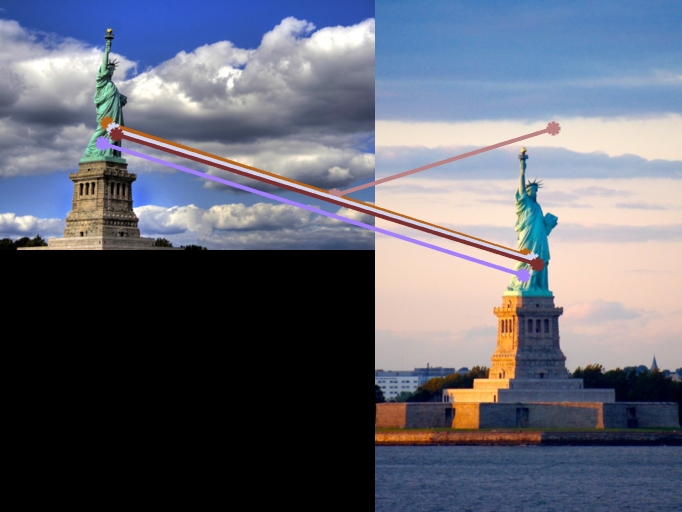
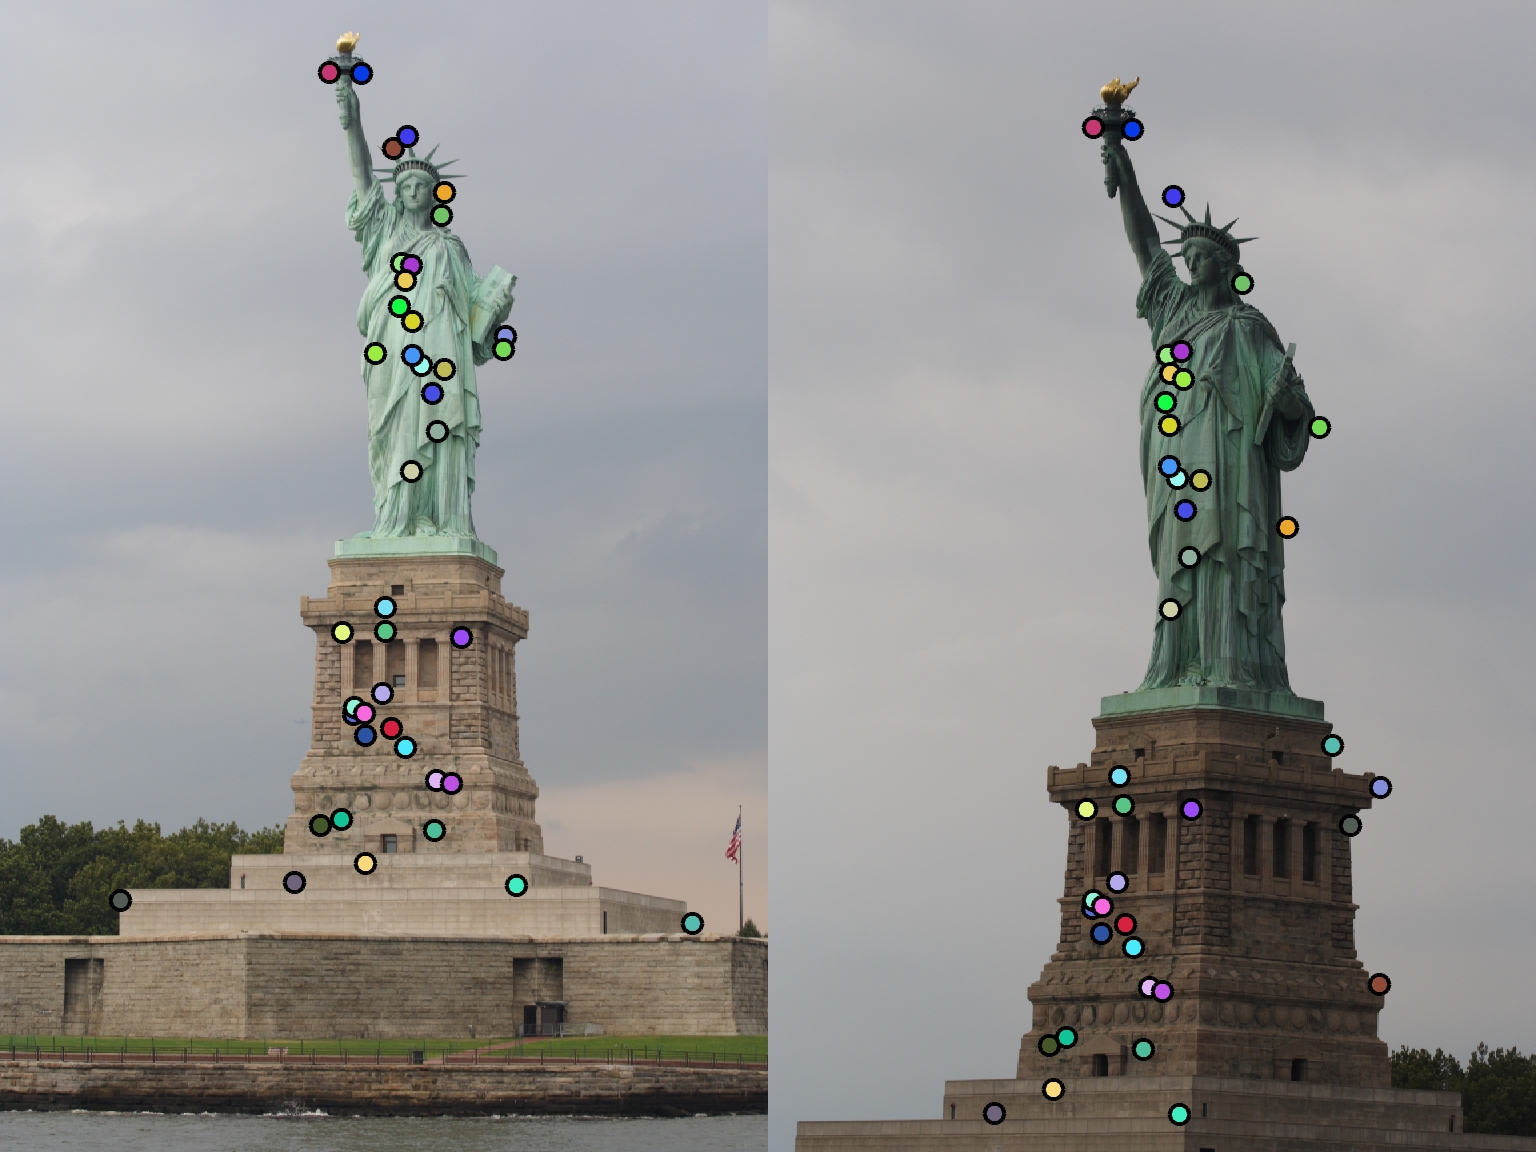
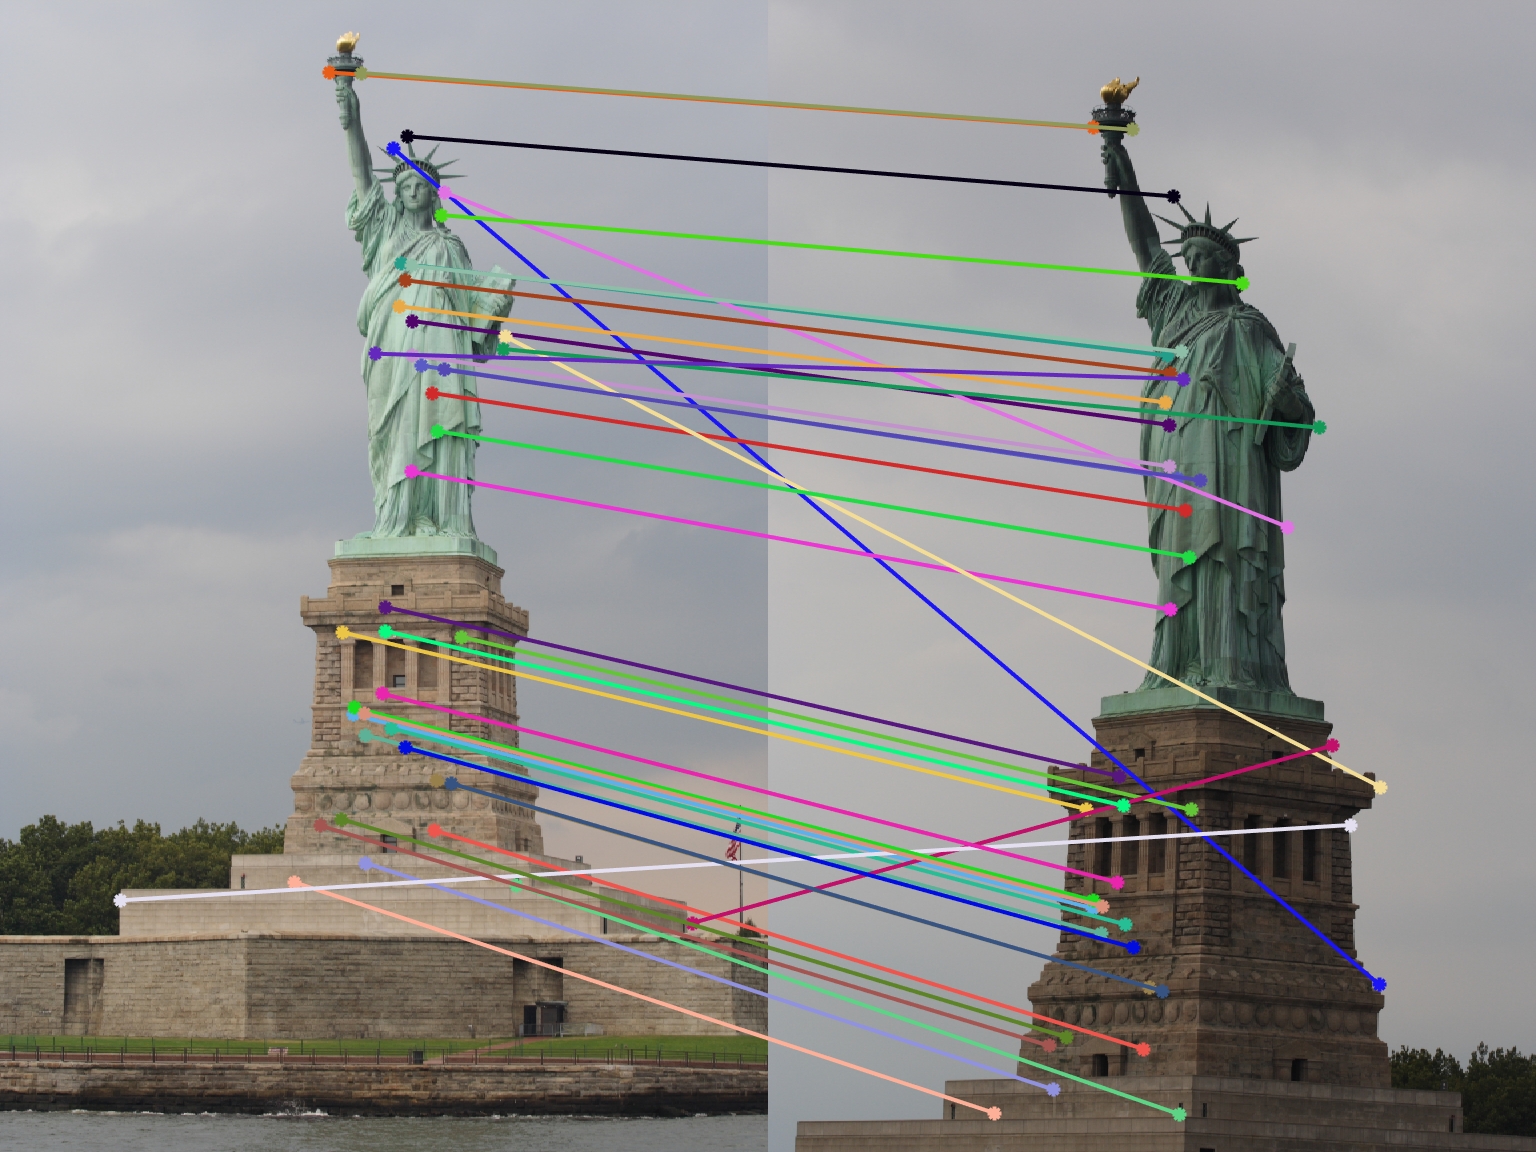
Statue of Liberty
|
|
|
|