Project 2: Local Feature Matching
This project can be split into 3 different parts:
- Corner Detection to find comparison points between images
- Features Creation on the corner centroids to "fingerprint" features for matching
- Feature Matching between the two images to find common points of interest
Each of these parts is split into a different function. The first function, get_interest_points implements a version of a Harris Corner Detector by first computing a Harris Matrix:
\[har = g(I^2x)g(I^2y) - [g(IxIy)]^2 - \alpha[g(Ix^2)+g(Iy^2)]^2\]
with \(\alpha=0.1\) which provided the best results in experimentation. Next, I thresholded our new matrix by only selecting positive values. This identified the different components in the image, for which I took the centroid of each component and used it for my interest point. However, due to my conservative threshold, this left us with over 10000 points for some images. To combat this, I sorted these points by their value and took only the first 3000 points (or all if less than 3000 were found). This provided me with a number of strong features that would be likely to turn up unique features and matches in the later steps. The image below shows what this looks like for the Notre Dame pair of images. This image, for clarity, shows only 100 points on each image. As you can see, most points seem to be at common points on the two images, but there are some slight positional differences. This is most likely a side-effect of choosing centroids for each features. Finding the max of each feature would likely yield a better effect here. However, the results below are enough to supply enough good points for the following two steps.
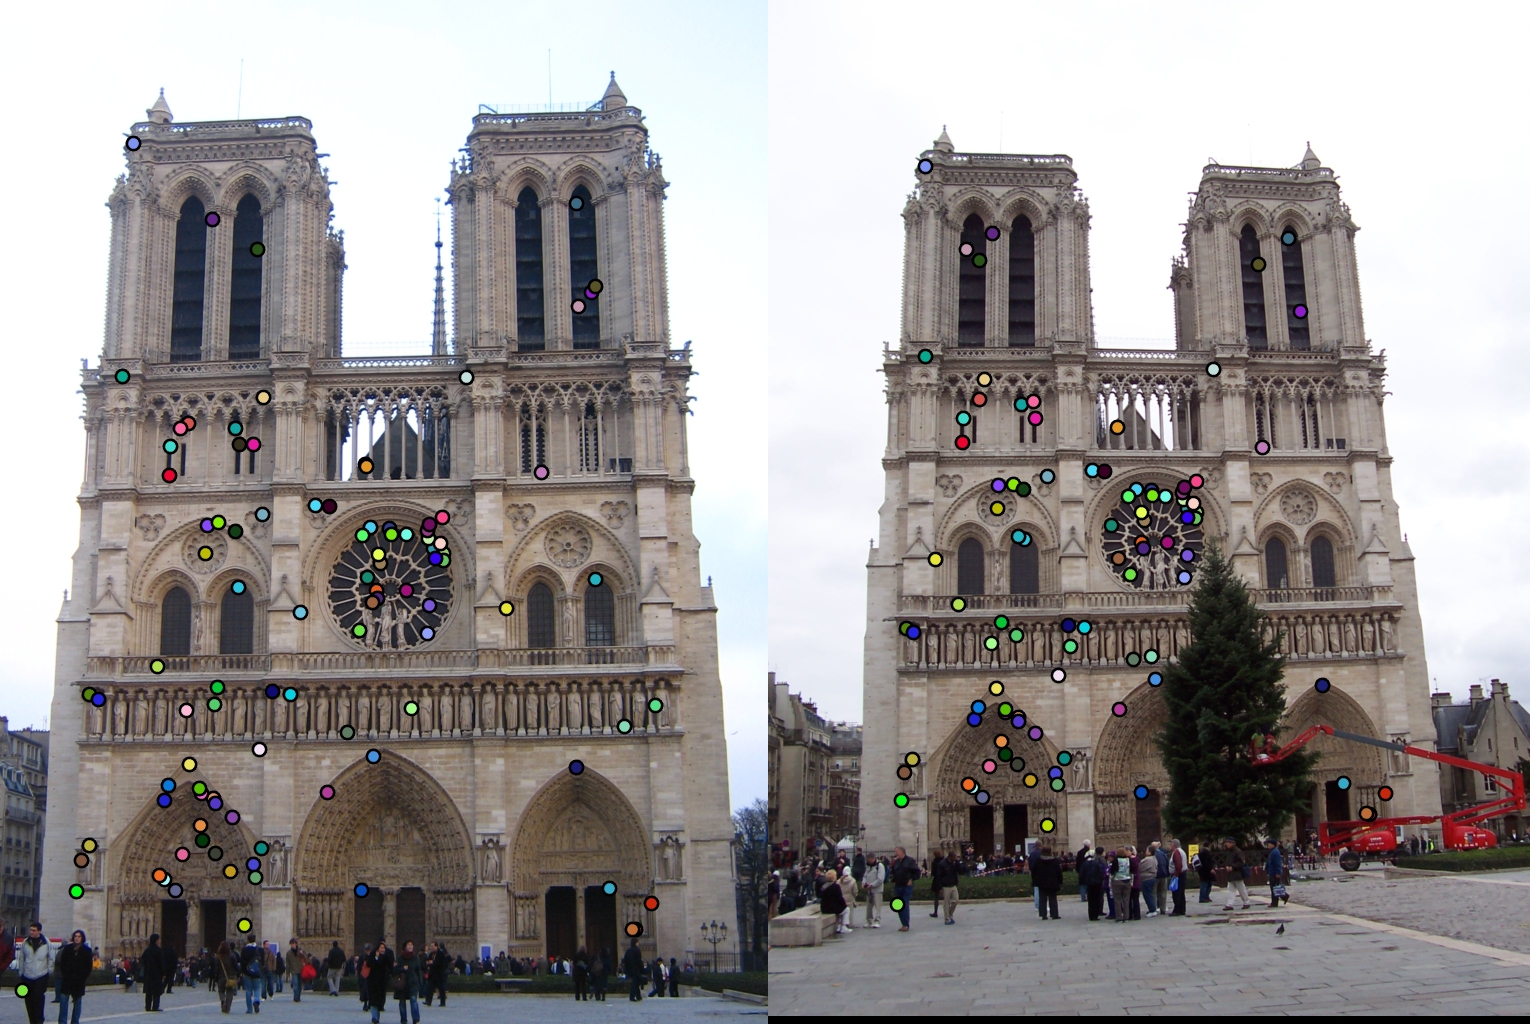
Interest Points on two images of Notre Dam
The next function, get_features, is responsible for fingerprinting the points found above. In essence, for each point found, I want to look at the region around it and create a representation for it that is unique compared to other similar points, but is flexible enough to get close results for the same location viewed from different angles. I do this through the construction of SIFT-like features for our images.
For each interest point, I create a region around it and subdivide that into 16 separate regions. In each of these, I examine the gradients for each pixel and bin them by projecting them to the nearest 45 degree bin. All together this gives us \(8\times16 = 128\) features for each point to compare. Finally, the elements of each features are square rooted and the resultant vector is normalized. Rooting helps to shrink the differences between slightly different fingerprints which improves matching. Normalization is important to keep all distances relatively low so that the algorithm used in feature matching is more successful.
Finally, all that remained was the match the features between the pairs of images. This was handled in the aptly named match_features function. This simple function looped through all features in the first image and compared its distance with every feature in the second image. Features were matched with their closest image, then after that were ranked in confidence by comparing the ratio of the closest match with the second closest match by the following formula:
\[\text{confidence} = 1 - \frac{d_1}{d_2}\]
After this, matches were sorted by confidence and the top 100 were used in the final product. With this full algorithm in mind, accuracy on the Notre Dame images reached 86%. With the Mount Rushmore pair, 59% accuracy was reached. And finally, an accuracy of 9% was achieved on the Episcopal Gaudi pair. Below, each of these pairs are shown, along with lines connecting the matching interest points between the two images.
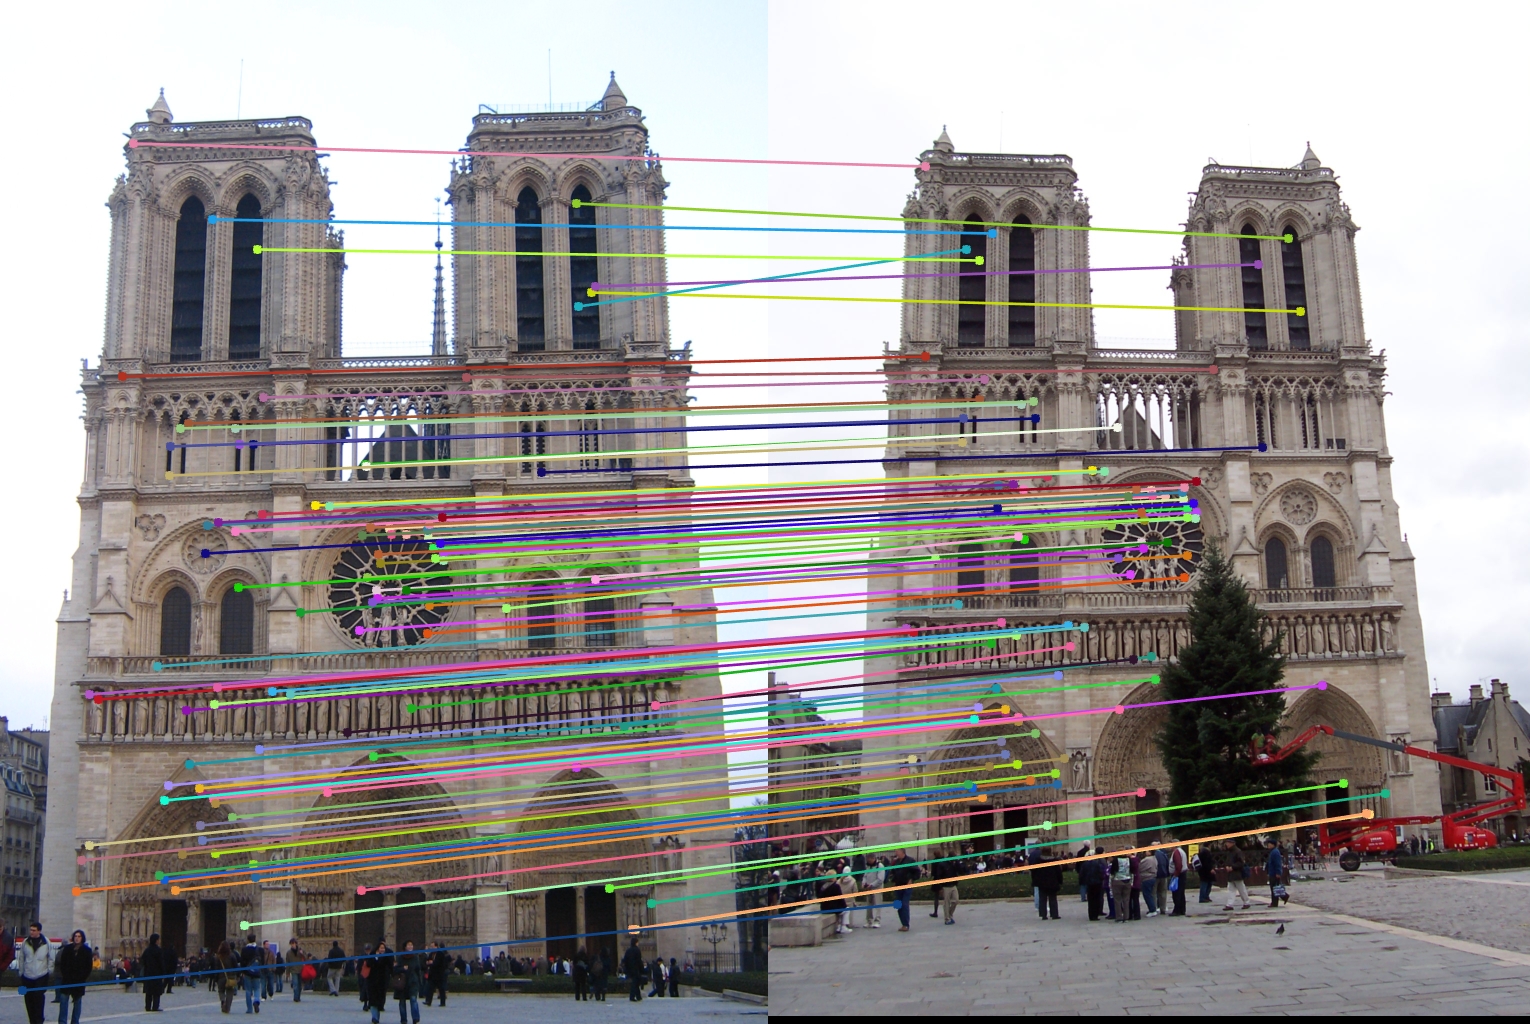
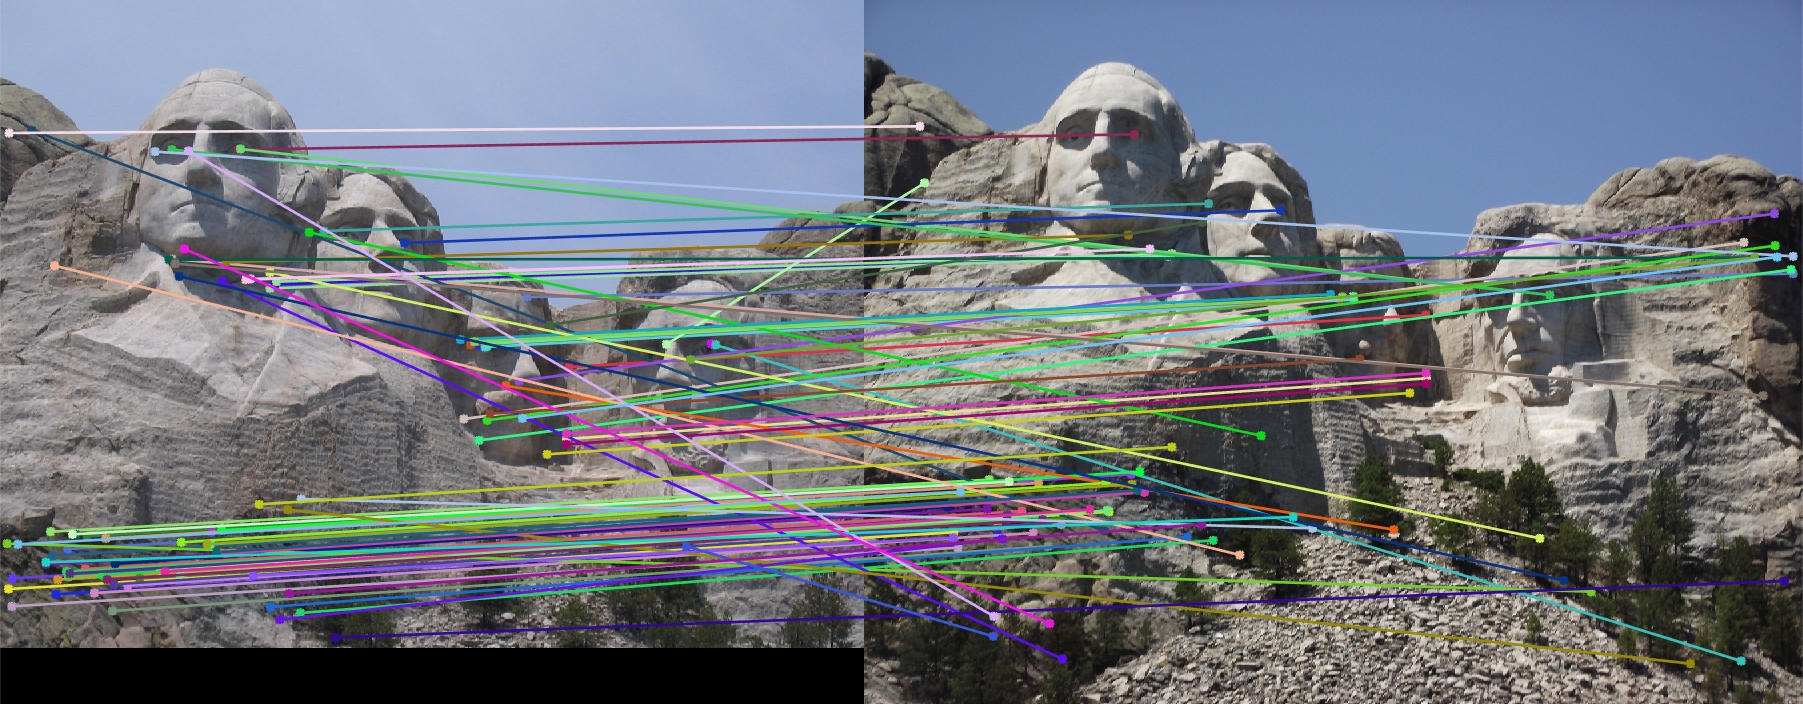
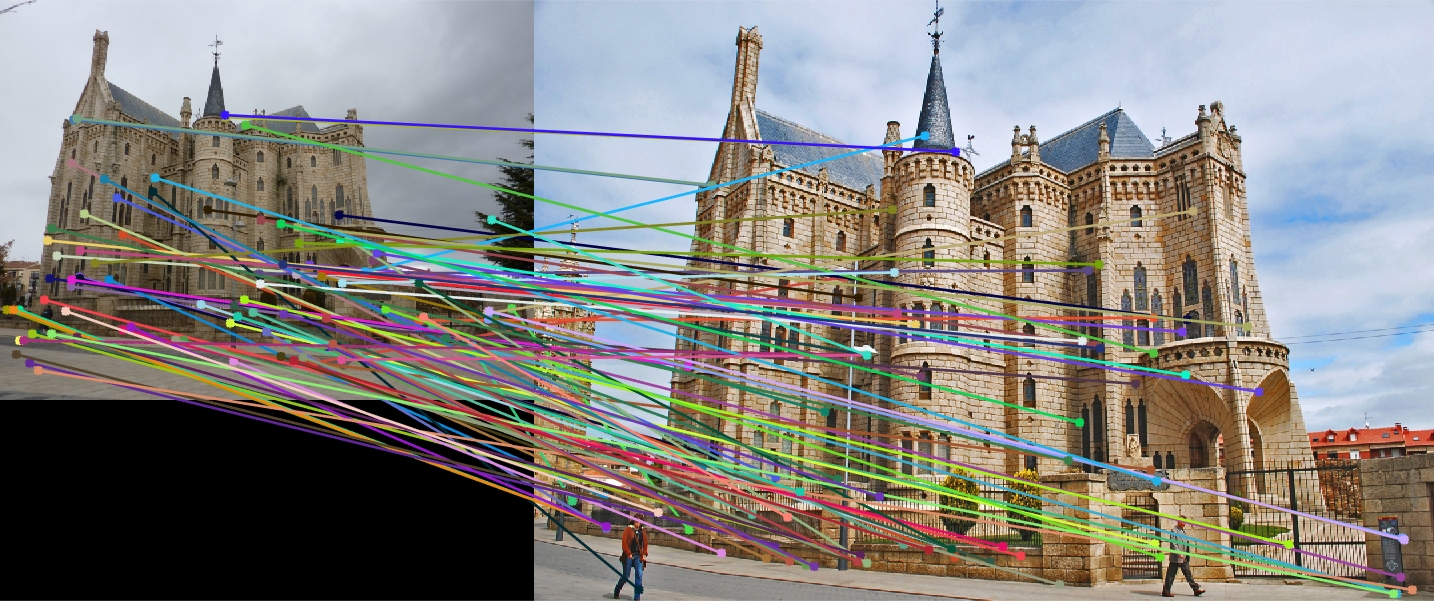
Lines in the images above showing the matches in interest points made for each pair
Notre Dame generally does pretty well. Most connections are close, with only a few off in part because the interest points aren't completely repeatable between the two pairs, making matches somewhat impossible. Mount Rushmore performed much worse on the top part of the image then the bottom. The different shades of stone in the mountain are much harder for the algorithm to pick up than the fully man-made architectural piece that is the Notre Dame. Finally, the Episcopal Gaudi performs by far the worst. This is because the features used were not made fully scale invariant. Additionally, the same feature_width of 16 was used throughout, which was less than optimal for the much smaller left image.