Project 2: Local Feature Matching
Evaluation of local feature matching
Local feature matching is a process of determing whether two images which may have slightly different photometric and geometric transformations are have similar points or not. In this project we are implementing a local feature matching algorithm, the simplified version of the famous SIFT pipeline. The matching pipeline is intended to work for instance-level matching - multiple views of the same physical scene. The SIFT pipeline contains three stages viz.-
- Interest point Detection
- Local feature Description
- Feature Matching
Interest Point Detection
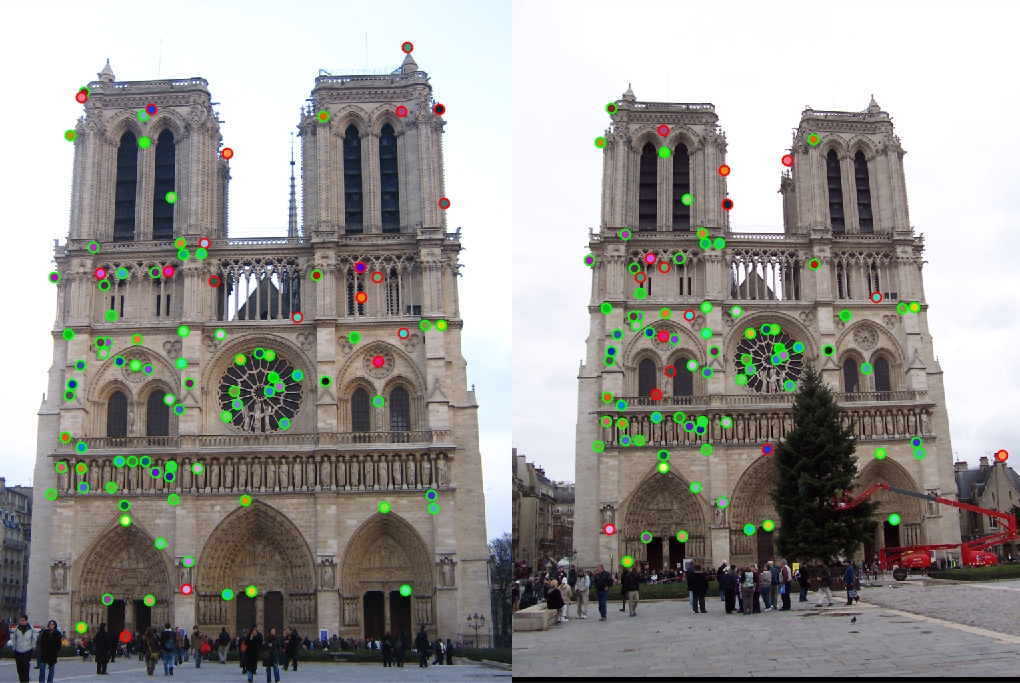
Patches with large contrast changes i.e. gradients are easier to localize than textureless patches. Corners have large contrast changes in all direction and hence serve as points of interest when detecting similarities between two images. The Harris Corner Detector is used to detect the points of interest. We start by bluring the images to smoothen out the image intensity. We then convoluate the image with the derivates of the gaussian to find image gradients along the axes. We compute the auto-correlation function or surface i.e. comparing an image patch against itself to determine the stability of a metric w.r.t small variations in position. The non maxima suppresion helps in determining the local maxima. The effect of sliding window size and the alpha value were observed on the interest points. An adaptive non maximum supression function was implemeted (code snippet shown below) and the change in accuracy was observed. To use the adaptive non maximum separation, pass 1 as the thrid argument to the get_interest_points function
% Search for the pixels that have a corner strength larger than the pixels
% around it and larger than the average strength of the image.
for i = border+1:m-border
    for j = border+1:n-border
        a = harris(i,j);
        if (a>mean_himg)&&(a>=harris(i-1,j-1))&&(a>=harris(i-1,j))
        &&(a>=harris(i-1,j+1))&&(a>=harris(i,j-1))&&(a>=harris(i,j+1))
        &&(a>=harris(i+1,j-1))&&(a>=harris(i+1,j))&&(a>=harris(i+1,j+1))
            local_max(i,j)=1;
            value_local(k) = a;
            y_local(k) = i;
            x_local(k) = j;
            k = k+1;
        end
    end
end
y_local(k:end) = [];
x_local(k:end) = [];
value_local(k:end) = [];
num_local_pts = length(x_local);


r = zeros(num_local_pts,1);
for k=1:num_local_pts
    % For each pixel, find other pixels that have a larger score than this
    % pixel
    r_ids = y_local(k);
    c_ids = x_local(k);
    y_ij = y_local(value_local > harris(r_ids, c_ids));
    x_ij = x_local(value_local > harris(r_ids, c_ids));

    % Find the nearest pixel with larger score
    if size(y_ij,1)>=3
        dt = delaunayTriangulation (x_ij,y_ij);
        [pi, r(k)] = nearestNeighbor(dt, [c_ids r_ids]);
    elseif size(y_ij,1)==0
        r(k) = max(m,n);
    else
        r(k) = sqrt(max((x_ij-c_ids).^2+(y_ij-r_ids).^2));
    end
end
Local Feature Description
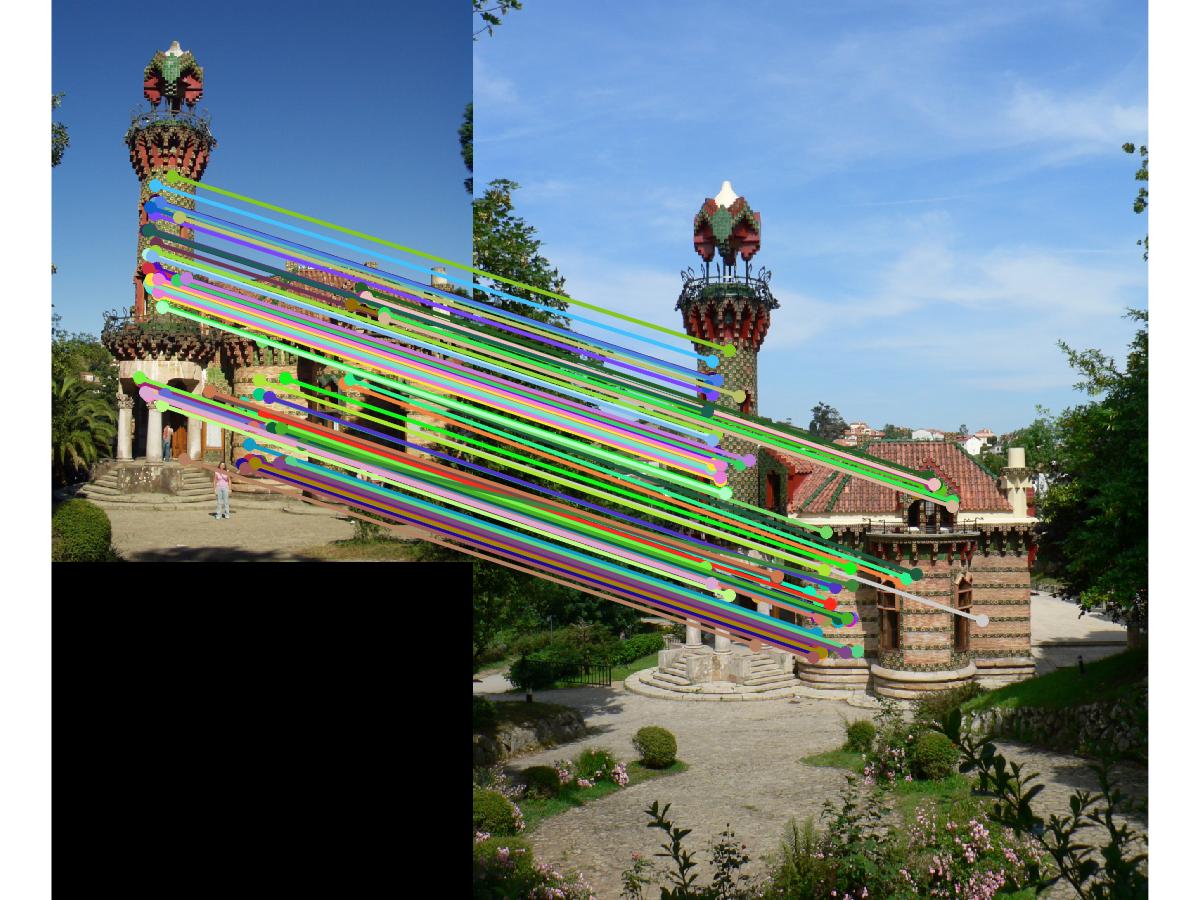
SIFT features were used as local feature descriptors. The SIFT featues were formed by computing the gradient at each pixel in a 16x16 window around the detected interest point. A 8 bin gradient orientation histogram is formed in each of the 4x4 quadrant to form a 128 SIFT descriptor vector. To further improve the results we normalize each of the feature vector by cliping all values greater than 0.2 to 0.2 and renormalize again. This makes the feature description vector robust to other photometric variations. An adaptive non maxima supression is implemented which improved the accuracy for Episcopal Gaudi from 67% to 75%.
Matching features
The "ratio test" or "nearest neighbor distance ratio test" was used to map the local features between the two images. The nearest neighbour distance computed as the ratio of distance of first nearest neighbour and second nearest neighbour for a particular feature. We then sort all the distances in ascending order and divide the smallest value with the second smallest value. If the ratio is less than 0.8 its considered as a match else, its not a match.
Evaluation
The above SIFT pipeline was tested for the provided set of images and the accuracy of the pipeline was measured. Various free parameters like alpha, non maxima supression window, distance ratio threshold were varied and the effect on the accuracy was observed for the given set of images. The above pipeline was tested for images provided in the extra data folder as shown below

Results
| Correspondance between images | Accuracy |
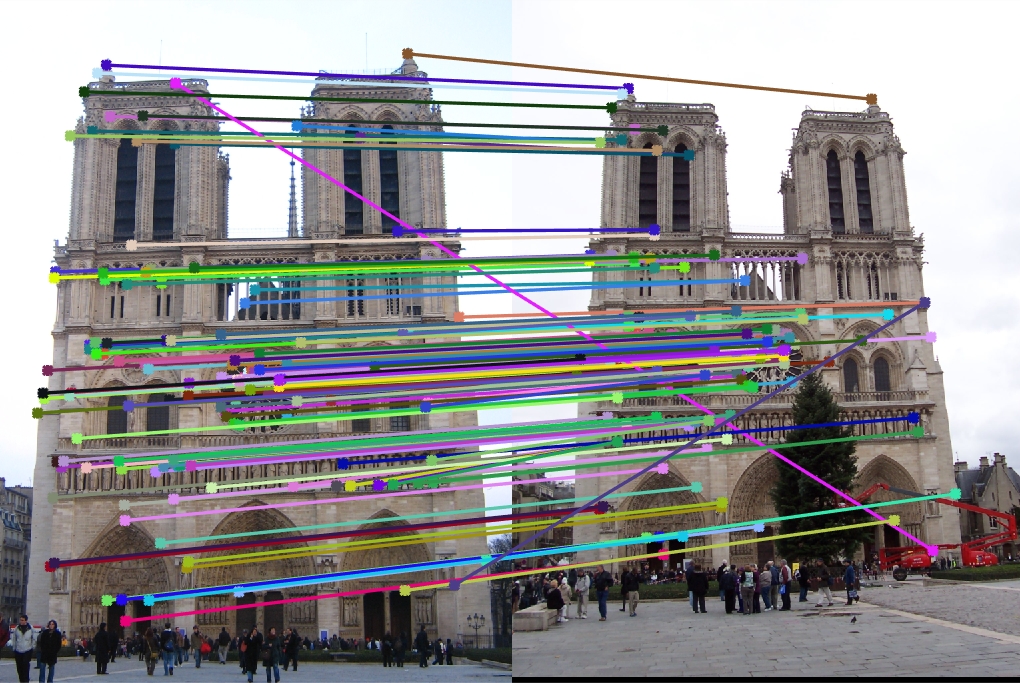 |
88% |
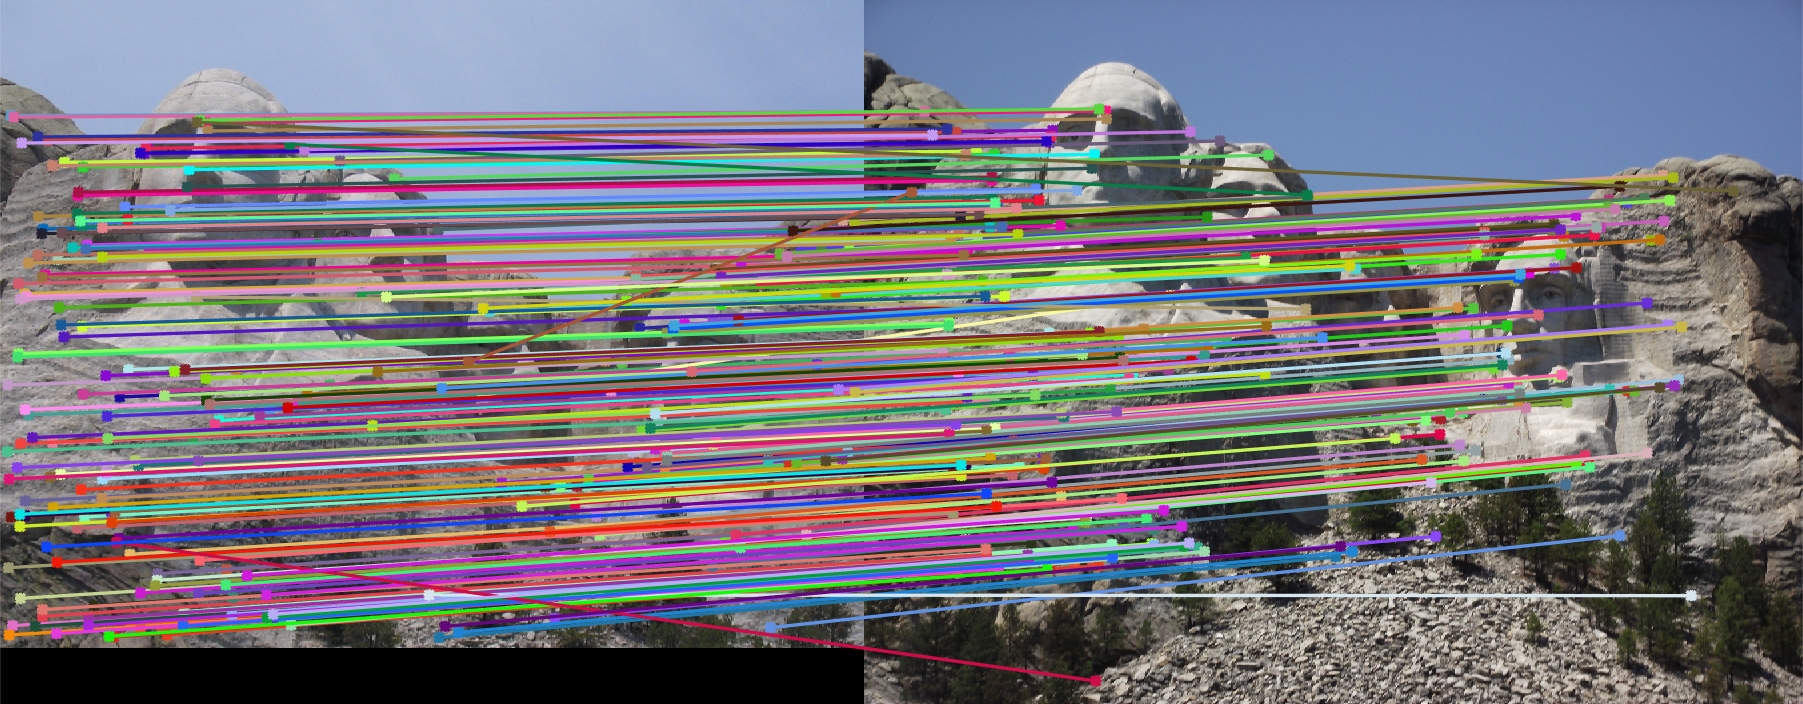 |
99% |
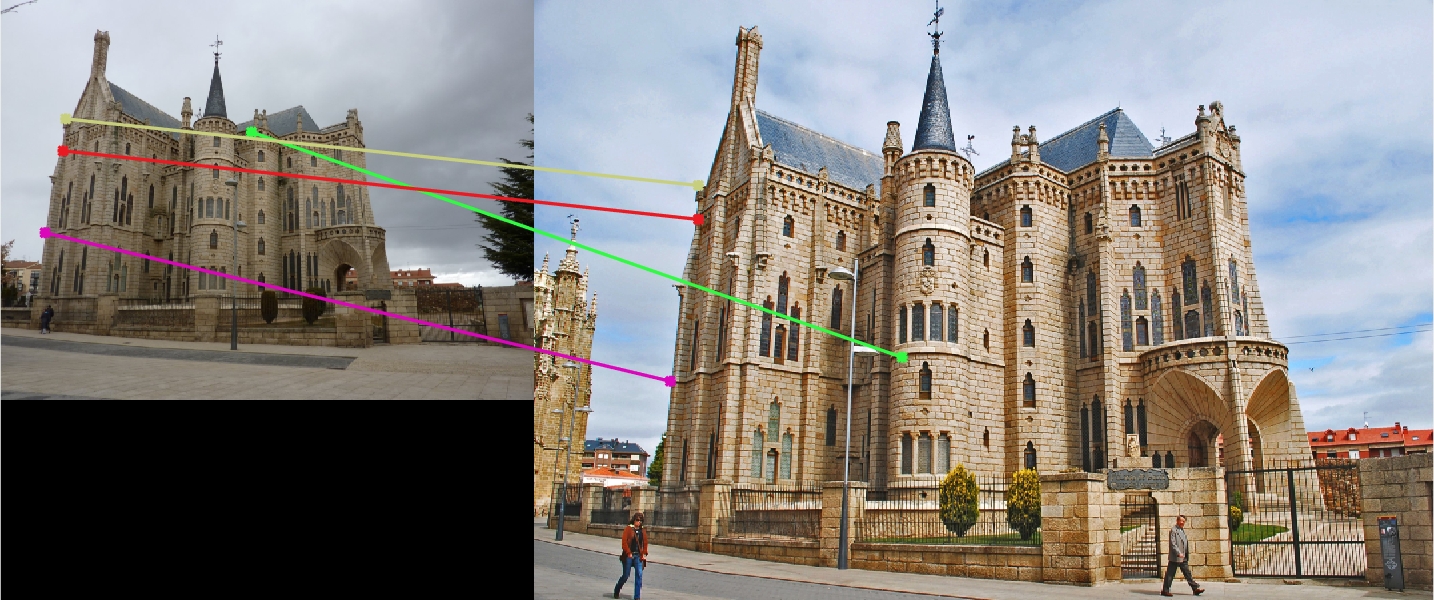 |
75% |
Concusion
The SIFT pipeline was optimised for the given three sets of images. The accuracy for Episcopal Gaudi was 67% when non adaptive non maximum supression method was used. On using adaptive non maximum separtion the accuracy was improved to 75%. On the other hand the accuracy for the other two images did not vary with the change in the non maximum speartion function. The above pipeline was tested on images provided in the extra dataset and a rough estimate of the accuracy was obtained. Thus a SIFT piepline was implemented and optimised for accuracy to detect similarities between given set of images