Project 2: Local Feature Matching
The goal of the project is to design a image matching algorithm that match two similar images. The matching pipe line is divided into three parts. First, we find the interesting points that are representative or more meaningful in the image. Second, we build up the feature descriptor around the interesting points. Then, we use the matching algorithm to find the best matches based on the feature descriptors.
Interest point detection
We applied Harris corner detector to find the interest points with high corner strength. The main idea is that for a qualified interest points(corner like), sliding the window in all directions should cause a large intensity change. After corner detection, I use Non-maximum Suppression, in which only points with maximal confidence in 3 by 3 sliding window could be kept, to further threshold the results.
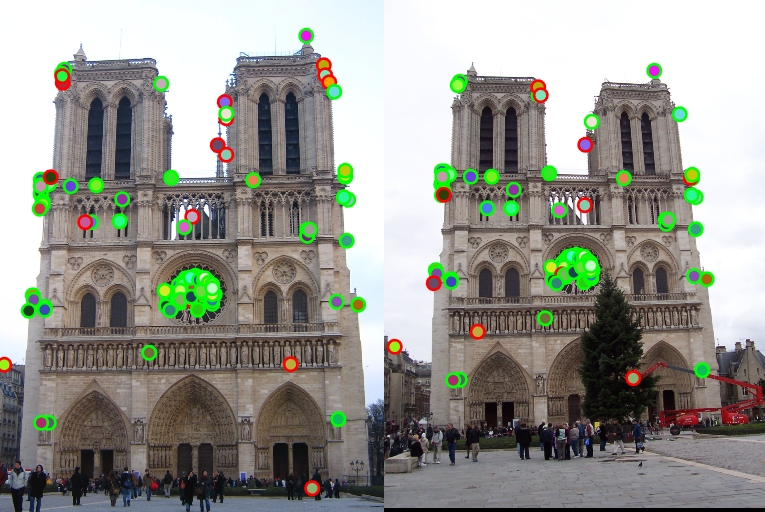
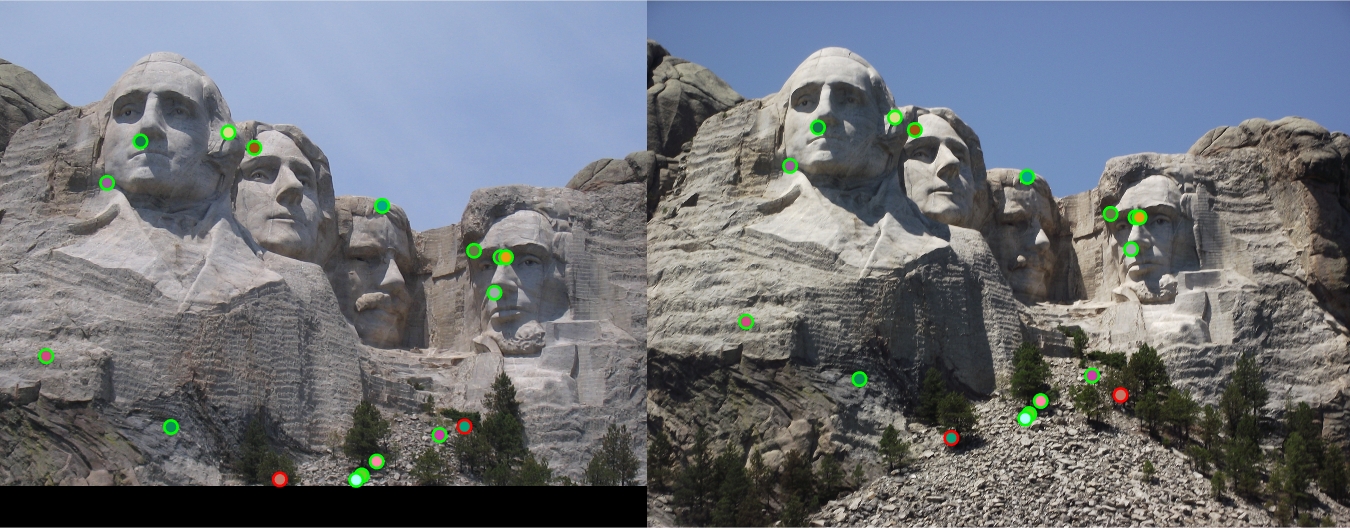
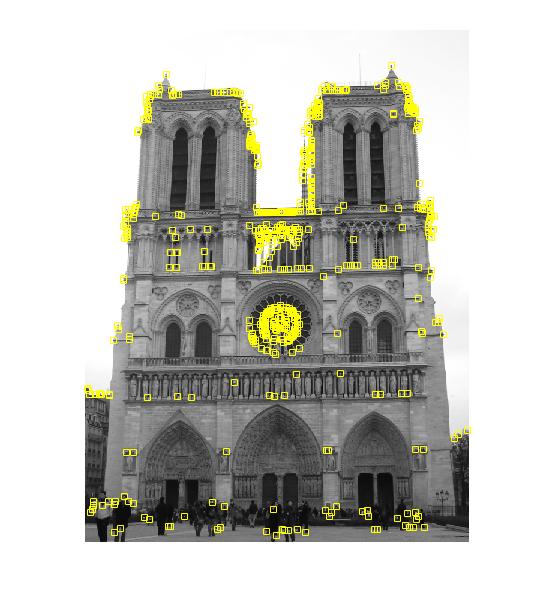 |
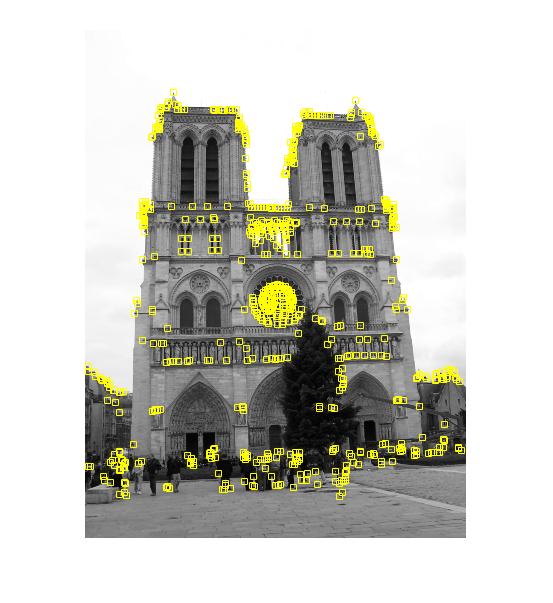 |
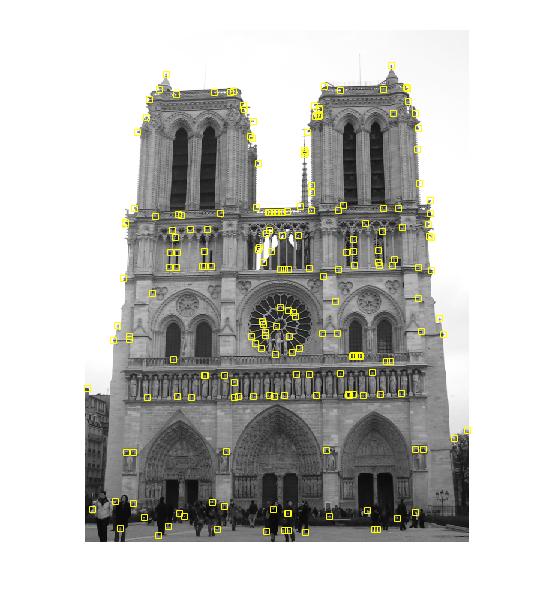
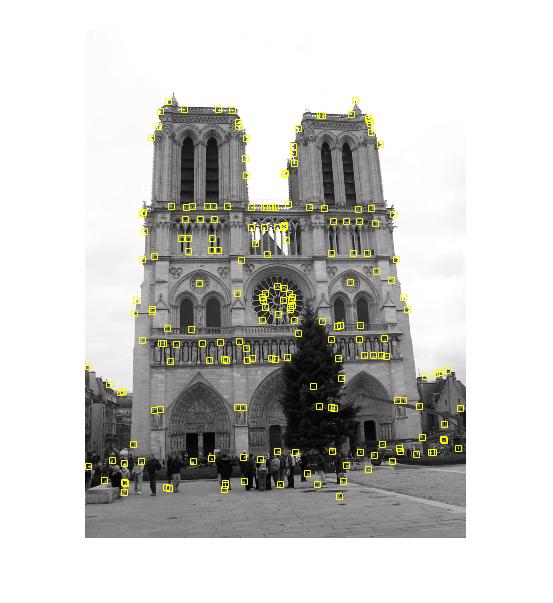
Figure 1.Detecting interest points of two matching images
Local feature description
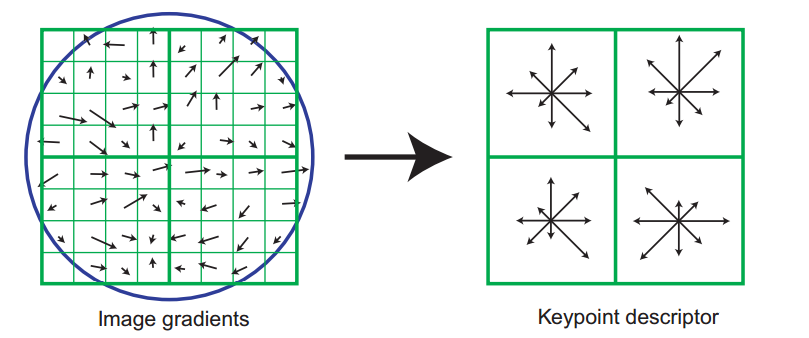
Features is a n by 128 matrix, where n is the number of interesting points. After getting Ix and Iy matrices, I loop through all the interesting points: first we extract the patch with size (feature_width + 1) by (feature_width + 1) that covers the interesting point and convolve its Ix and Iy maps with a gaussian filter. As a consequence, the points that close to the center will contribute more in the feature vector. Then for each pixel on this patch, their orientation and scale are computed by equation
\begin{equation} \begin{aligned} M(p) &= \sqrt{I_x^2(p) + I_y^2(p)}\\ O(p) &= atan2(\frac{I_y(p)}{I_x(p)}) \end{aligned} \end{equation}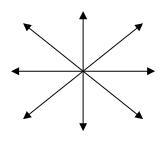
A gradient orientation histogram is then computed in each subregion. Each subregion has size with feature_width / 4 by feature_width / 4. In total there are 4 * 4 = 16 subregions. Because we count 8 directions, there are 16 * 8 = 128 entries for every feature.
For simplicity, I don't take into account of contributions from one subregion to other subregion. I just compute the 2 nearest orientation bins.
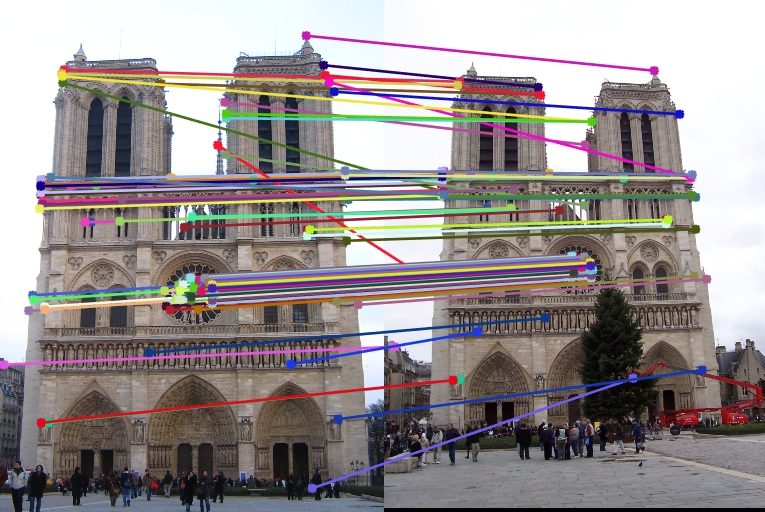
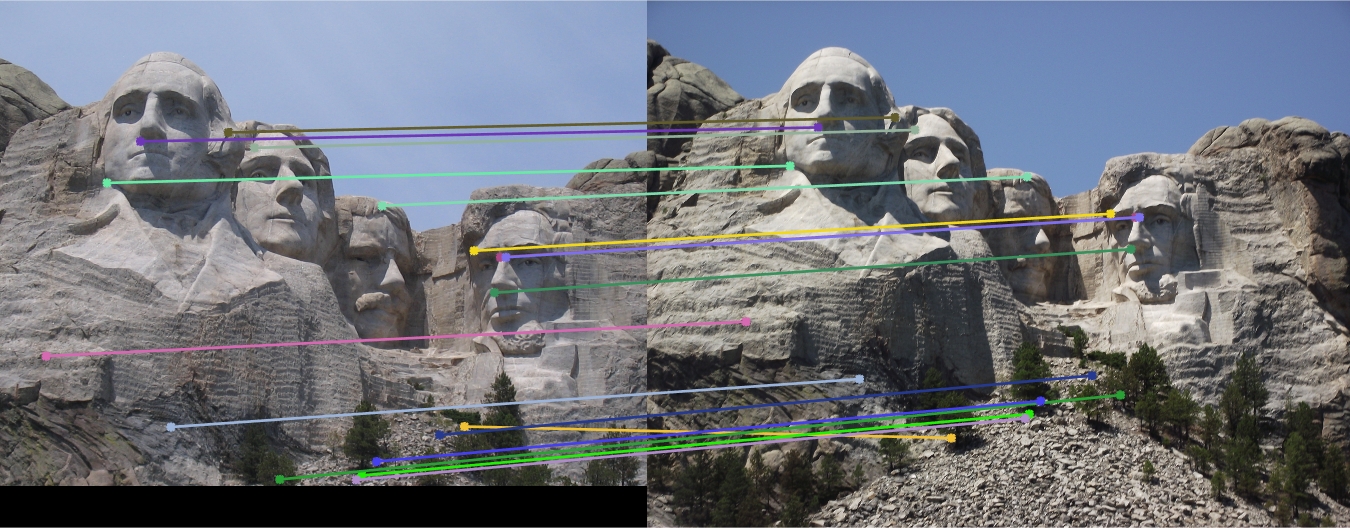
Feature matching
Once we have extracted features and their descriptors from two or more images, the next step is to establish some preliminary feature matches between these images. We can define this nearest neighbor distance ratio as \begin{equation} NNDR = \frac{d_1}{d_2} = \frac{\Vert D_A - D_B \Vert}{\Vert D_A - D_C \Vert} \end{equation}
Results
Notre Dame Cathedral
114 total good matches, 26 total bad matches. 81.43% accuracy
Mount Rushmore
15 total good matches, 2 total bad matches. 88.24% accuracy
Extra
Adaptive non-maximal suppression
While most feature detectors simply look for local maxima in the interest function, this can lead to an uneven distribution of feature points across the image, e.g., points will be denser in regions of higher contrast.To mitigate this problem, only detect features that are both local maxima and whose response value is significantly (10%) greater than that of all of its neighbors within a radius r
References
[1] D. G. Lowe. Distinctive image features from scale-invariant keypoints. International journal of computer vision, 2004.
[2] R. Szeliski. Computer vision: algorithms and applications. Springer, 2011.