Project 3: Camera Calibration and Fundamental Matrix Estimation with RANSAC
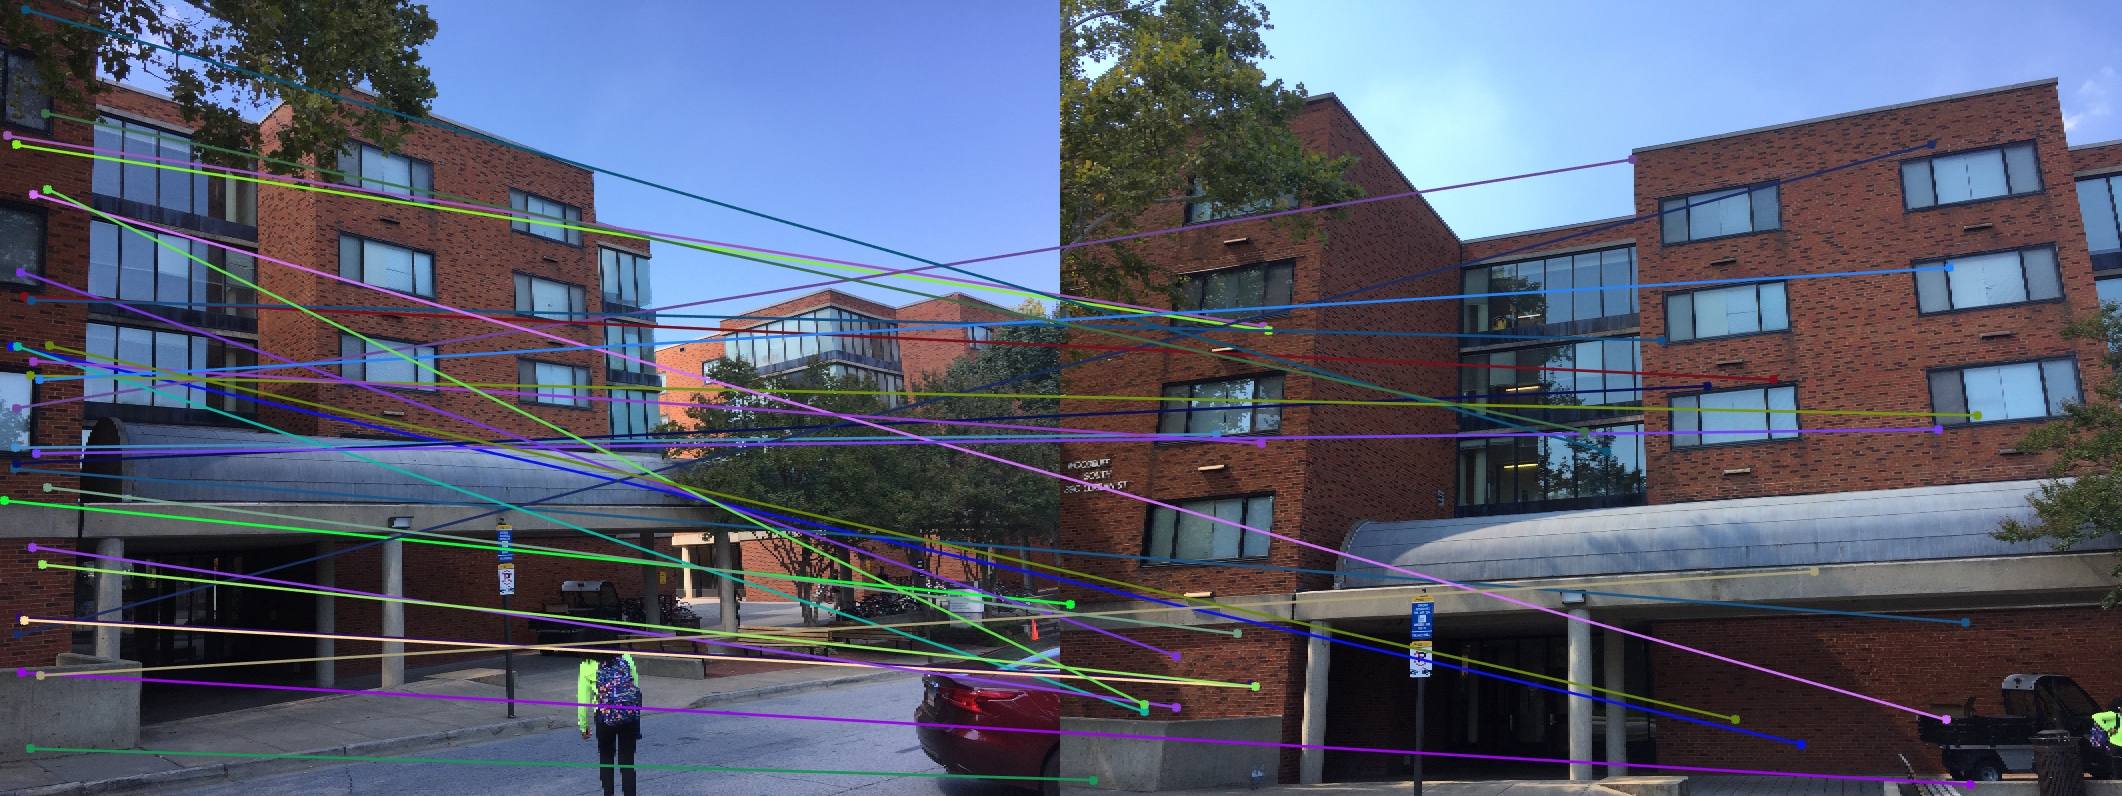
Feature matching without using epipolar lines.
The focus of this project was to improve feature matching between related images. Rather than going purely off comparing individual pixel data, we also factor in the relation between two stereo images. This is possible to factor in because the one thing that remains invariant across stereo images are straight lines. Angles and relative location may seem to change due to depth, but straight lines are always straight. Because of this, we can estimate the epipolar lines between images and use these lines to pick matching features with higher accuracy. The three main steps in this process are as follows:
- Camera Calibration
- Fundamental Matrix Calculation
- RANSAC
Camera calibration maps the 3d world coordinates to the 2d plane of the photo. The Fundamental Matrix is what maps the orientation from one image to the other, so this must be calculated. However, this is done based off of given feature matches, so we have to try a variety of Fundamental Matrices using RANSAC to find the best fitting one.
Camera Calibration: The Camera Projection Matrix
This step takes a set of 3d points, their corresponding 2d points, and calculates a projection matrix to convert from one to the other. The projection matrix is a combination of matrices which define the rotation, translation, skewing, compressing, and expanding of points in 3d real world space to show how they arrive at their 2d image locations. Although the projection is calculated as a whole, we are able to split it into these respective parts if we wish. One attribute we do take the time out to extract is the camera center. This can be used to improve the calculation of the Fundamental matrix in the next step.
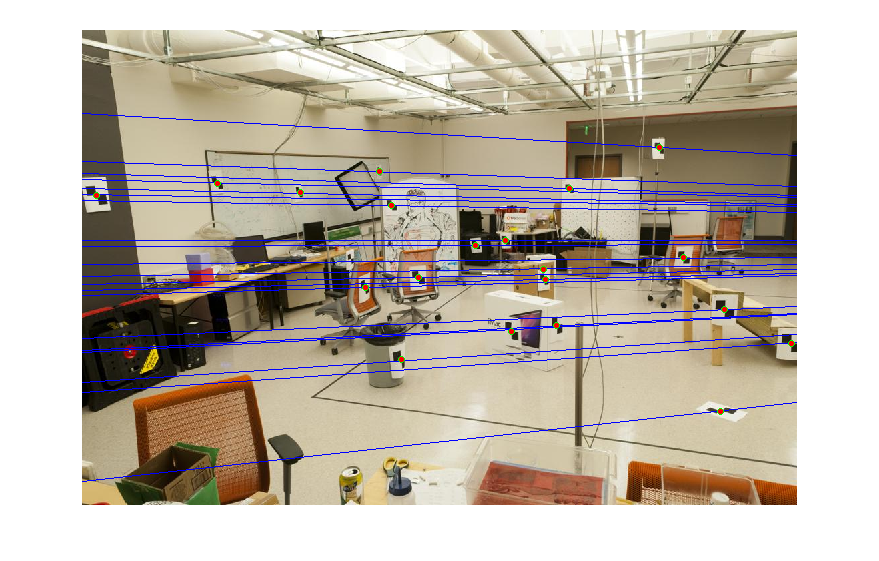
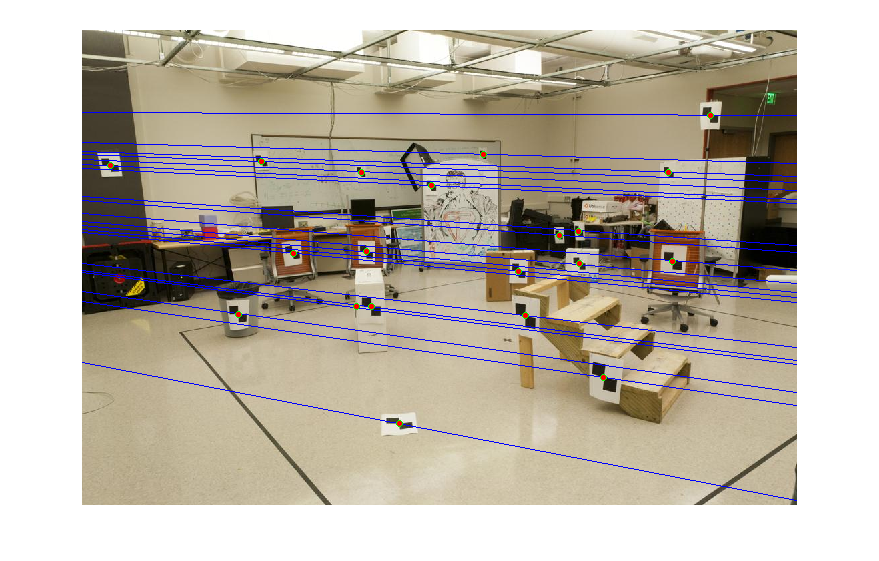
Fundamental Matrix Calculation
This process is similar to the previous step on a high level. Rather than calculating a map of 3d points to a 2d plane, we are calculating a map of points on one 2d image to another. This is a linear transformation, and so we can draw straight lines in one image which correspond to straight lines in the other. Ideally, all the features in one image that exist on one epipolar line should have their matching partners all located on the other image's corresponding line. Given a set of at least 8 matching features, we can calculate a Fundamental matrix to fulfil these requirements. The epipolar lines for a sample set of images are displayed.
|
Fundamental Matrix Estimation with RANSAC
While working the above step, we made one major assumption: all the given feature matches were correct. Most of the time, this won't be the case. That's where RANSAC comes into play. Given a set of feature matches that may or may not be correct, we randomly sample subsets of these matching features multiple times. Each time, we calculate a Fundamental matrix. With a set of possible Fundamental Matrices now at hand, we have to find the one which accepts the most feature matches. This involves defining a metric and threshold such that once we apply each Fundamental Matrix, we can determine how many inlier and outlier sets of matching points there are. The matrix with the most inliers becomes the one we choose, and all the inliers to this matrix are the matching features we pass on. We have to be careful how we define our threshold. We don't to accept too many points as inliers or reject too many points as outliers for fear of choosing a subpar matrix. We have to find the perfect balance between accepting false positives and rejecting false negatives.
RANSAC code
A portion of the RANSAC code I wrote is displayed below. I run through and randomly select groups of 8 matching pairs to test. The real differentiating factor here is my threshold. The number of overall iterations of sampling also matters to a certain extent (increasing your chances of picking good points), but the threshold is what will really change results.
len = size(matches_a,1);
for i = 1:100
    ind = randsample(len,8);
    FM = estimate_fundamental_matrix(matches_a(ind,:),matches_b(ind,:));
    test = zeros(len,1);
    for j=1:len
        test(j) = [matches_b(j,:) 1] * FM * [matches_a(j,:) 1]';
    end
    inliers = abs(test) < threshold;
    if sum(inliers) > sum(bestInliers)
        bestInliers = inliers;
        Best_Fmatrix = FM;
    end
end
inliers_a = matches_a(bestInliers,:);
inliers_b = matches_b(bestInliers,:);
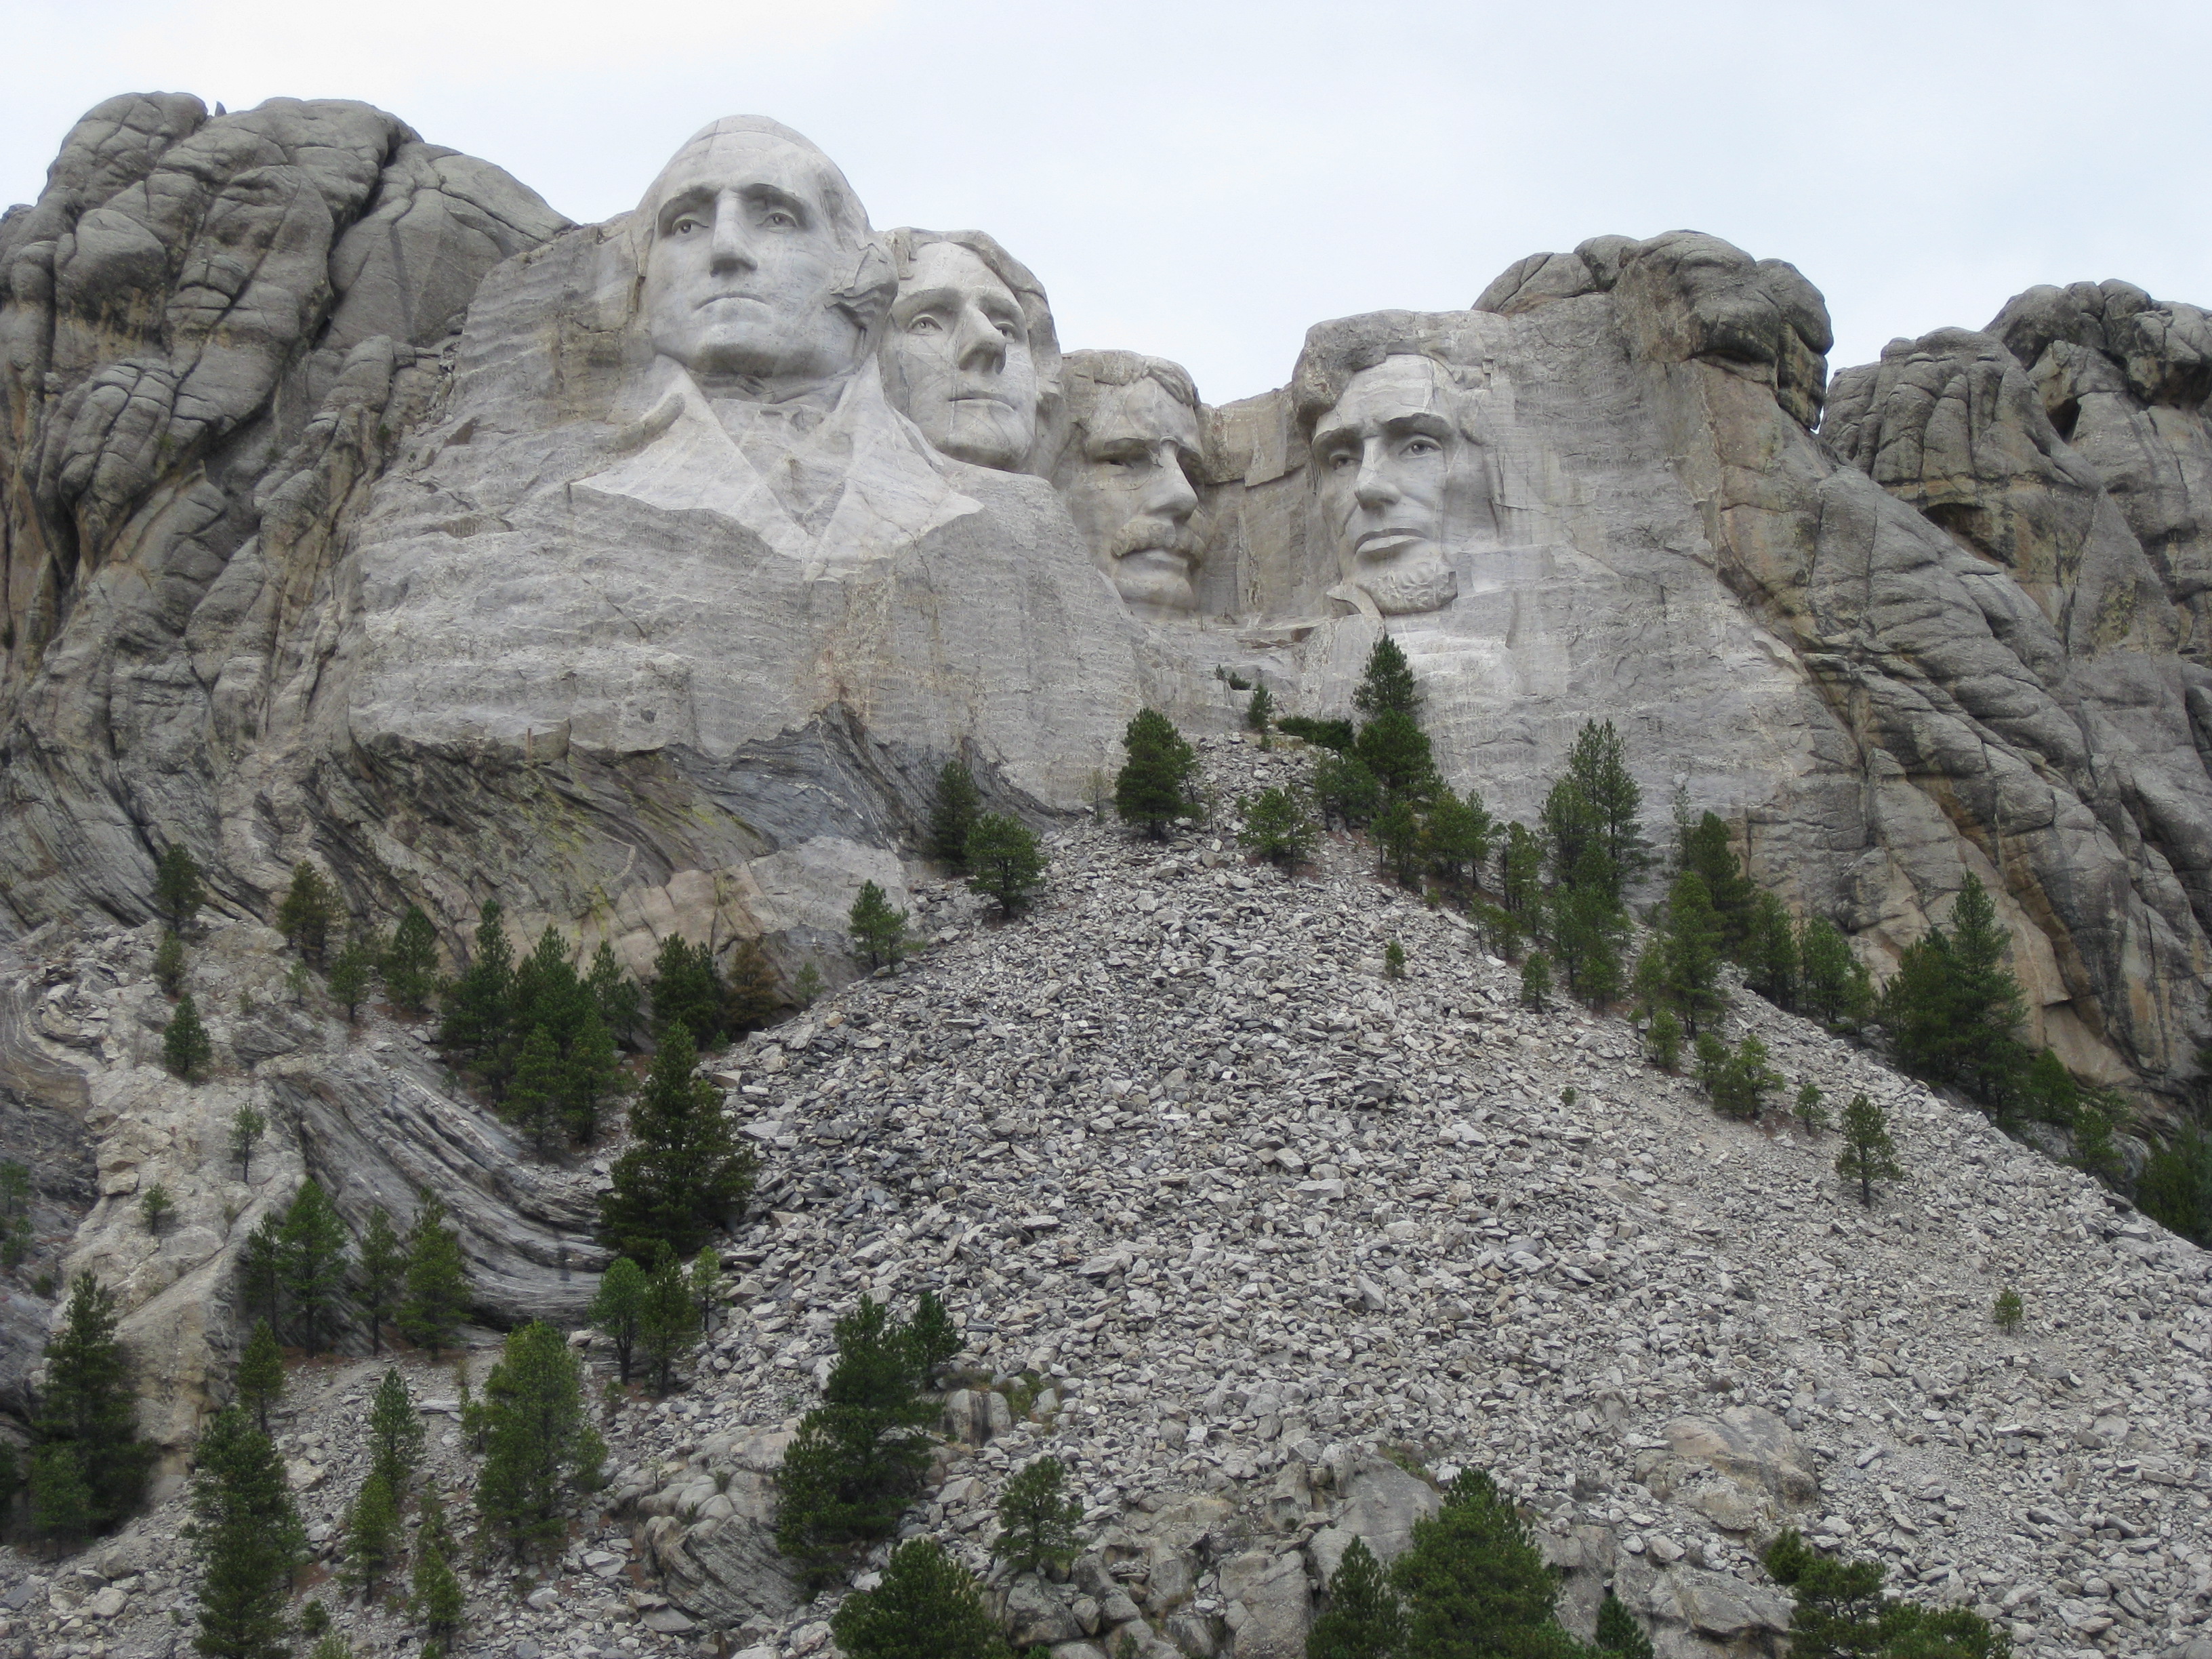
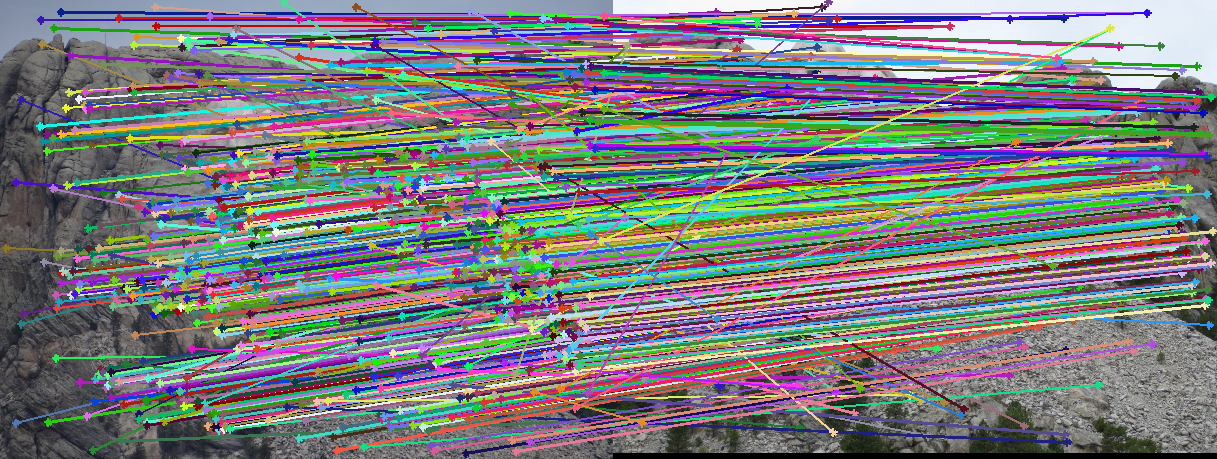
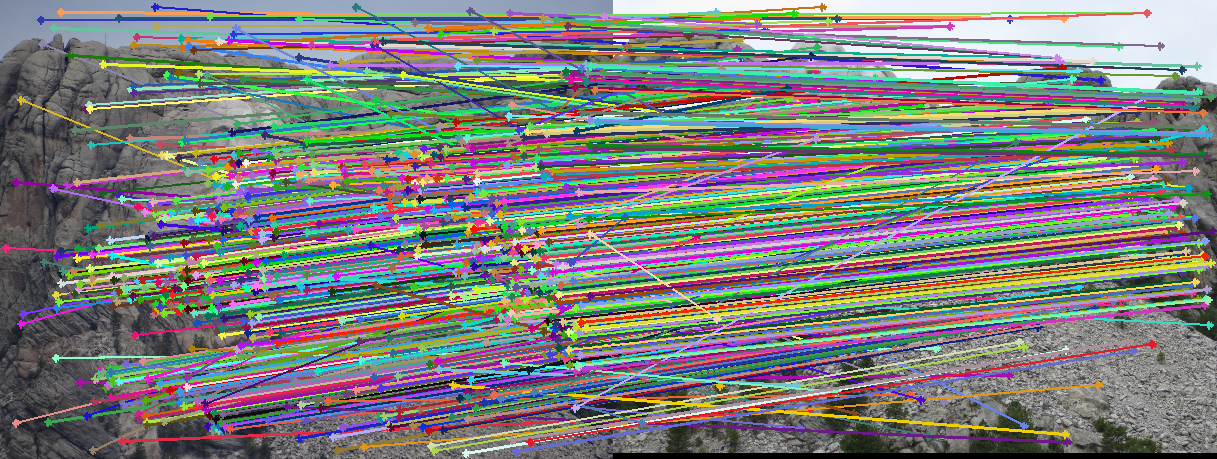
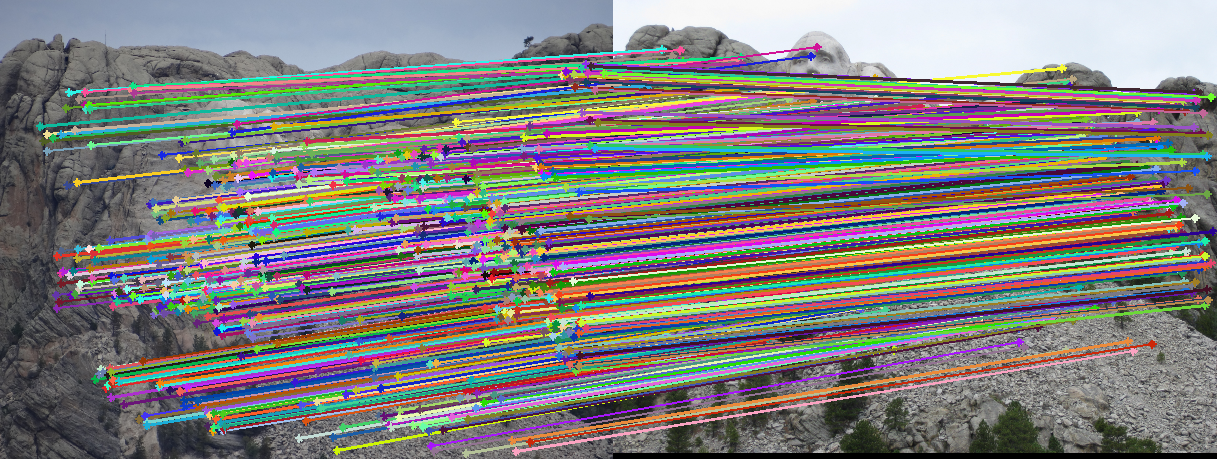
Matches over decreasing thresholds
|
|
|
|
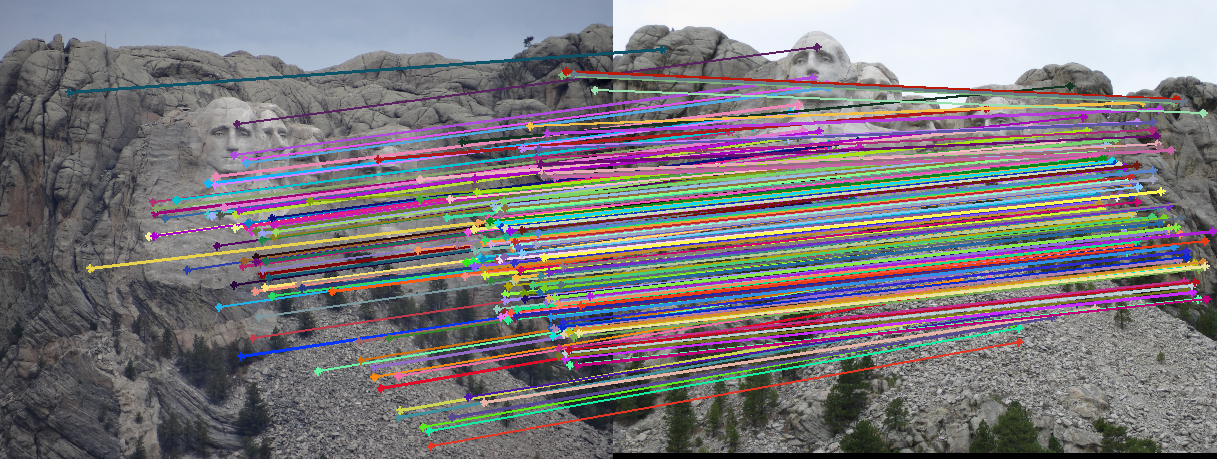
We can see the progression as we go down. The first row are the original images. The second row shows all feature matches generated by SIFT. The rest are thresholds of 0.5, 0.15, and 0.01 respectively. As we can see, 0.5 is too lenient allowing many false matches through. However, 0.01 is too strict, cutting out many good matches. 0.15 is a good middle ground, accepting plenty of good matches.