Project 3 / Camera Calibration and Fundamental Matrix Estimation with RANSAC
The project aims at estimating the camera projection matrix, that maps 3D world coordinates to image coordinates. It also requires evaluating a fundamental matrix that relates points in one scene to epipolar lines in another. The project is divided into 4 parts as follows:
- Compute Camera Projection Matrix
- Estimate Fundamental Matrix
- Compute Fundamental Matrix with RANSAC using unreliable points correspondences using SIFT
- Repeat the above task by normalizing the coordinates
1. Camera Calibration
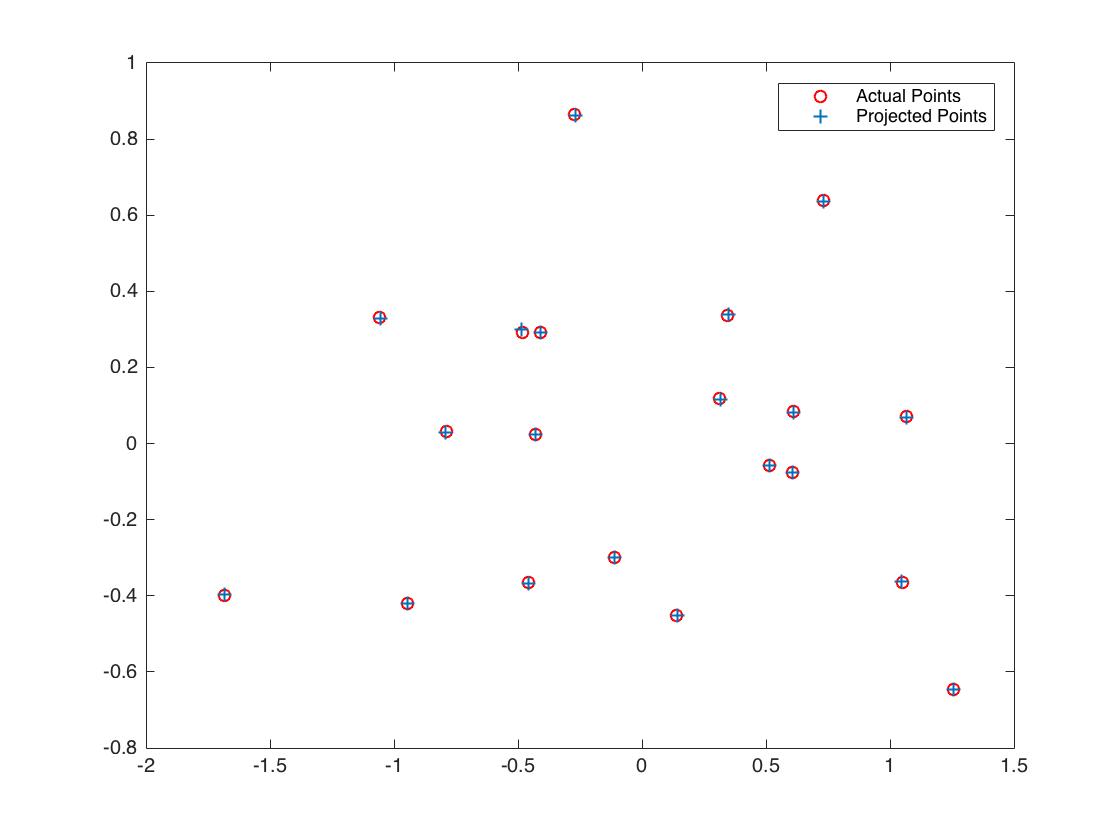
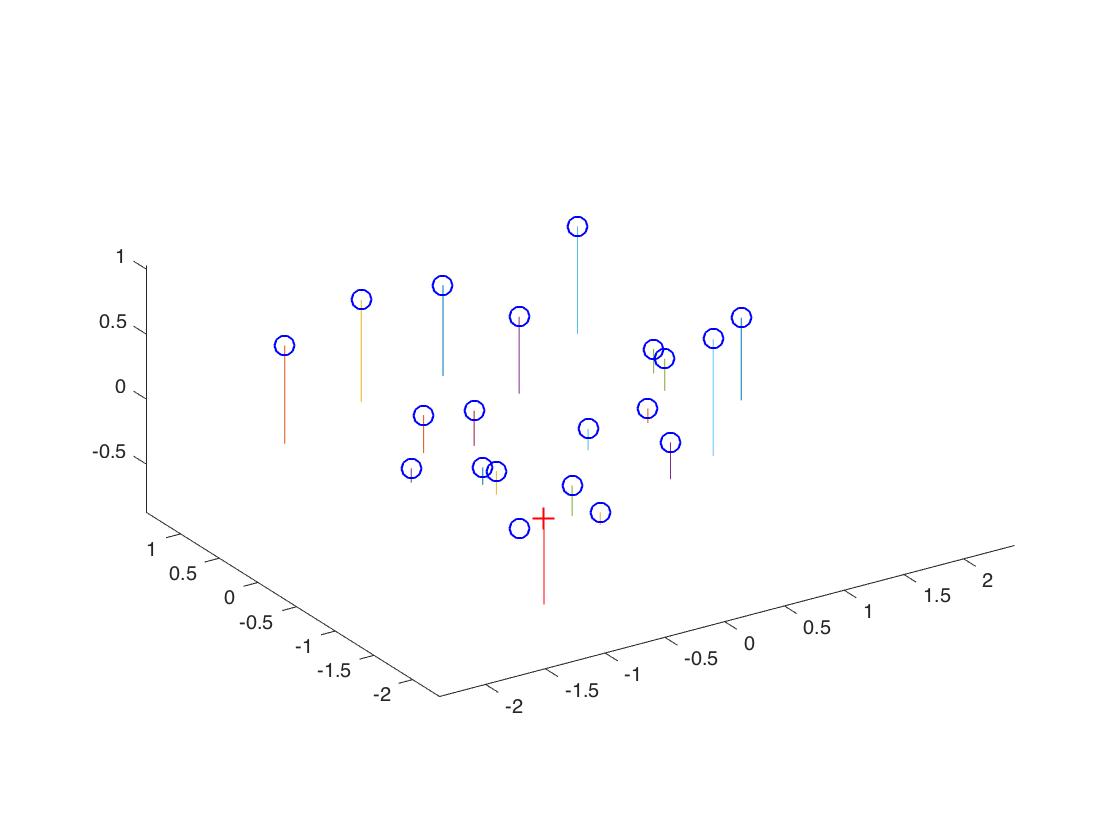
This part focusses on estimating the projection matrix, say M, of dimensions 3x4 which is the product of matrices representing intrinsic and extrinsic parameters that project 3D points to image points. For this part, the 3D points and their corresponding points are known. These points provide a homogeneous linear system which can be solved for M using linear least squares. Matlab function SVD is used to get the M matrix. Camera Center (C) is the world coordinates are also estimated from computed M. The total residual between the projected 2D image points and actual image points is also calculated which turned out be very small.
The projection matrix M is :
| 0.4583 | -0.2947 | -0.0140 | 0.0040 |
| -0.0509 | -0.0546 | -0.5411 | -0.0524 |
| 0.1090 | 0.1783 | -0.0443 | 0.5968 |
The total residual is: 0.0445
Camera Center in world Coordinates: (-1.5127, -2.3517, 0.2826)
Projected Vs Actual 2D points |
3D location of Camera |
 |
|
2. Fundamental Matrix Estimation
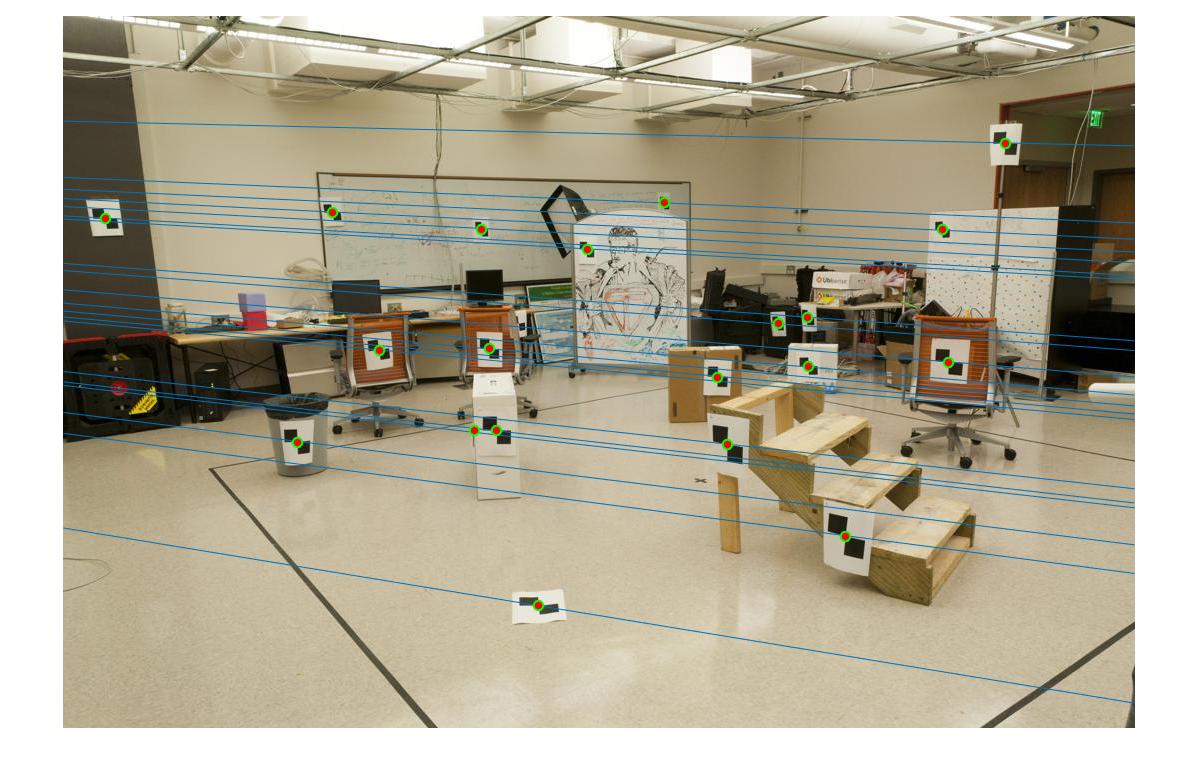
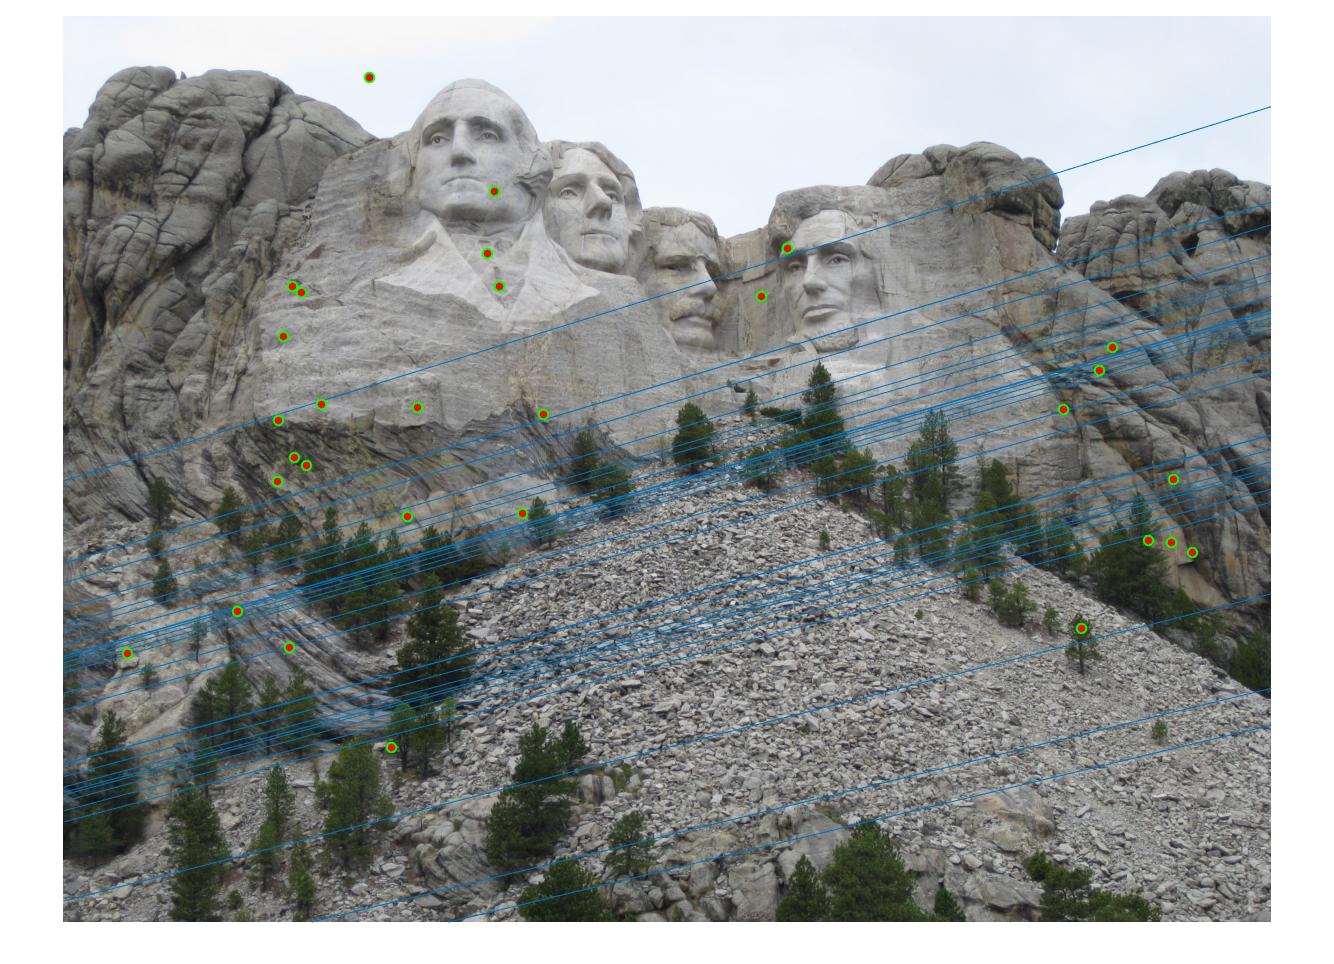
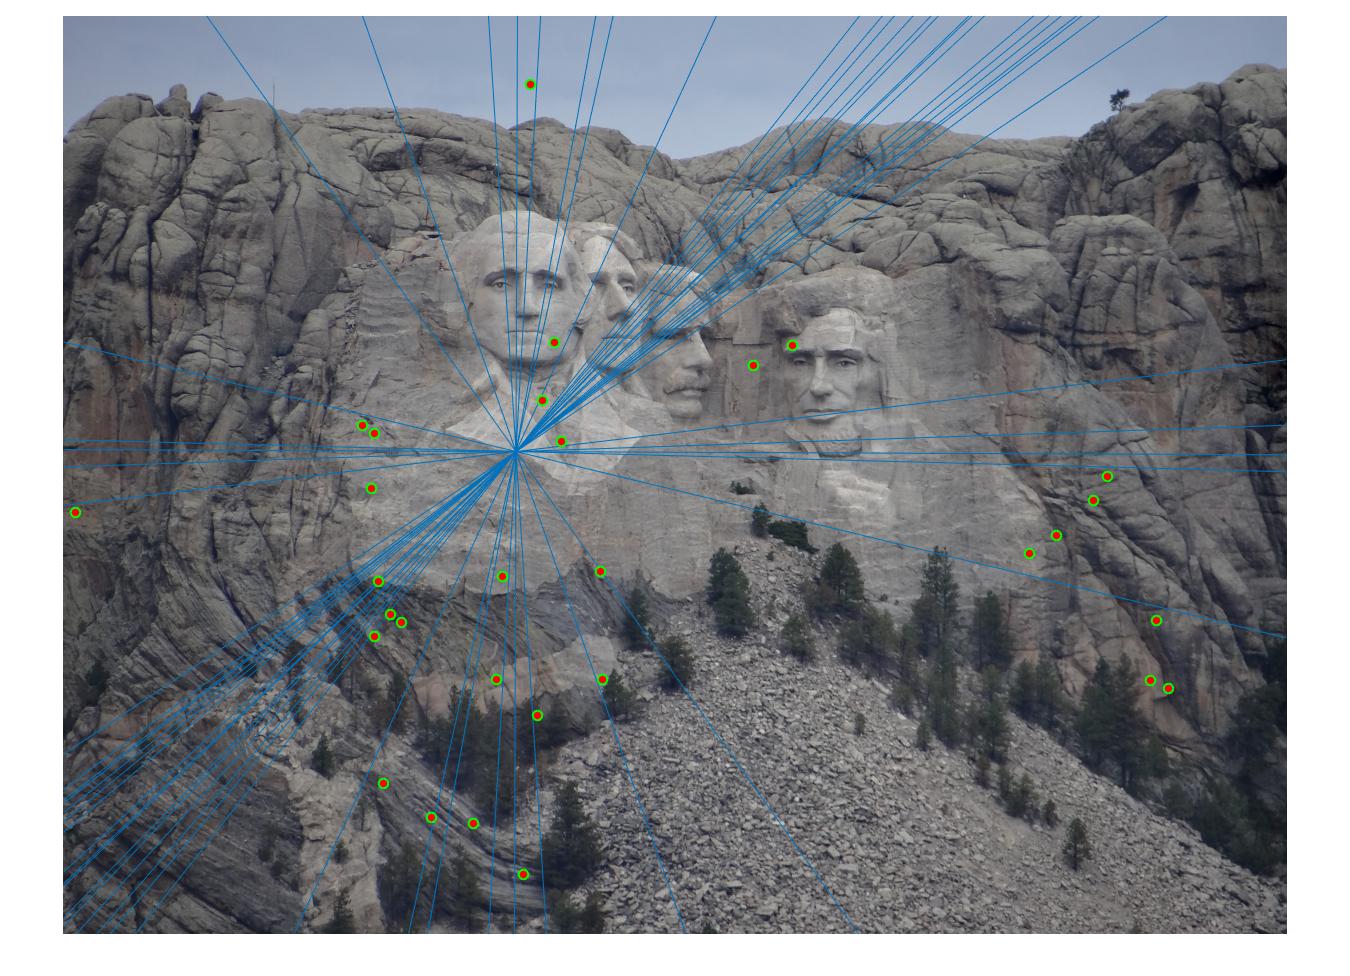
Fundamental Matrix (F) is computed which is used to map points in one image to epipolar lines in another. 8-points algorithm is used for estimation which derived least square solutions using SVD on equations from 8 pairs of correspondences, with a constrain of det(F)=0 using SVD on F. In the figures below, epipolar lines are plotted on the image pair.
Epipolar lines using Fundamental Matrix

|
Epipolar lines using Fundamental Matrix after normalization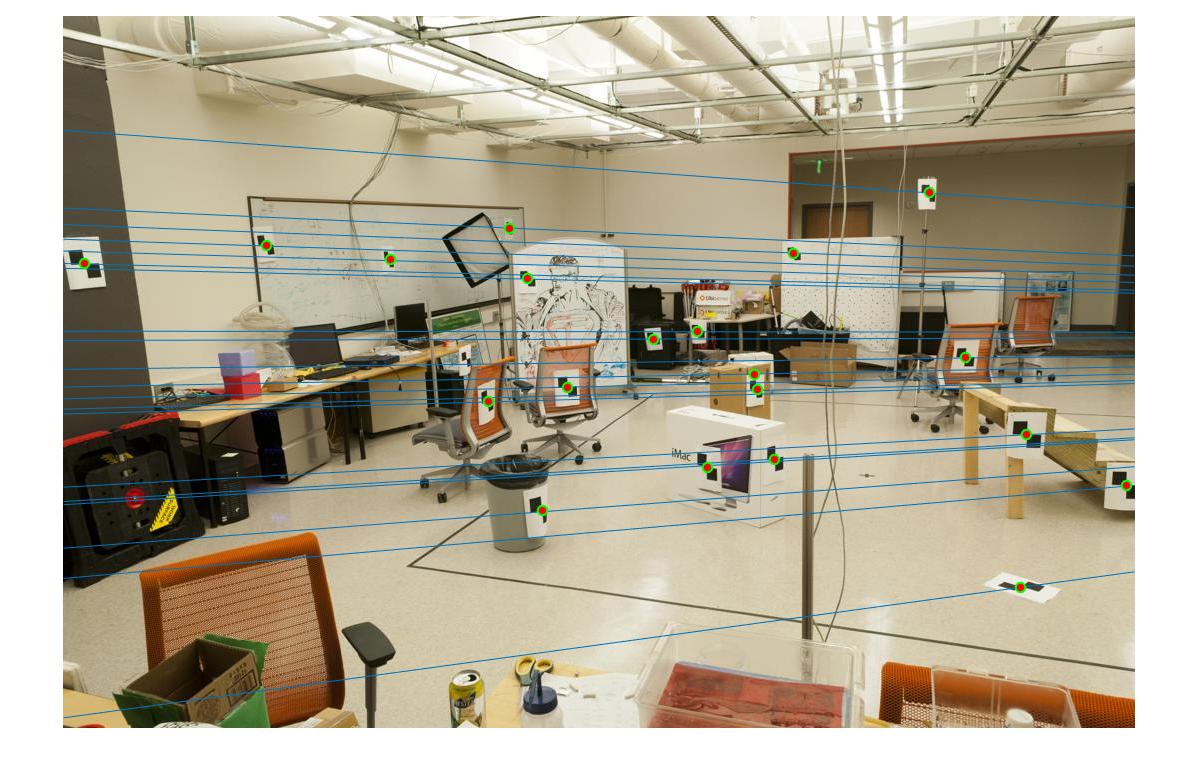
|
3. Fundamental Matrix Estimation with RANSAC
For this part, we combined RANSAC with the Fundamental Matrix computation in order to get the improved Fundamental Matrix. In this, matrix is computed with unreliable point correspondences computed with SIFT. SIFT features were obtained using VLFeat library package. Using 8-point algorithm, different fundamental matrices were computed. Using a distance metric based on fundamental matrix, the matrix that gave maximum number of inliers was chosen. Ran the experiment with different number of iterations of RANSAC and changed the threshold values simultaneously and the best combination of both was picked up.
Epipolar lines for Mount Rushmore without normalization (threshold = 0.5)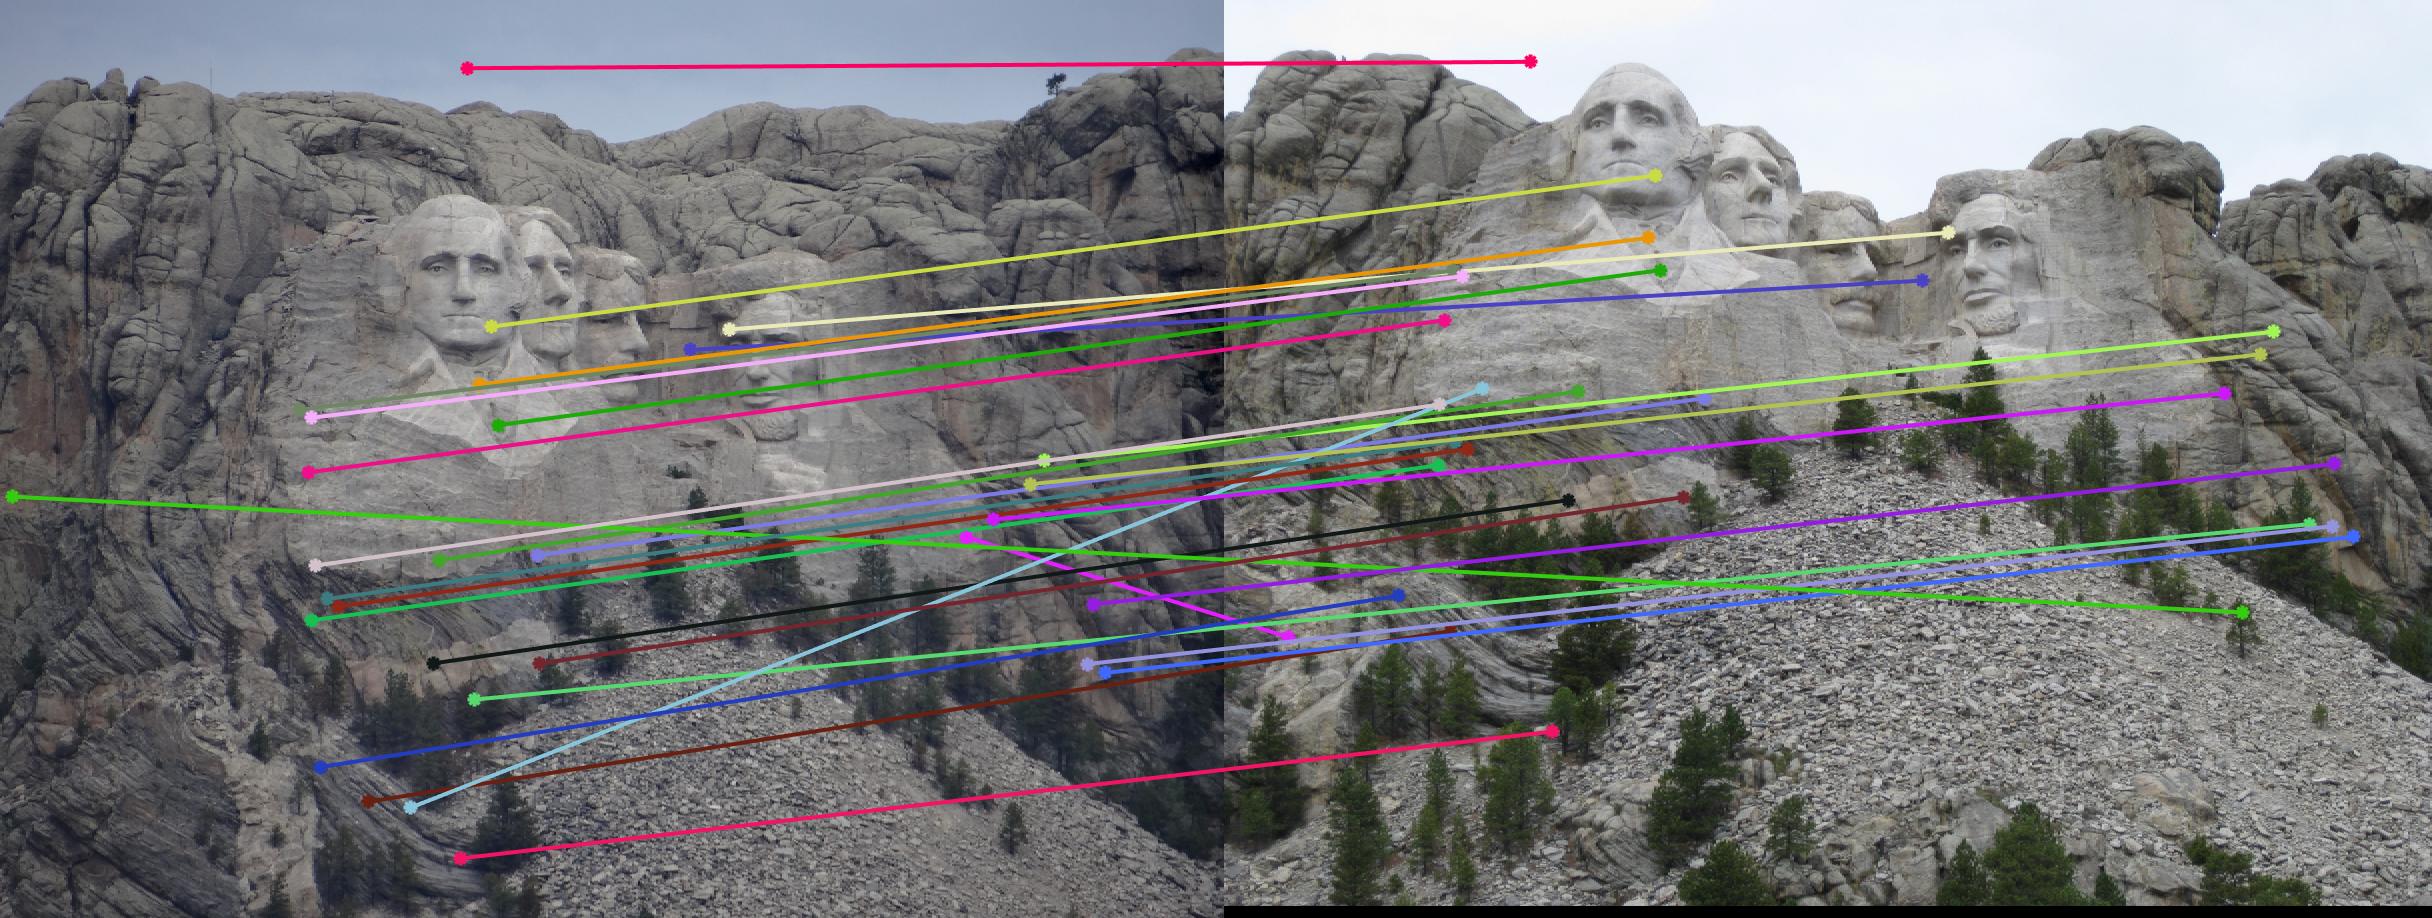
|
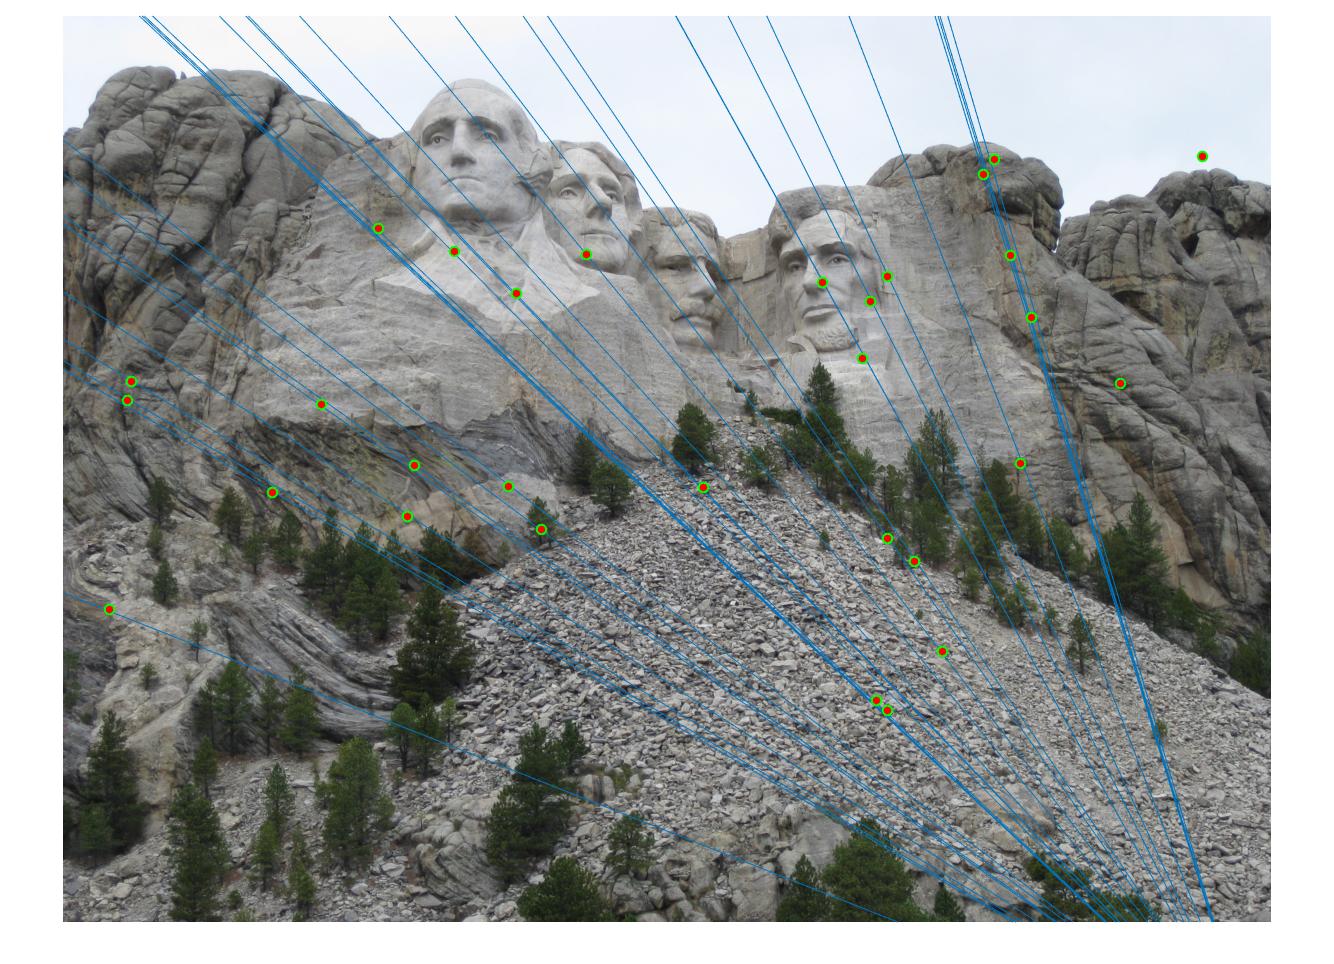
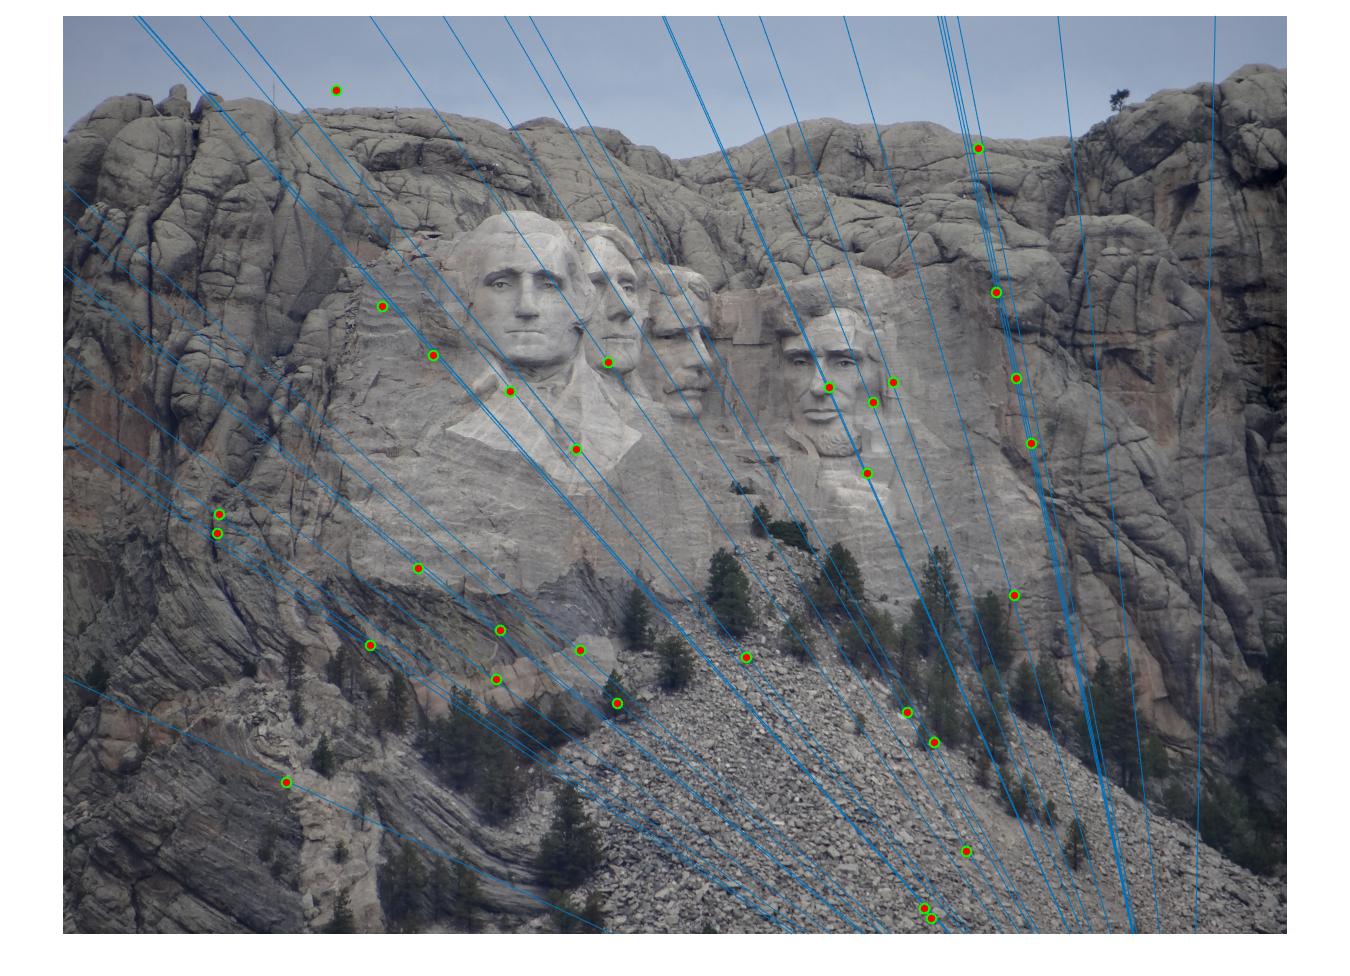
Epipolar lines for Mount Rushmore without normalization (threshold = 0.05)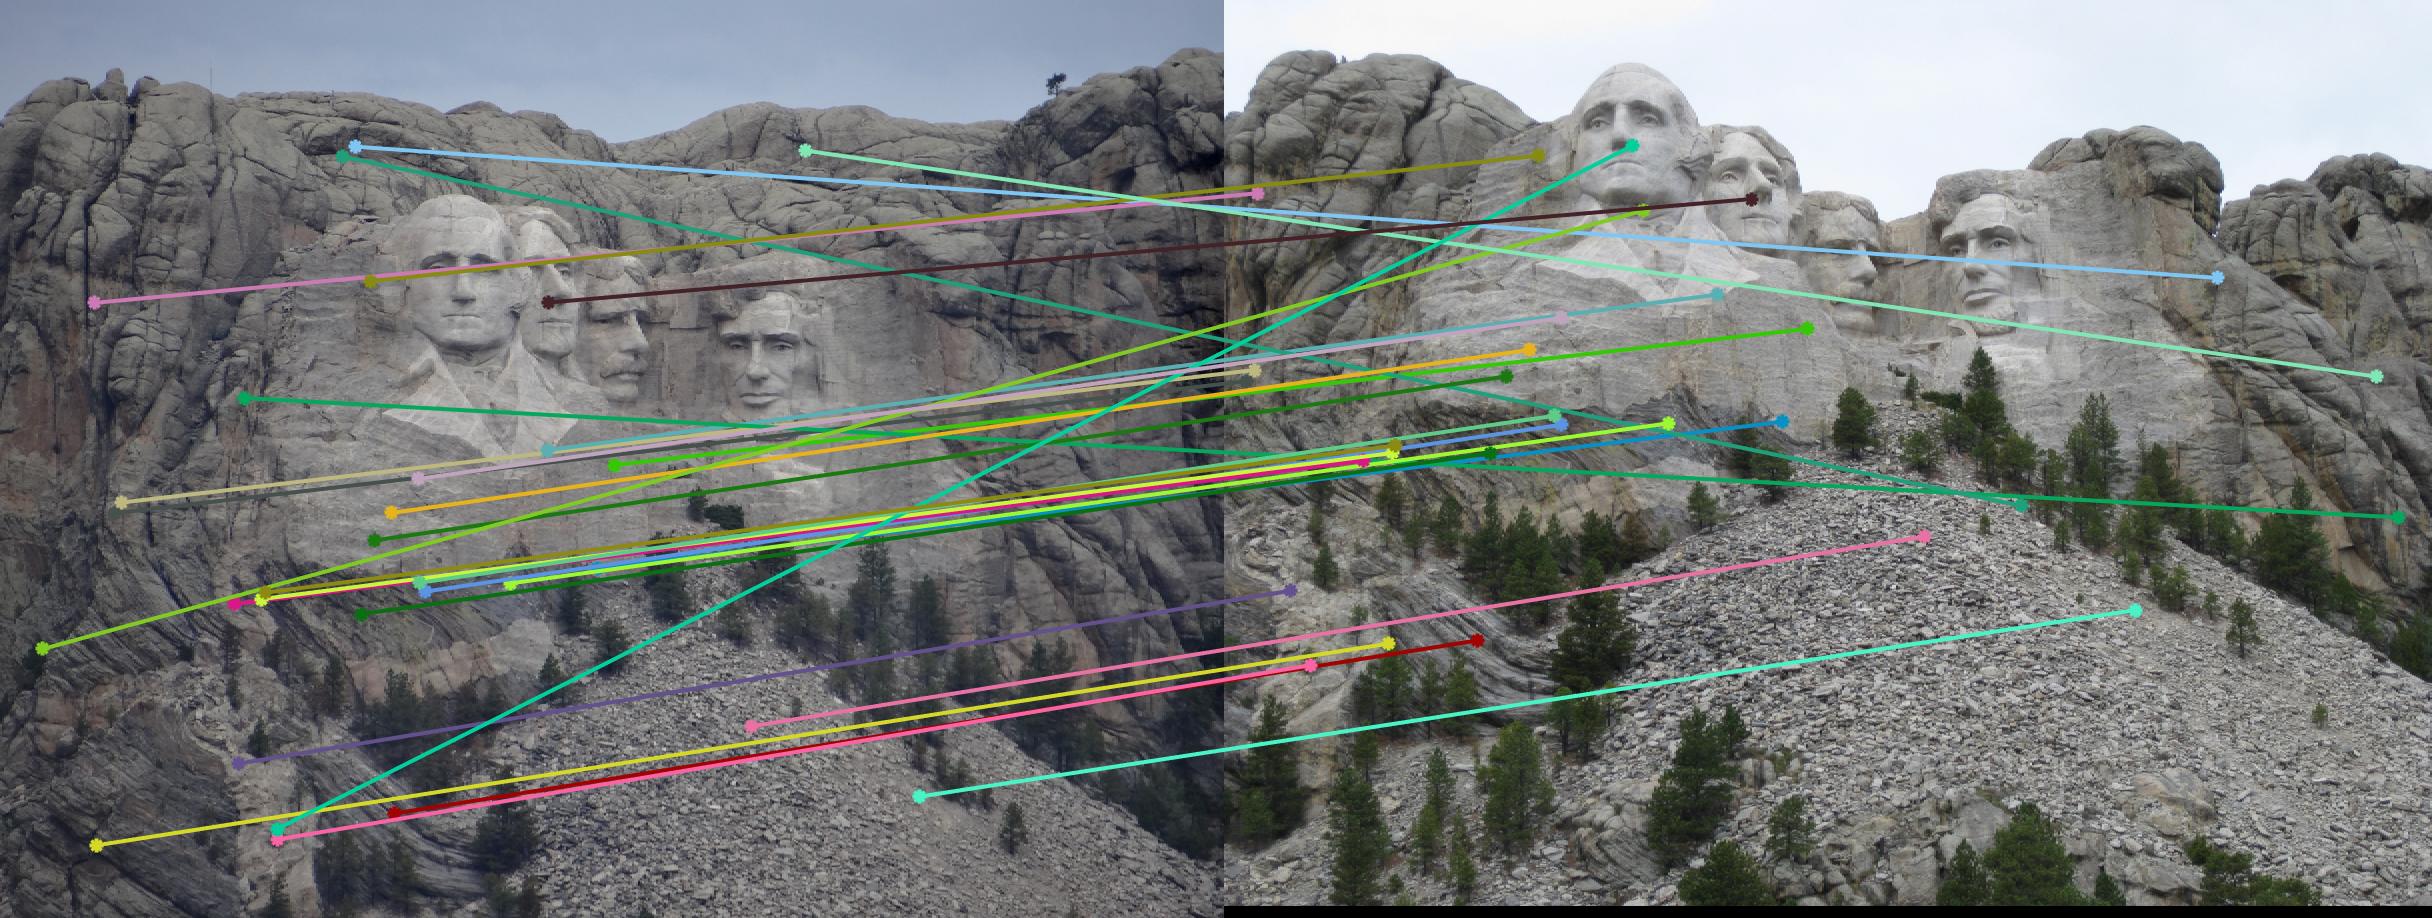
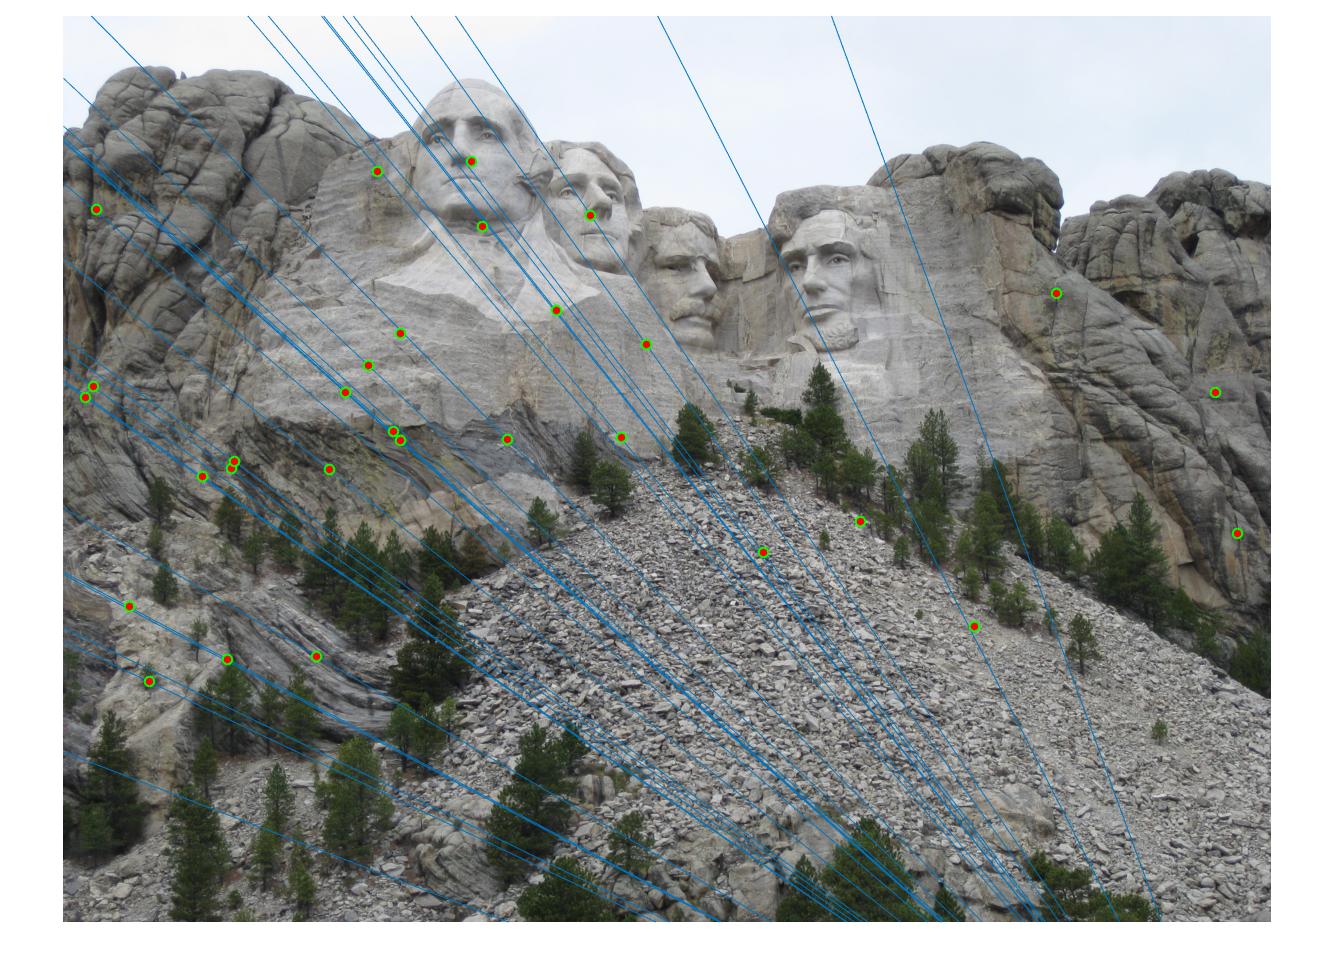
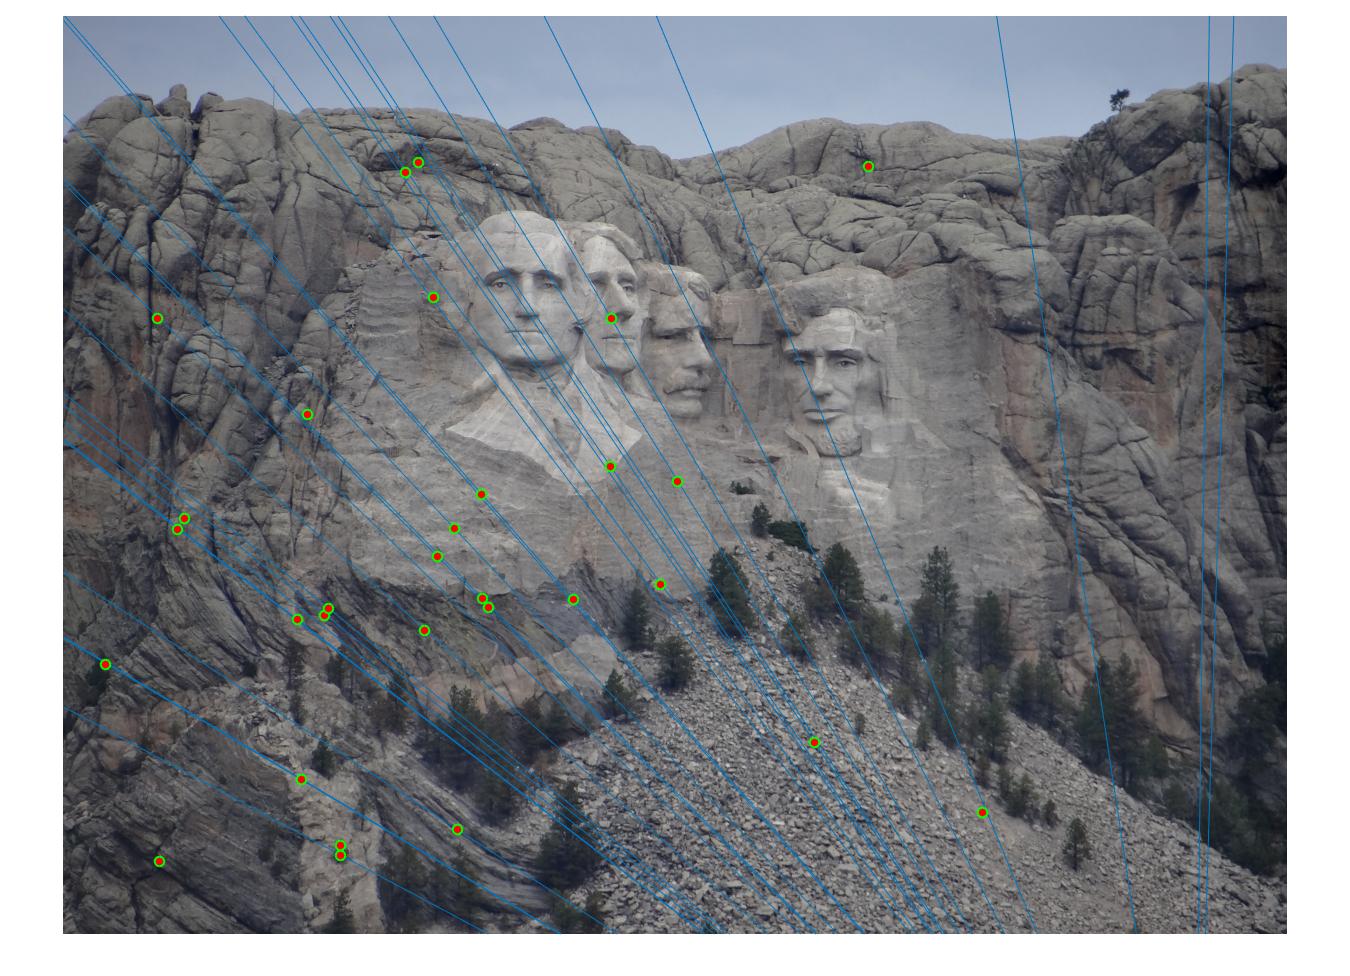
|
It can be seen that by changing the threshold, better results were obtained for Mount Rushmore
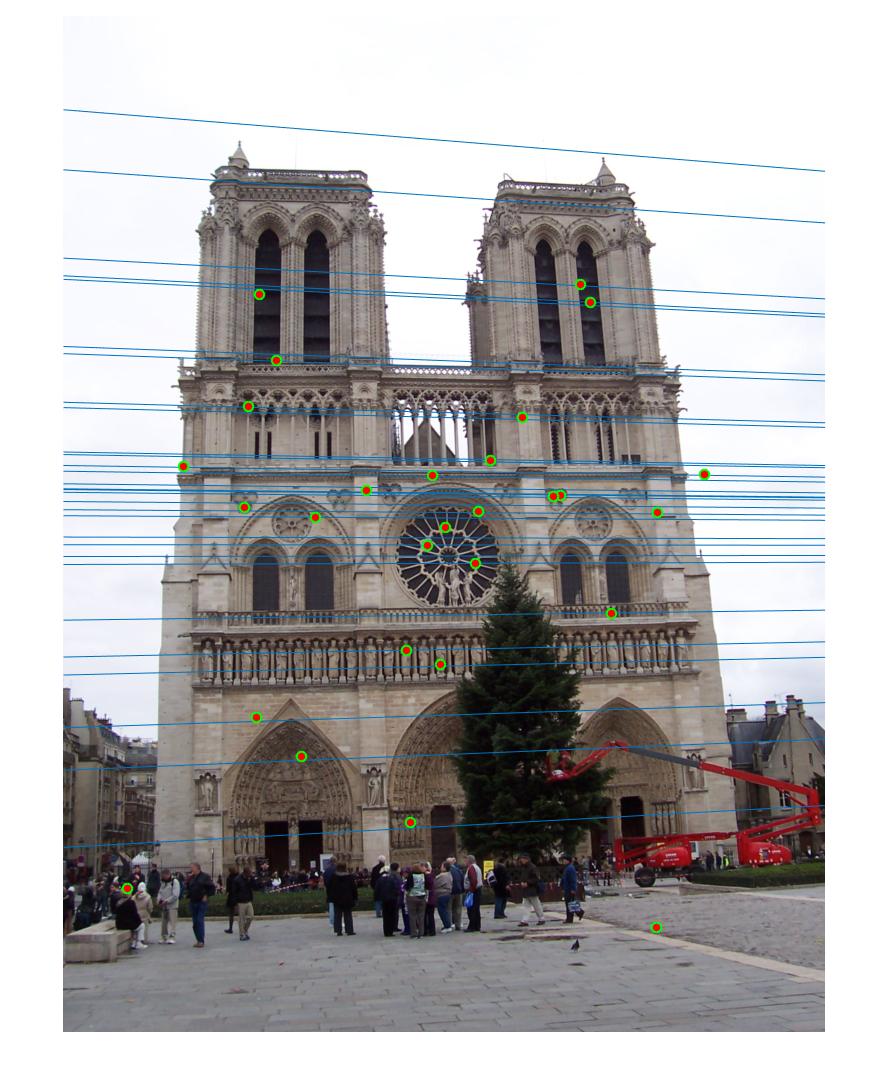
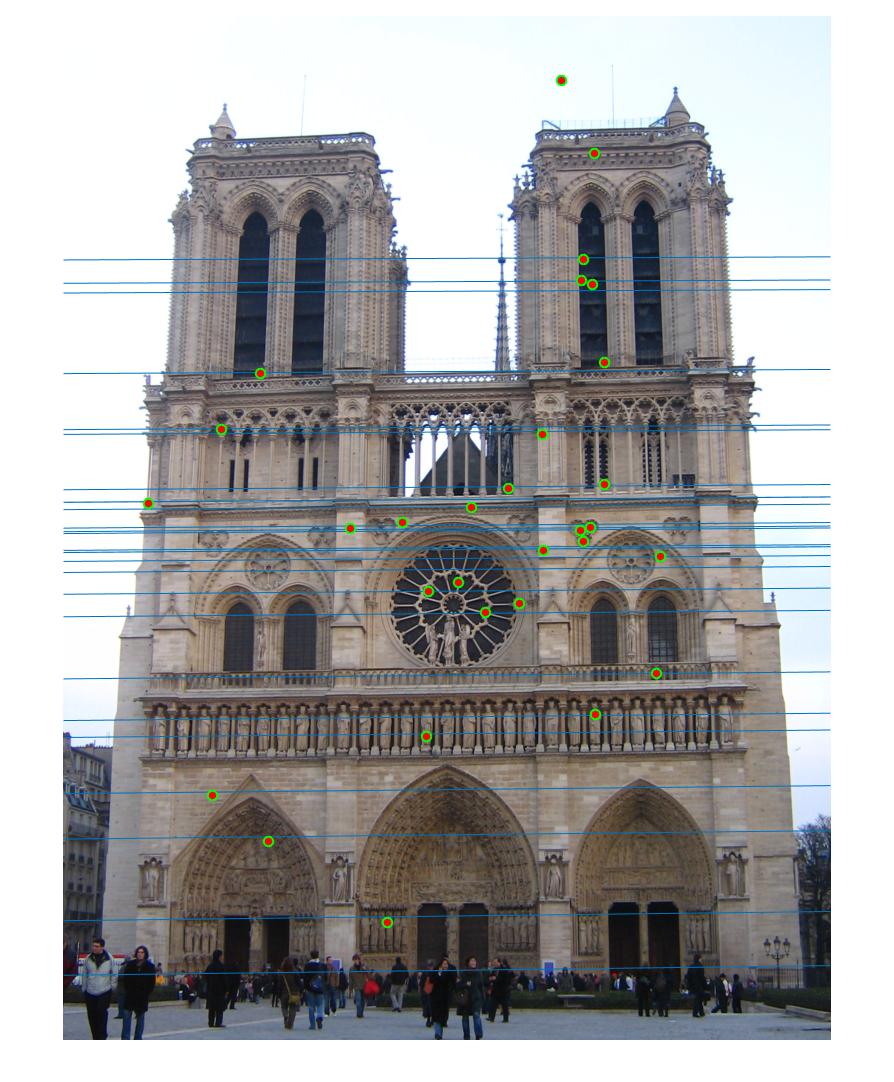
Epipolar lines for Notre Dame without normalization (threshold = 0.08)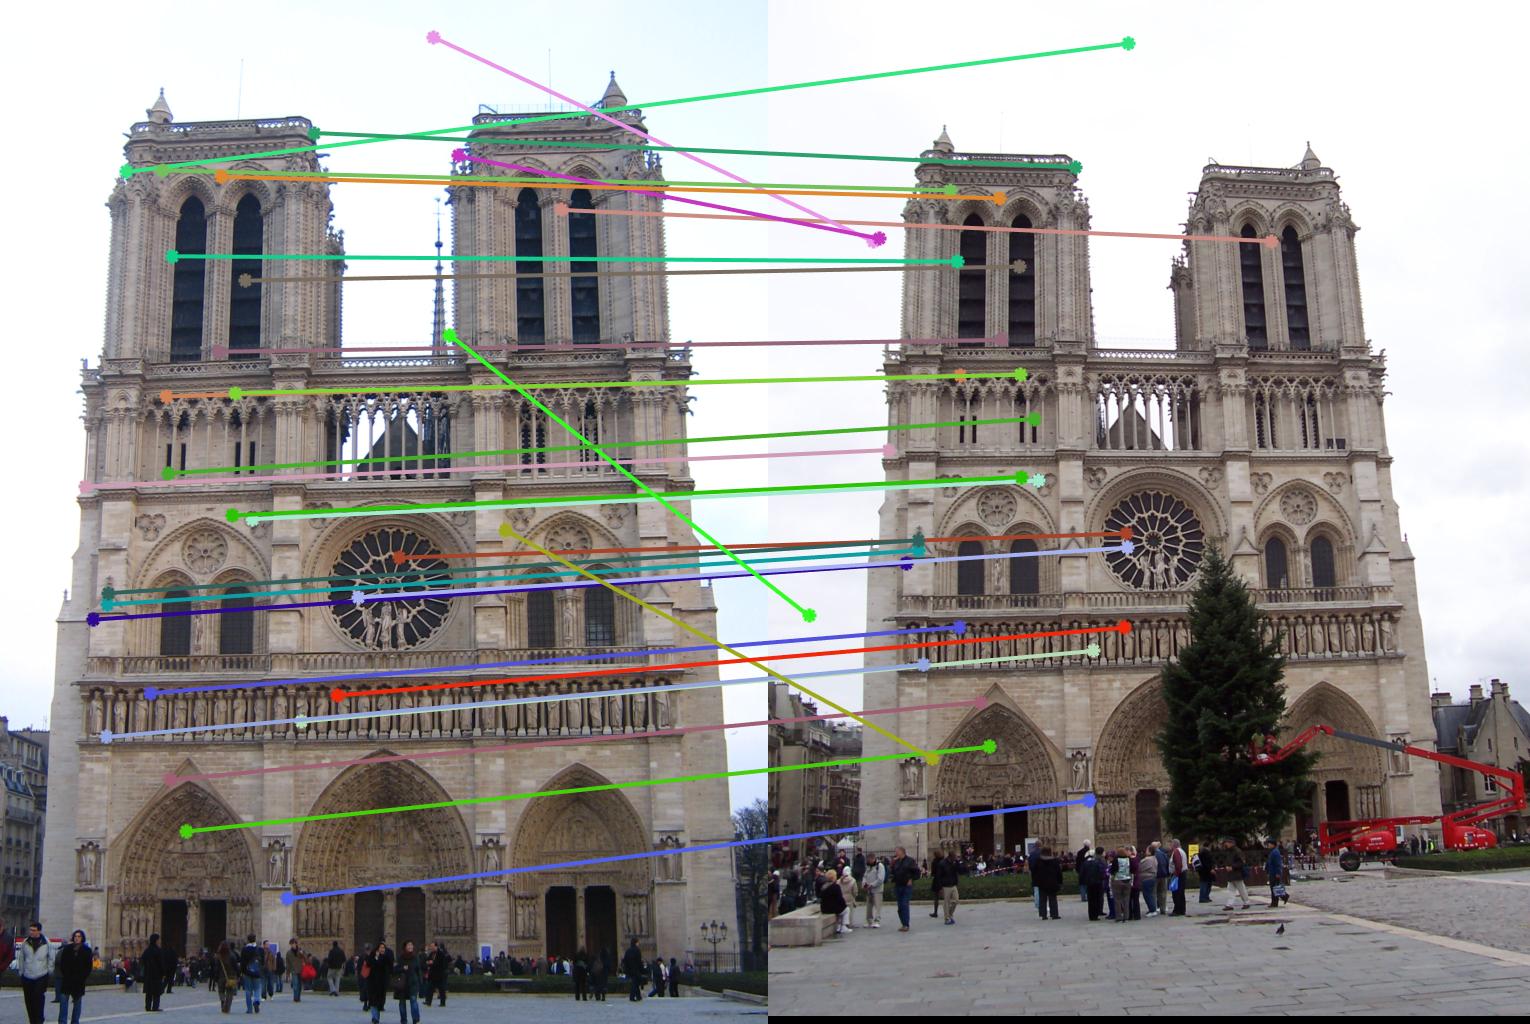
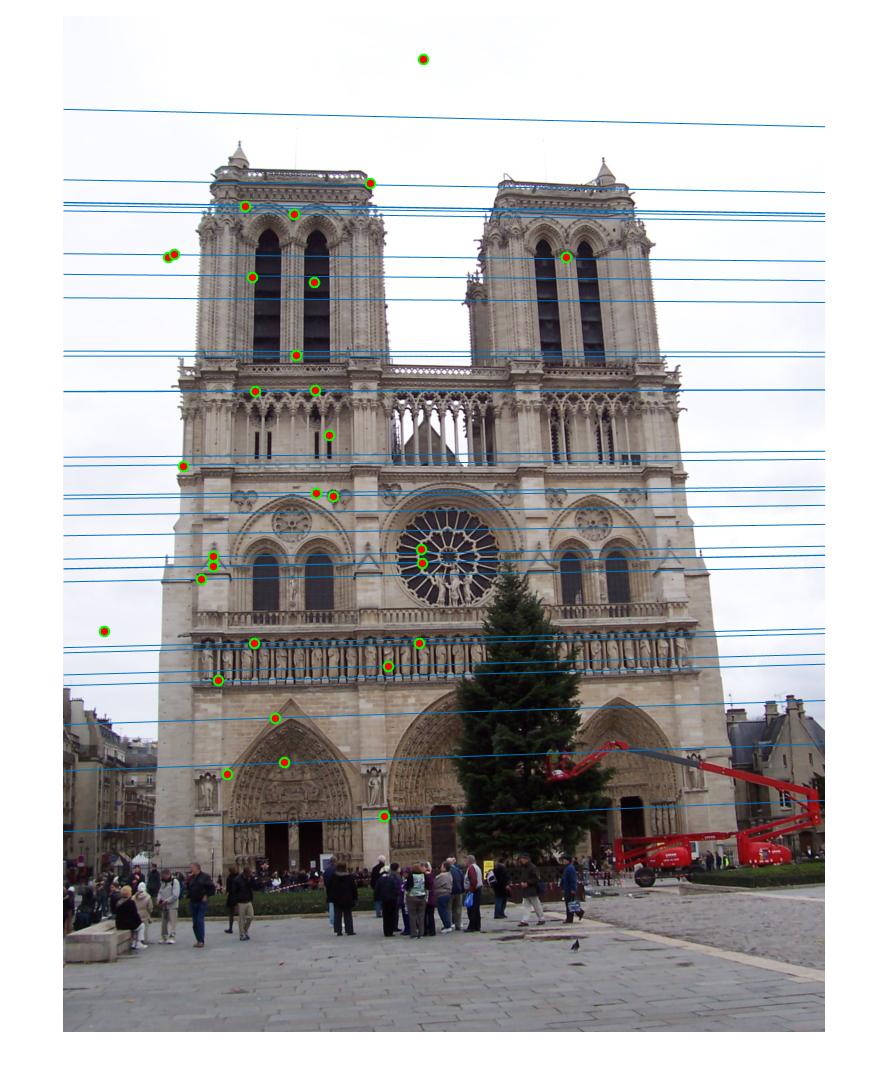
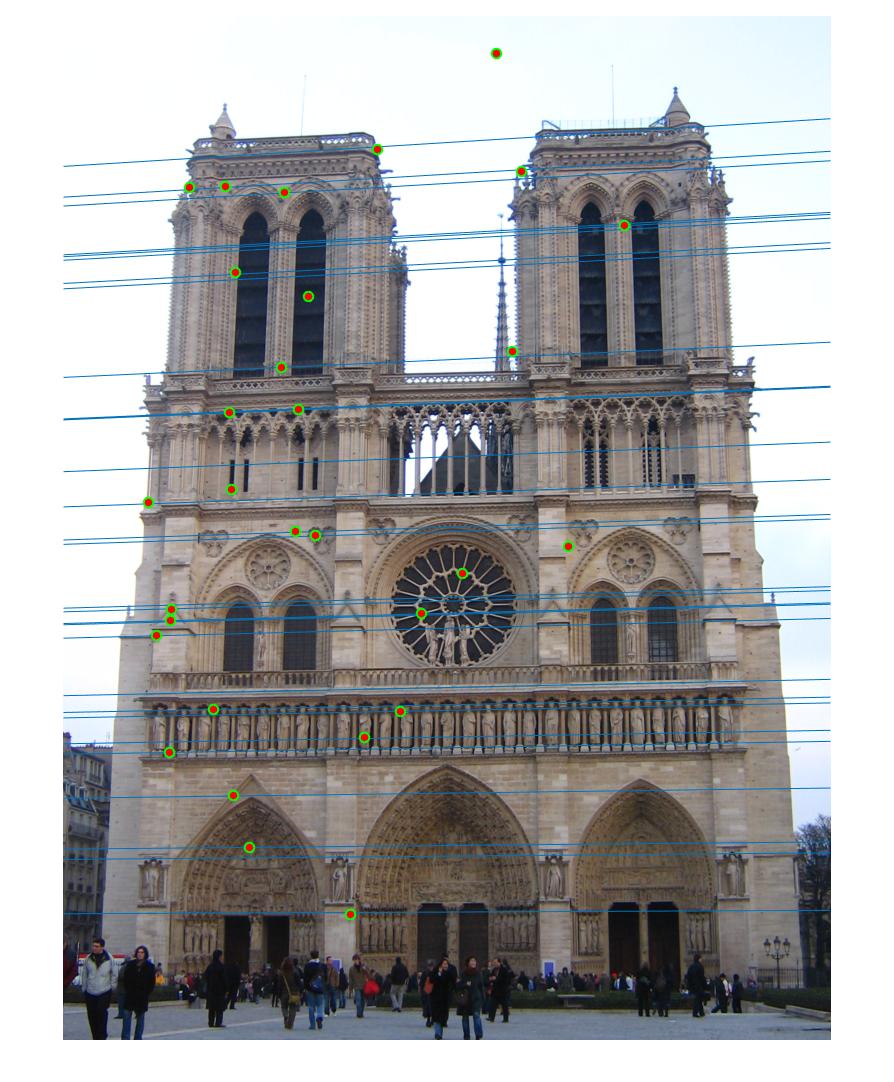
|
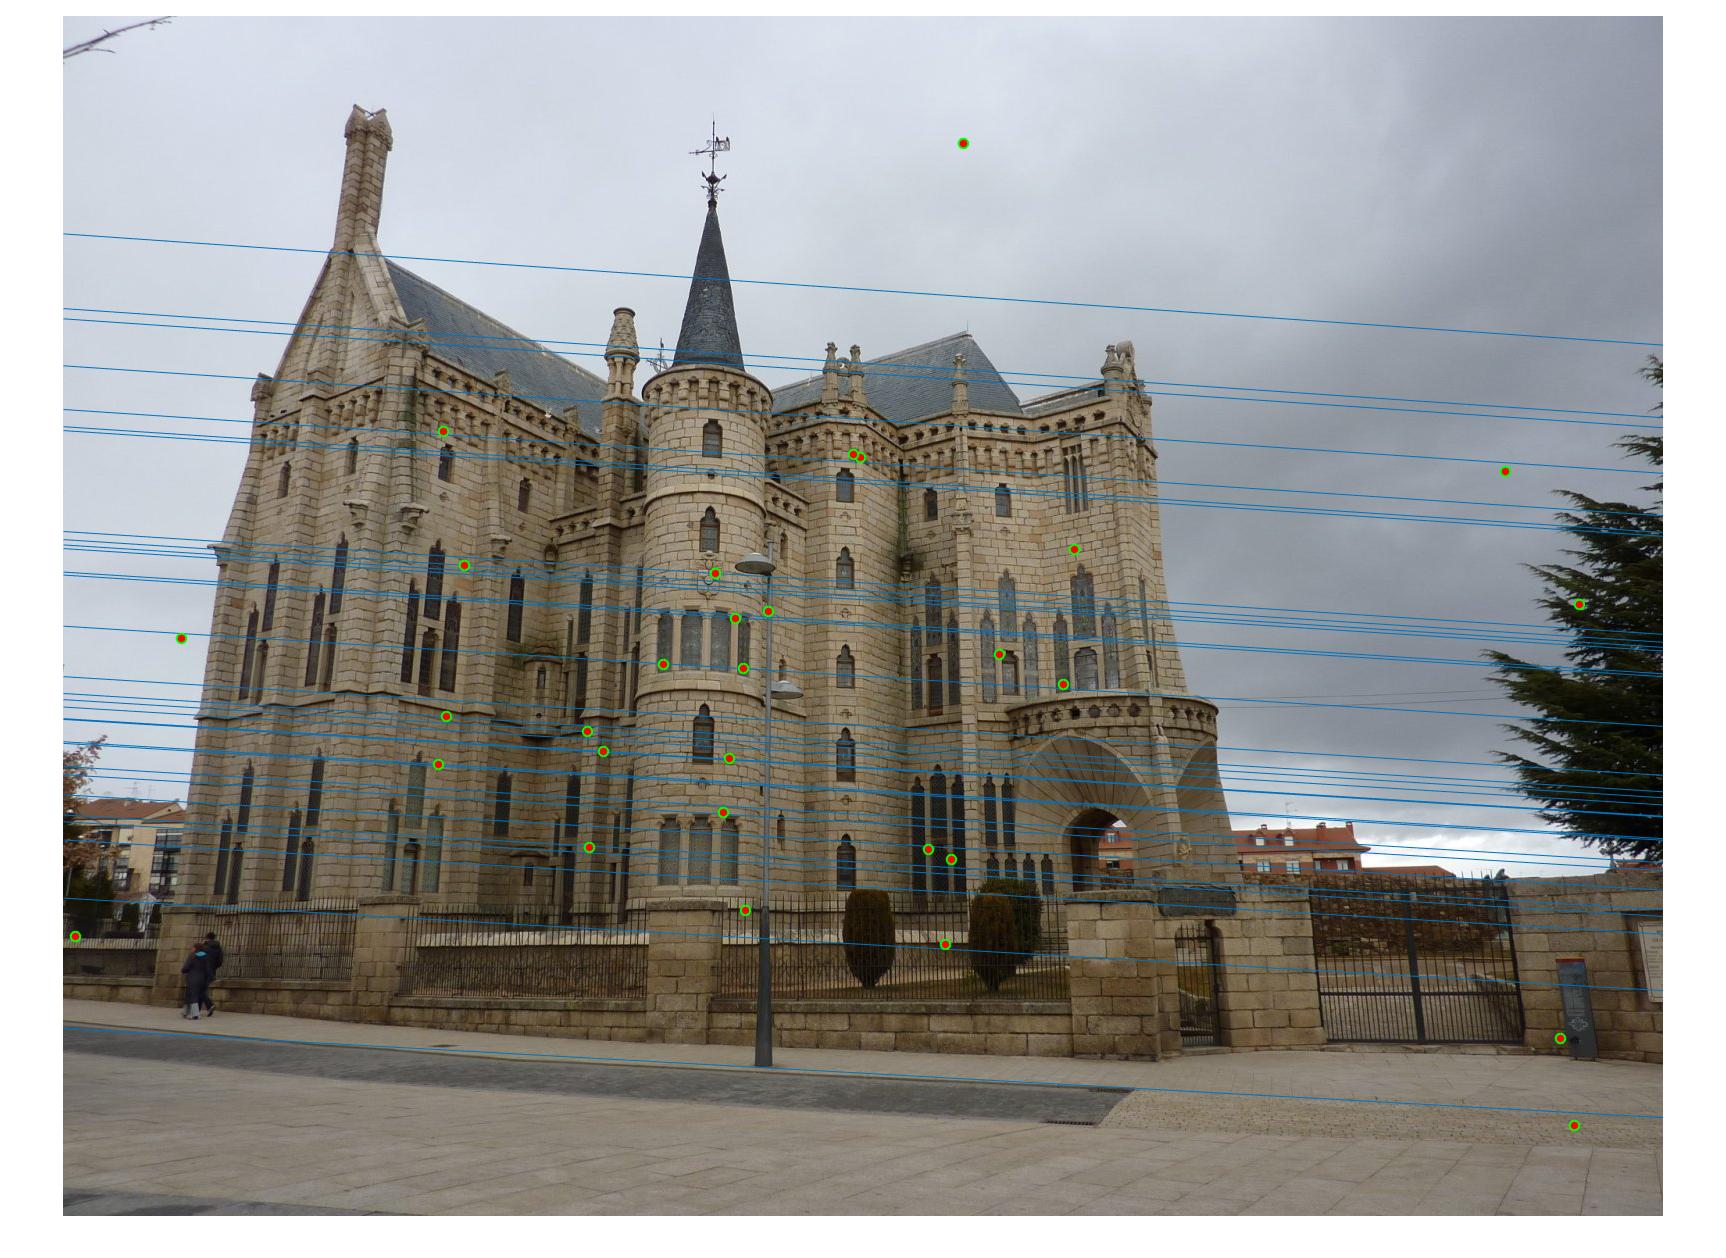
Epipolar lines for Episcopal Gaudi without normalization (threshold = 0.5)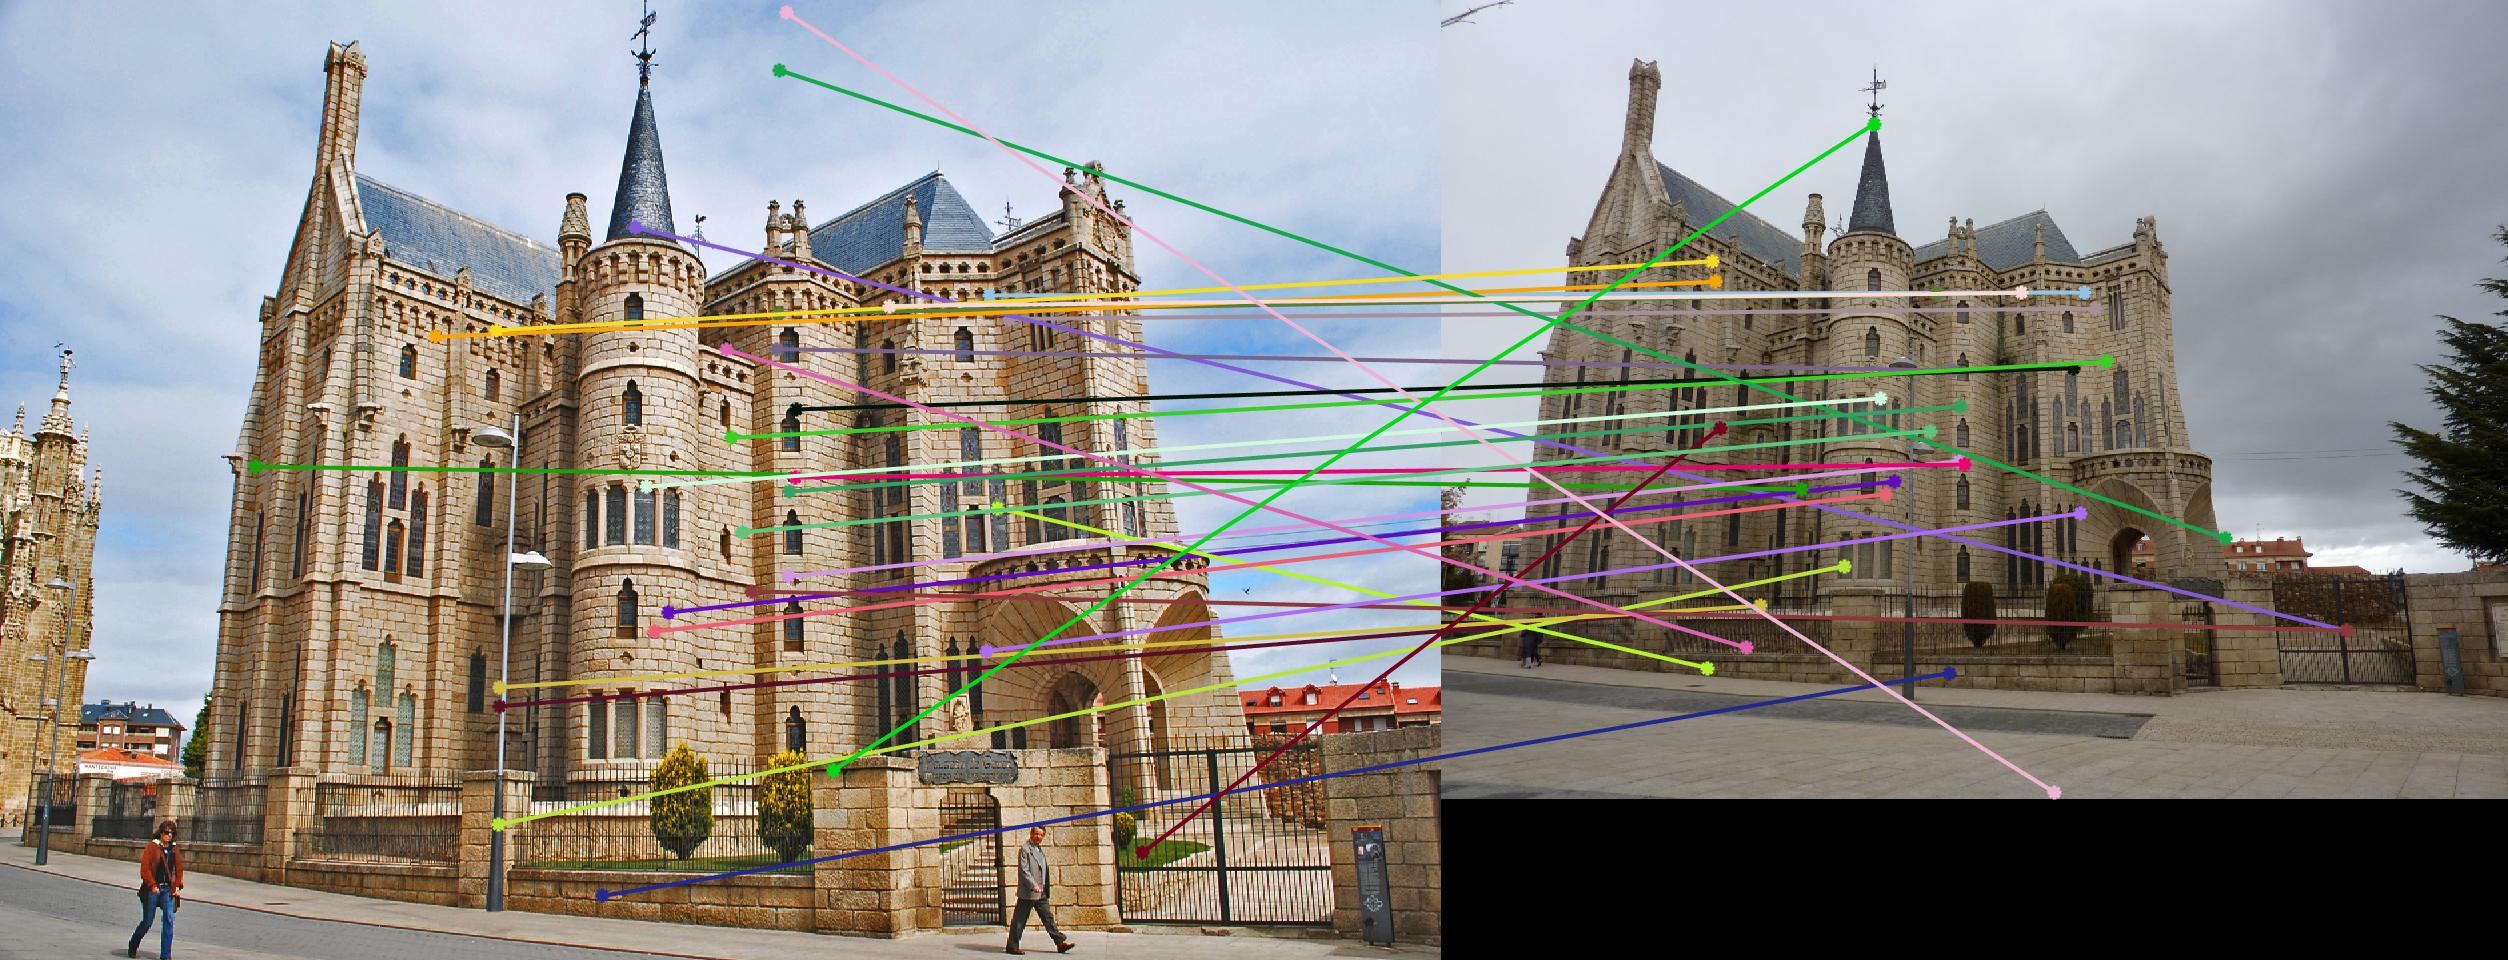
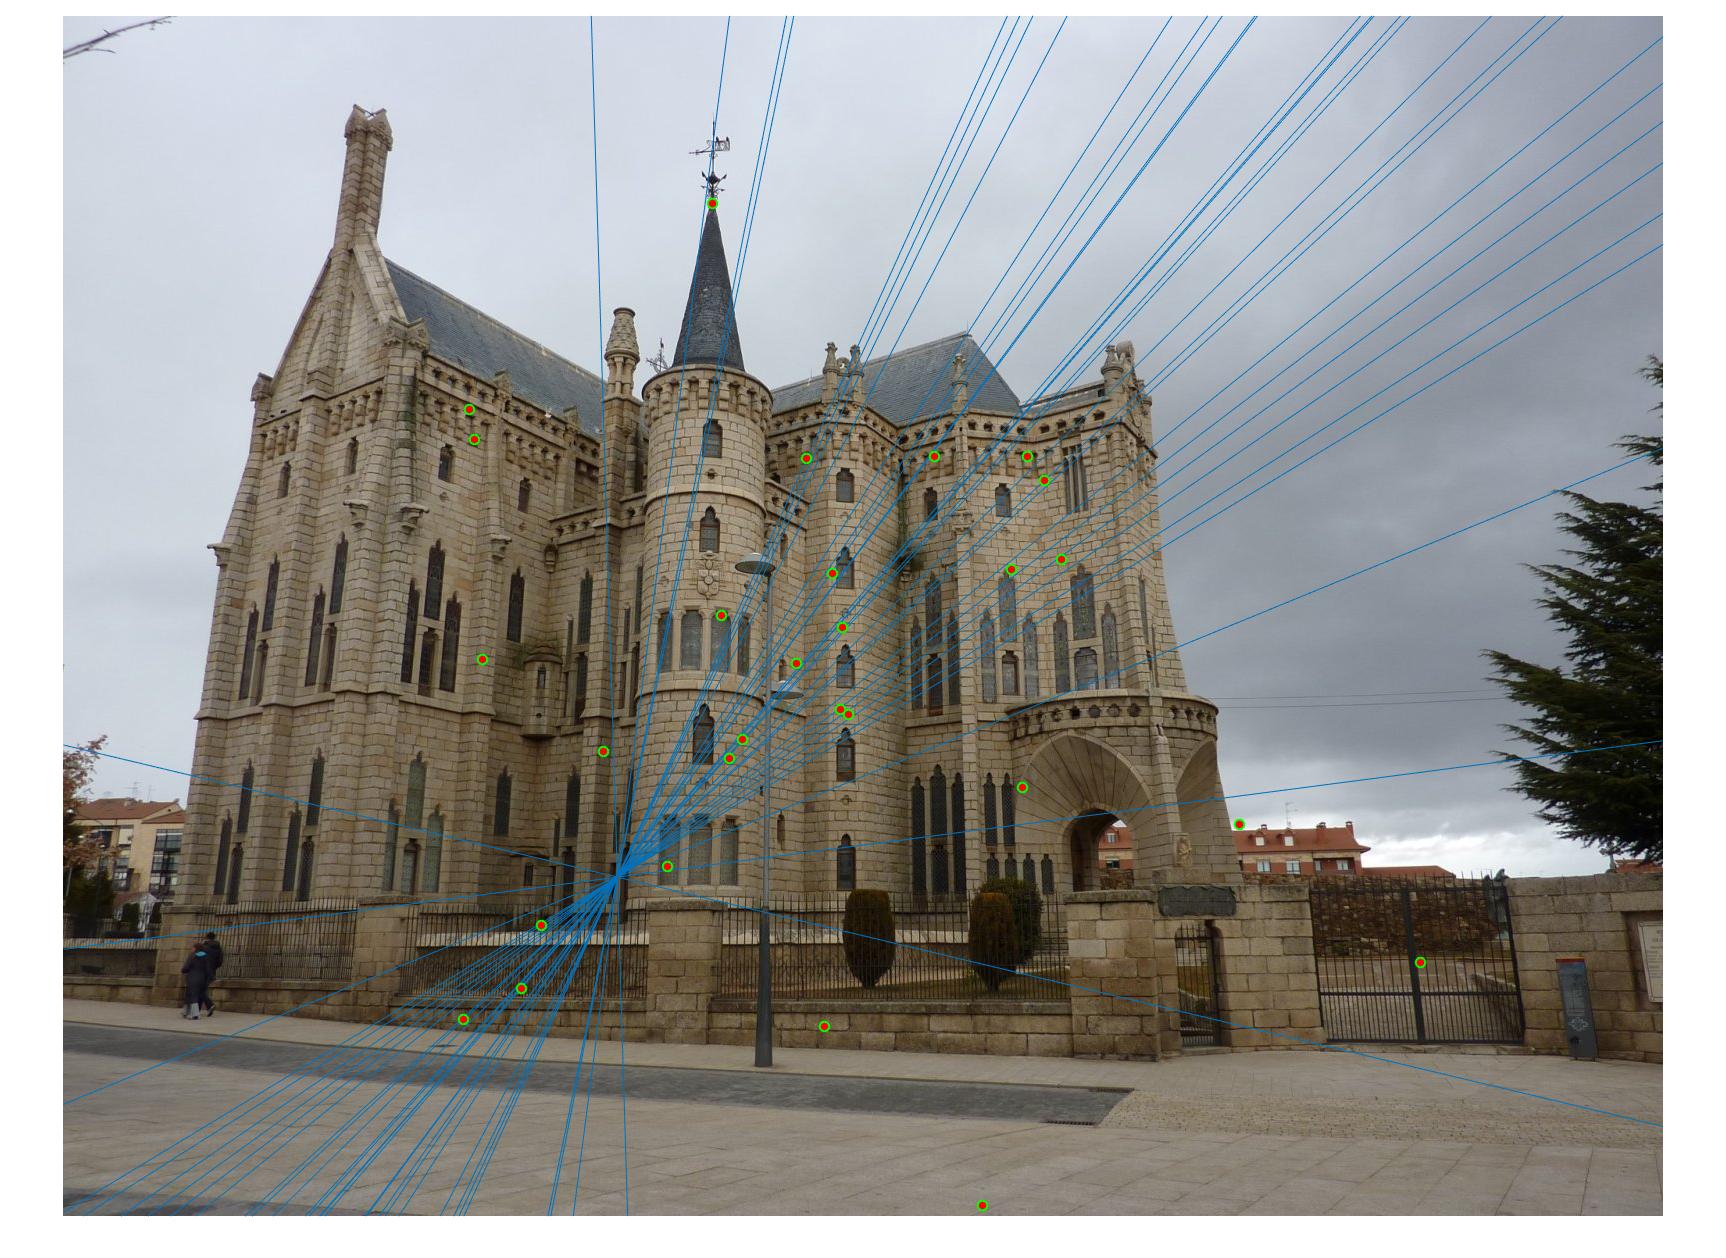
|
Without normalization, didnt obtain good results for Episcopal Gaudi image pair
4. Extra Credit: Fundamental Matrix Estimation with normalized coordinates
The fundamental matrix (F) can be improved by rescaling the coordinates to handle poor numerical conditioning. Following steps are followed:
- Center the image data points with the average magnitude of about 1.0 or some other small number
- Use the eight-point algorithm to compute F from the normalized points
- Enforce the rank-2 constraint on F
- Change fundamental matrix back to original units using Transformation Matrix (T). The fundamental matrix in original coordinates is Tb'*F*Ta where Ta and Tb are the transformation matrices of the image pair.
Epipolar lines for Mount Rushmore(threshold = 0.05)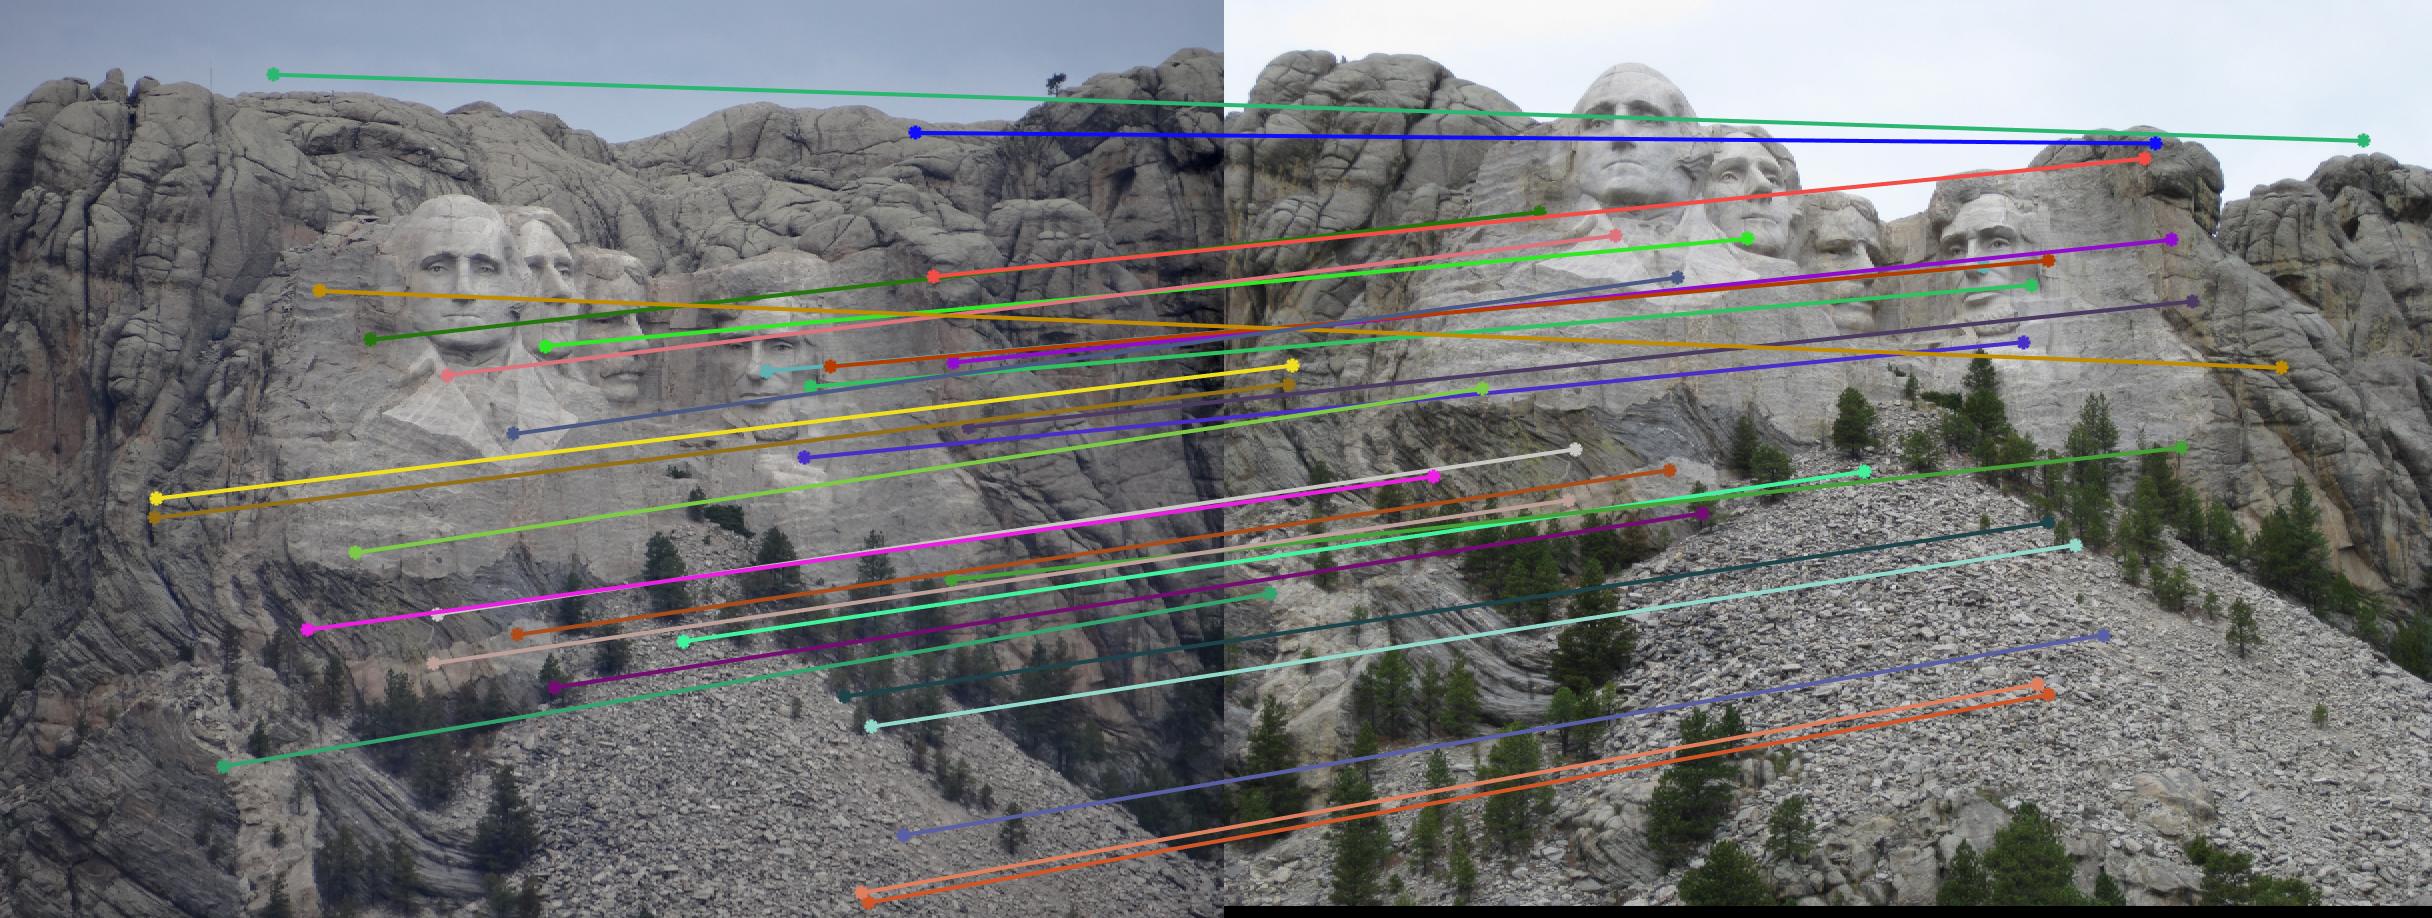
|
|
Epipolar lines for Notre Dame(threshold = 0.08)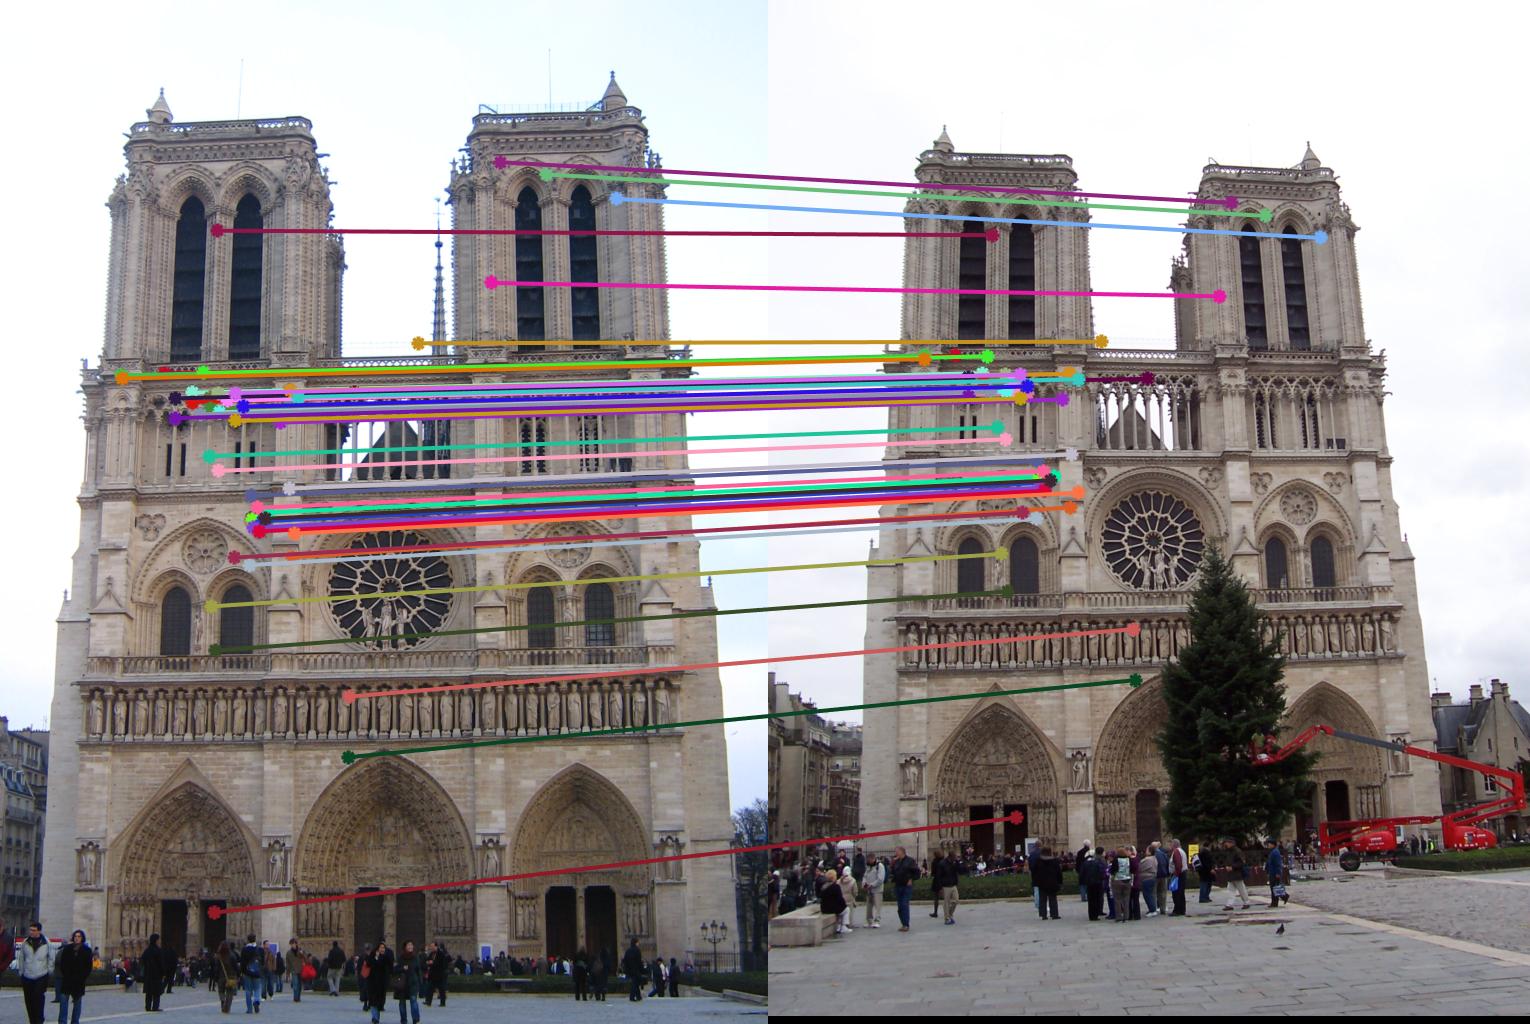
|
|
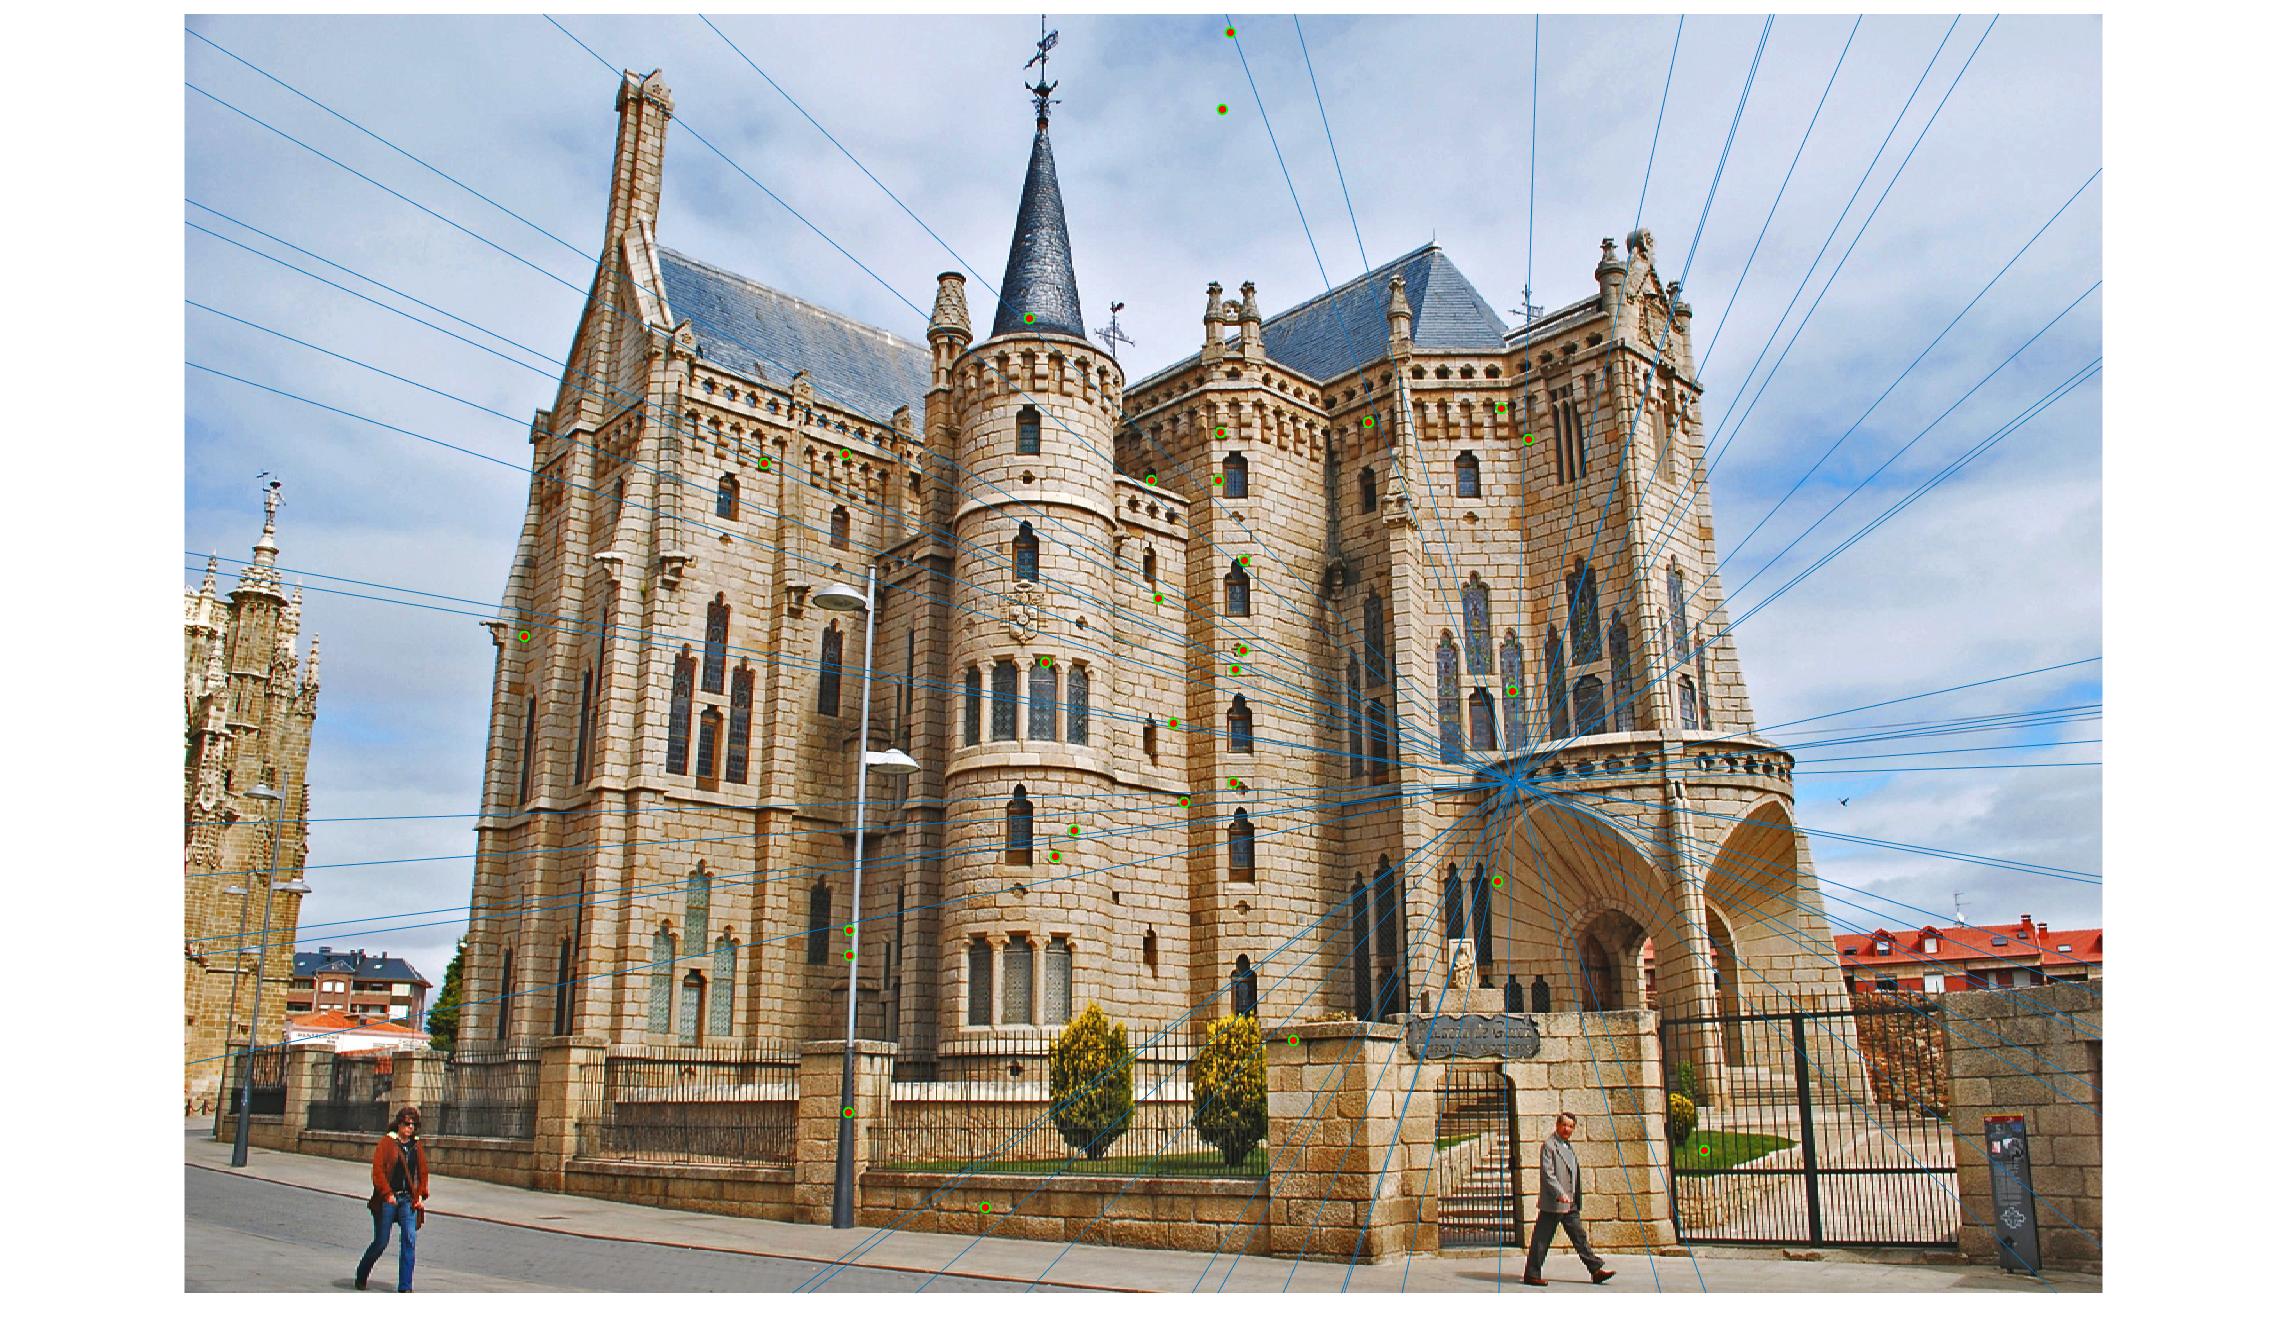
Epipolar lines for Episcopal Gaudi(threshold = 0.05)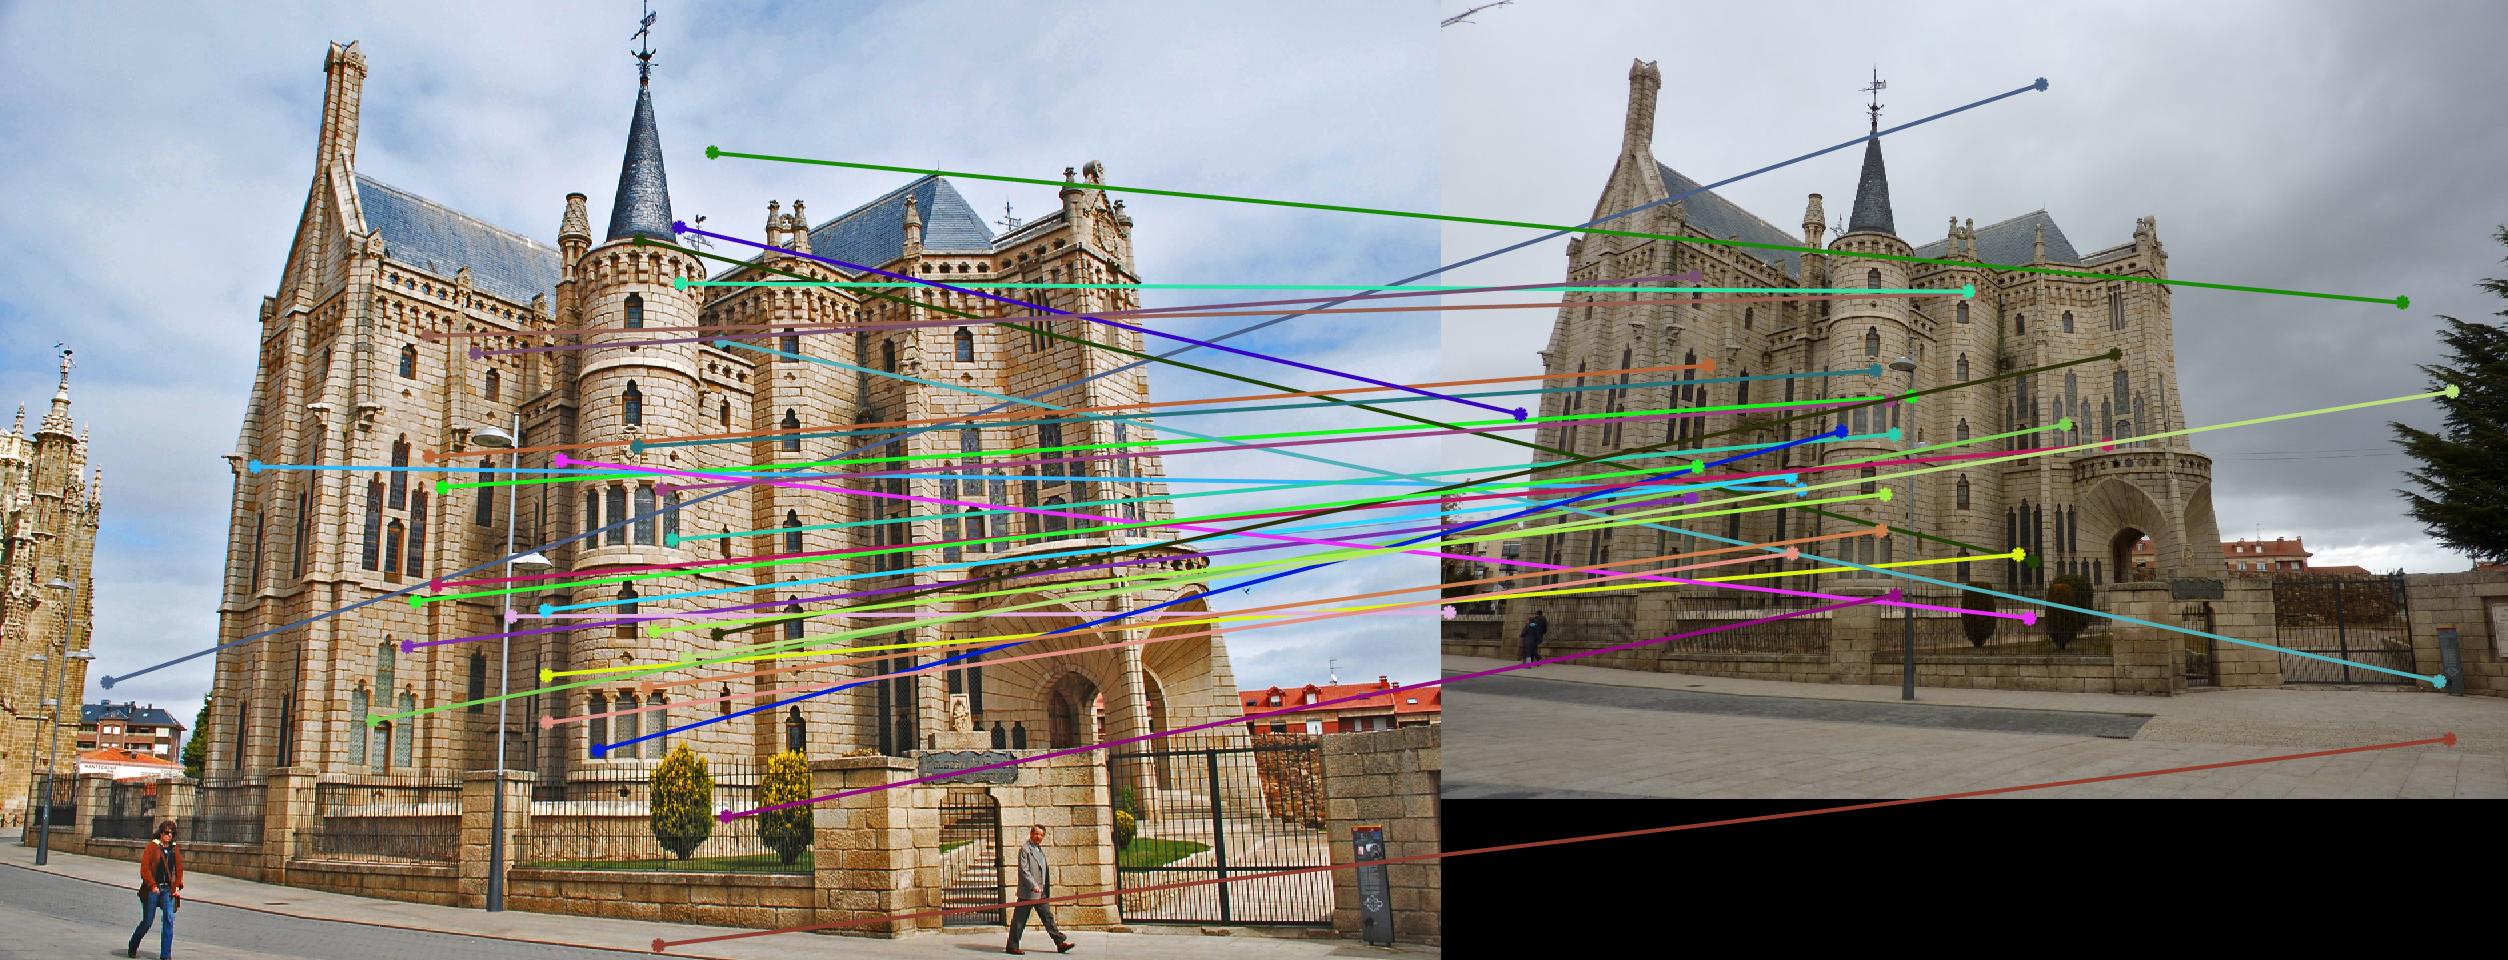
|
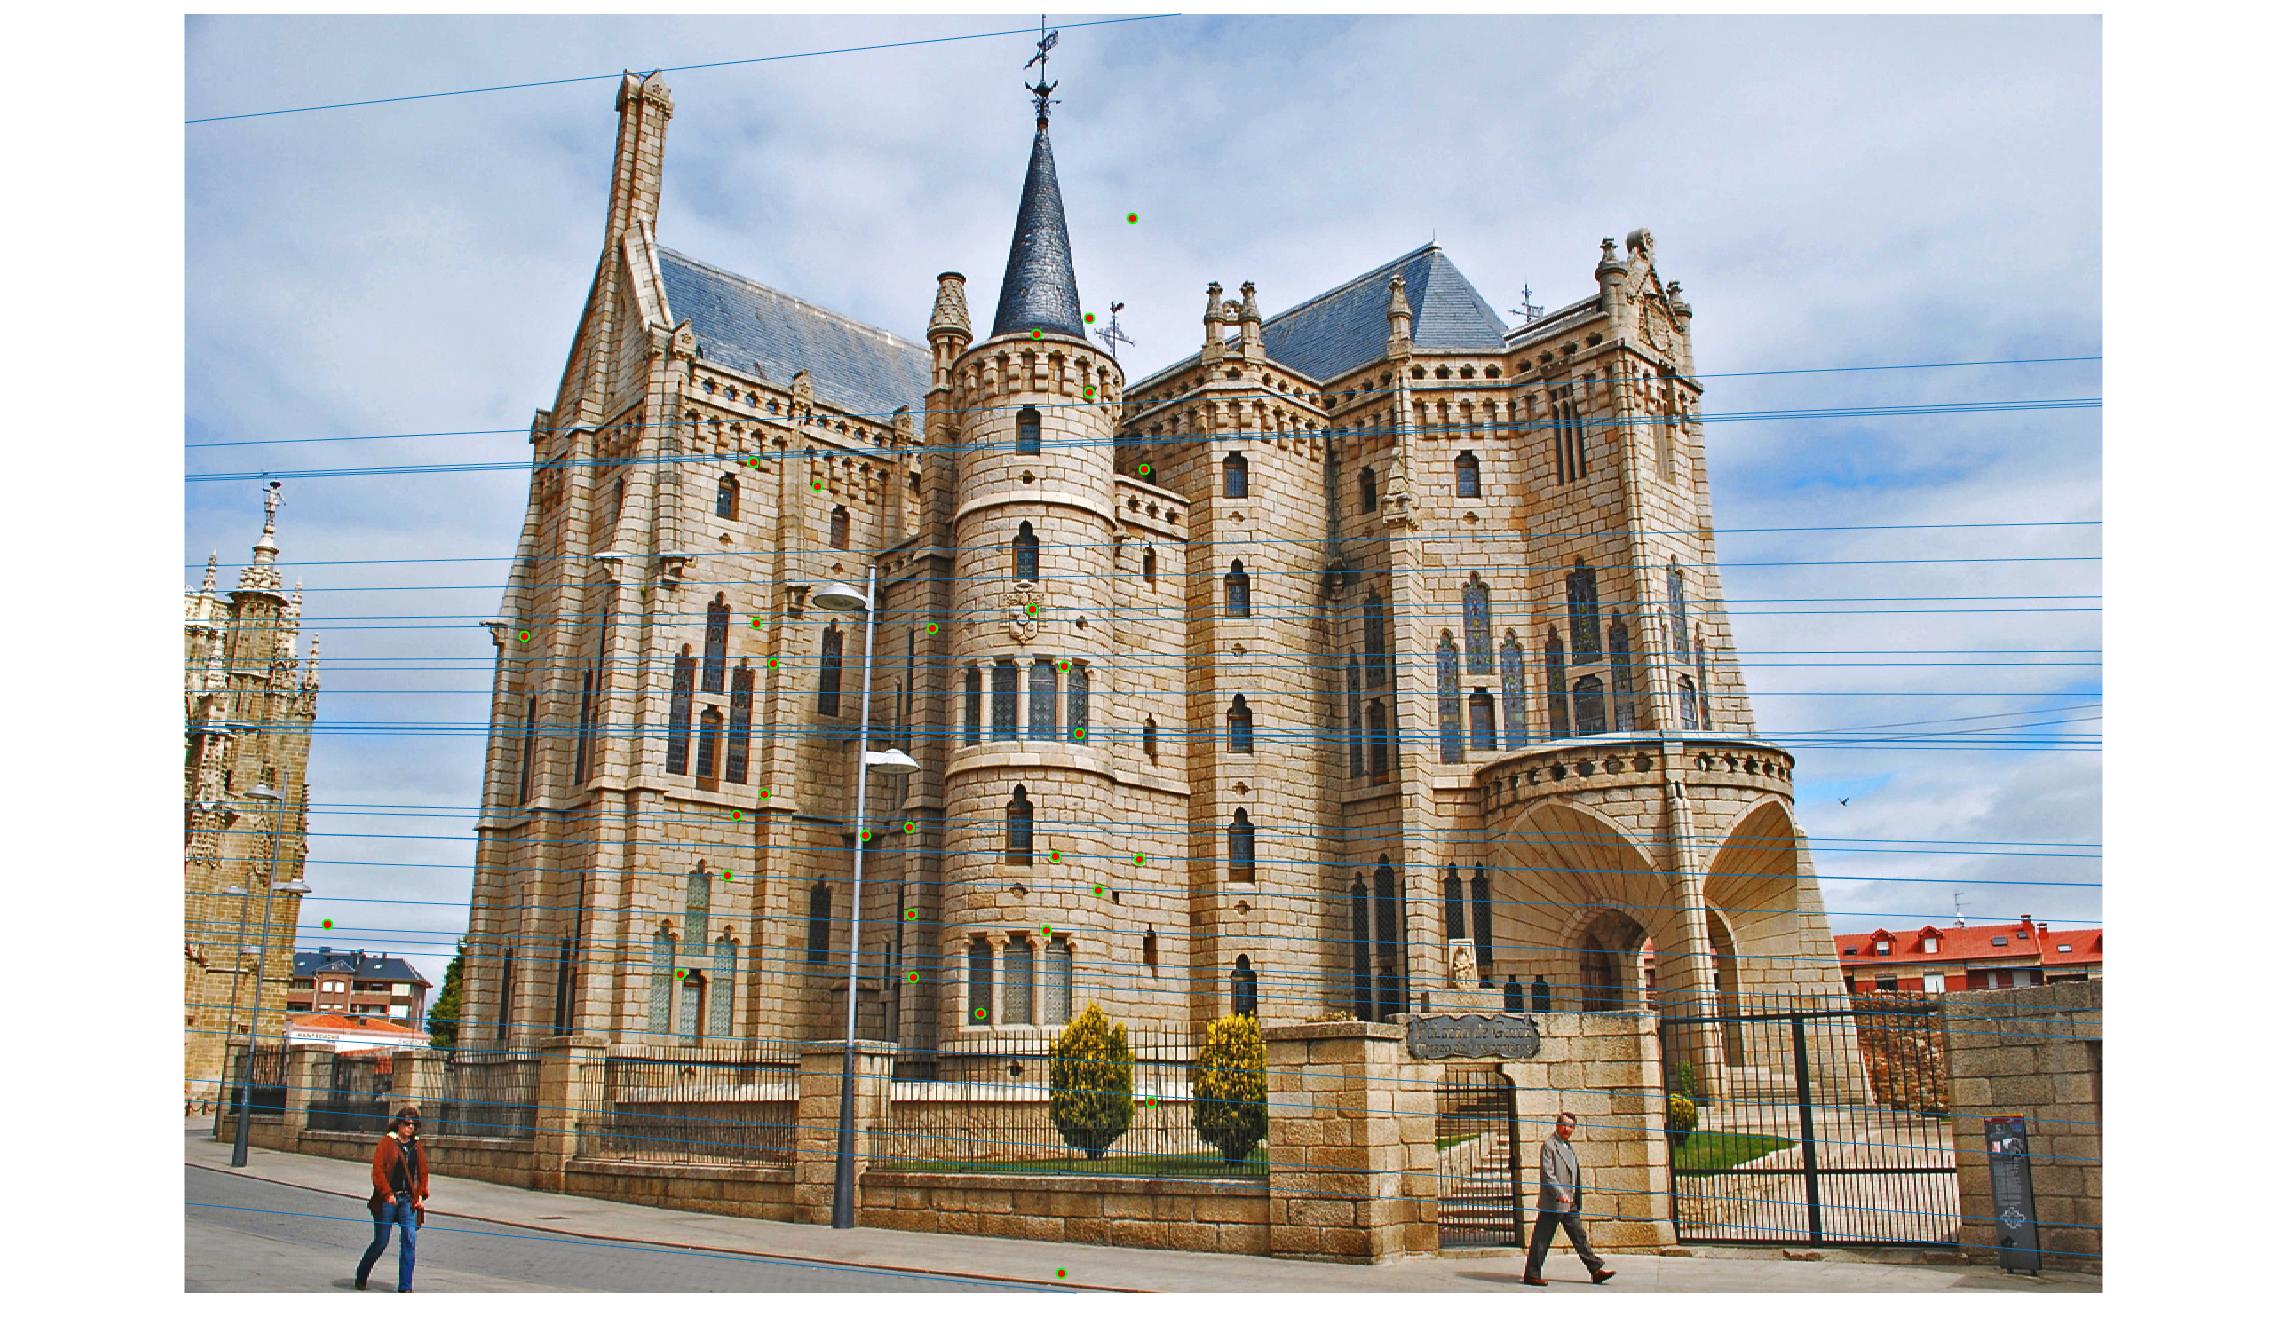
|
Epipolar lines for Woodruff Dorm(threshold = 0.06)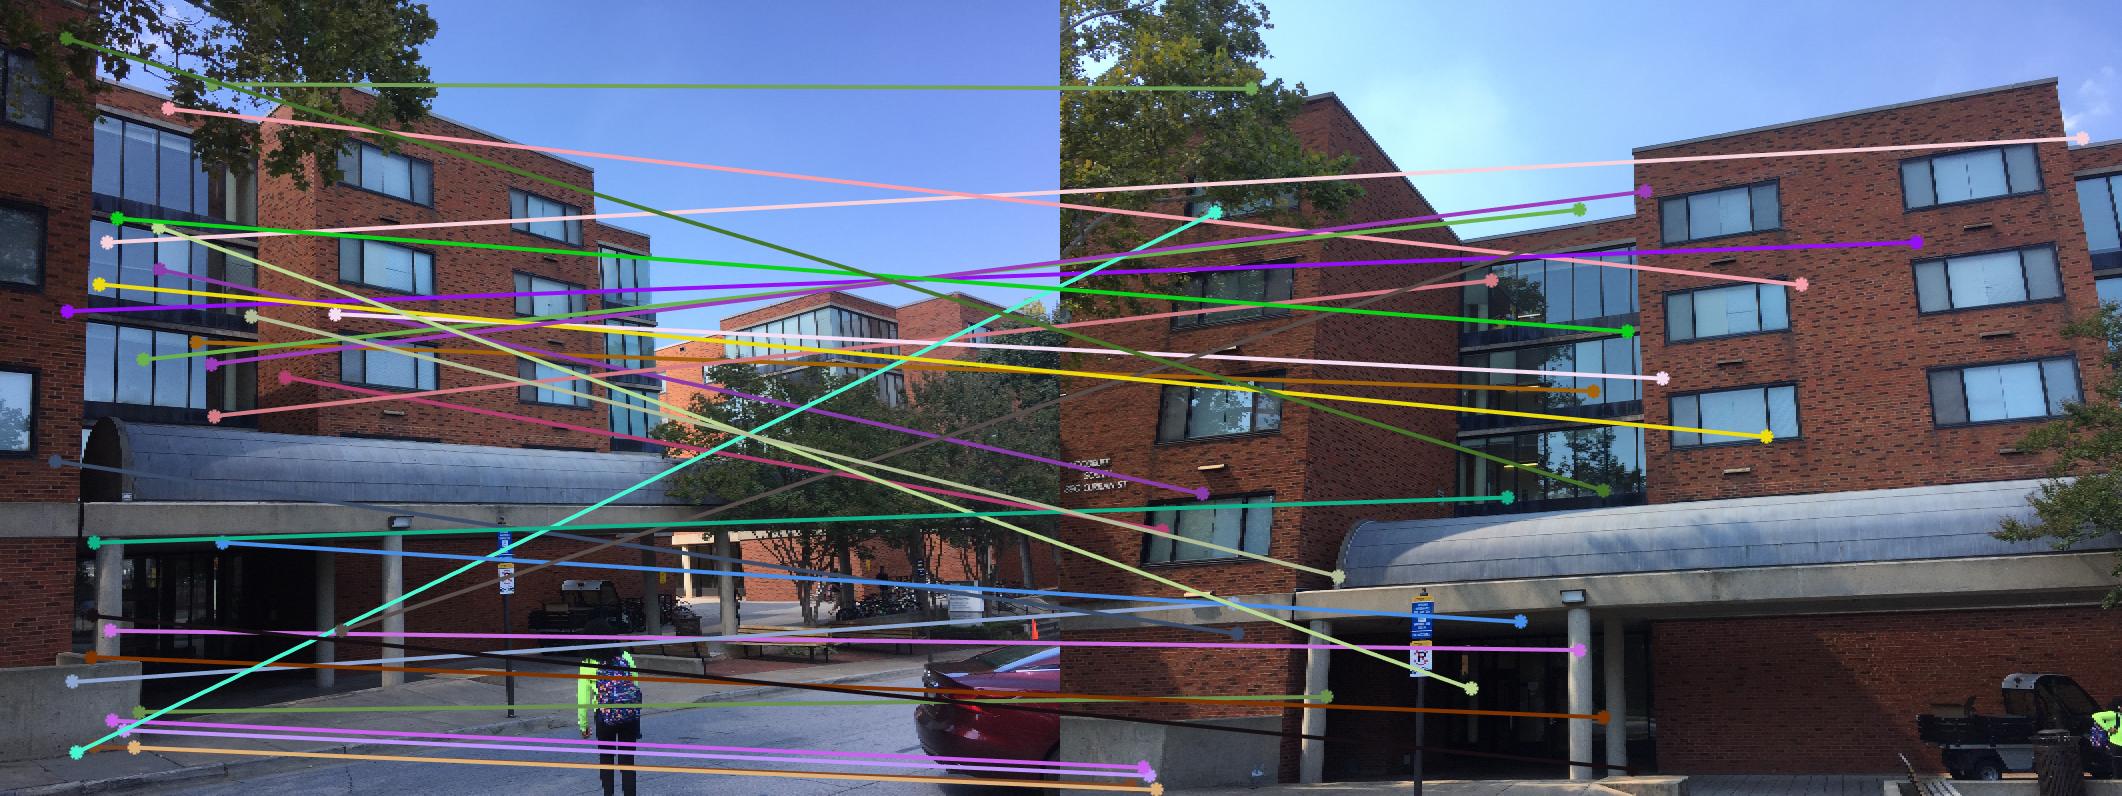
|
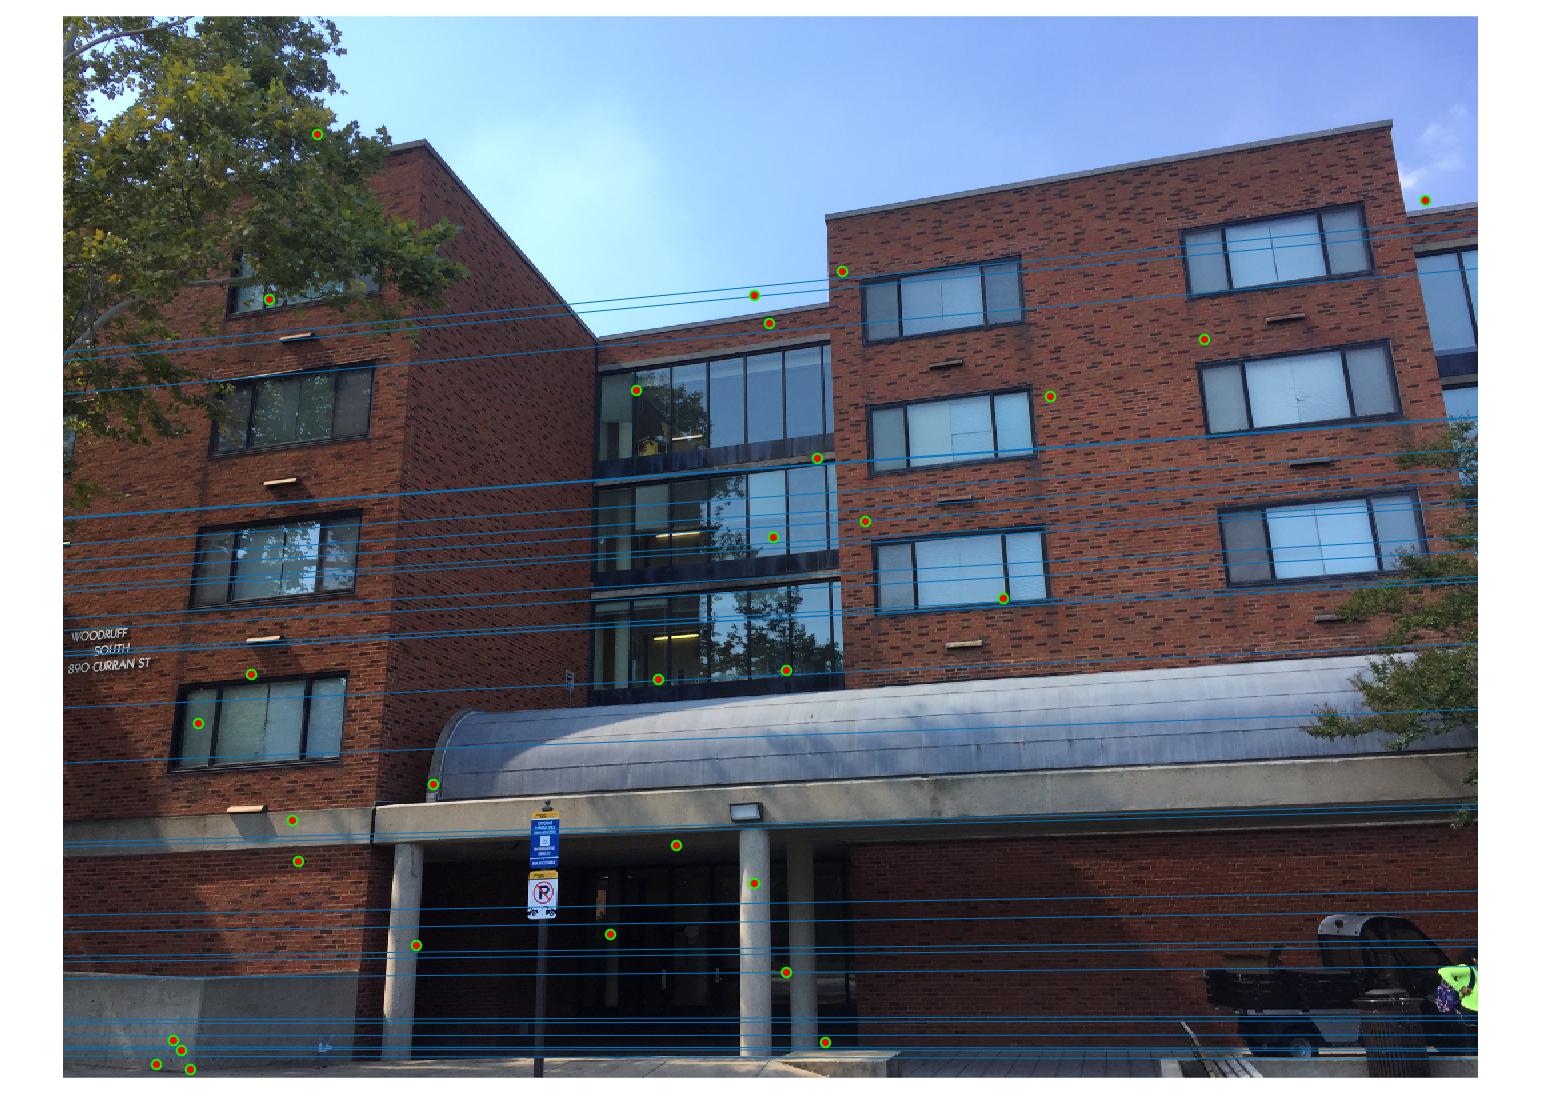
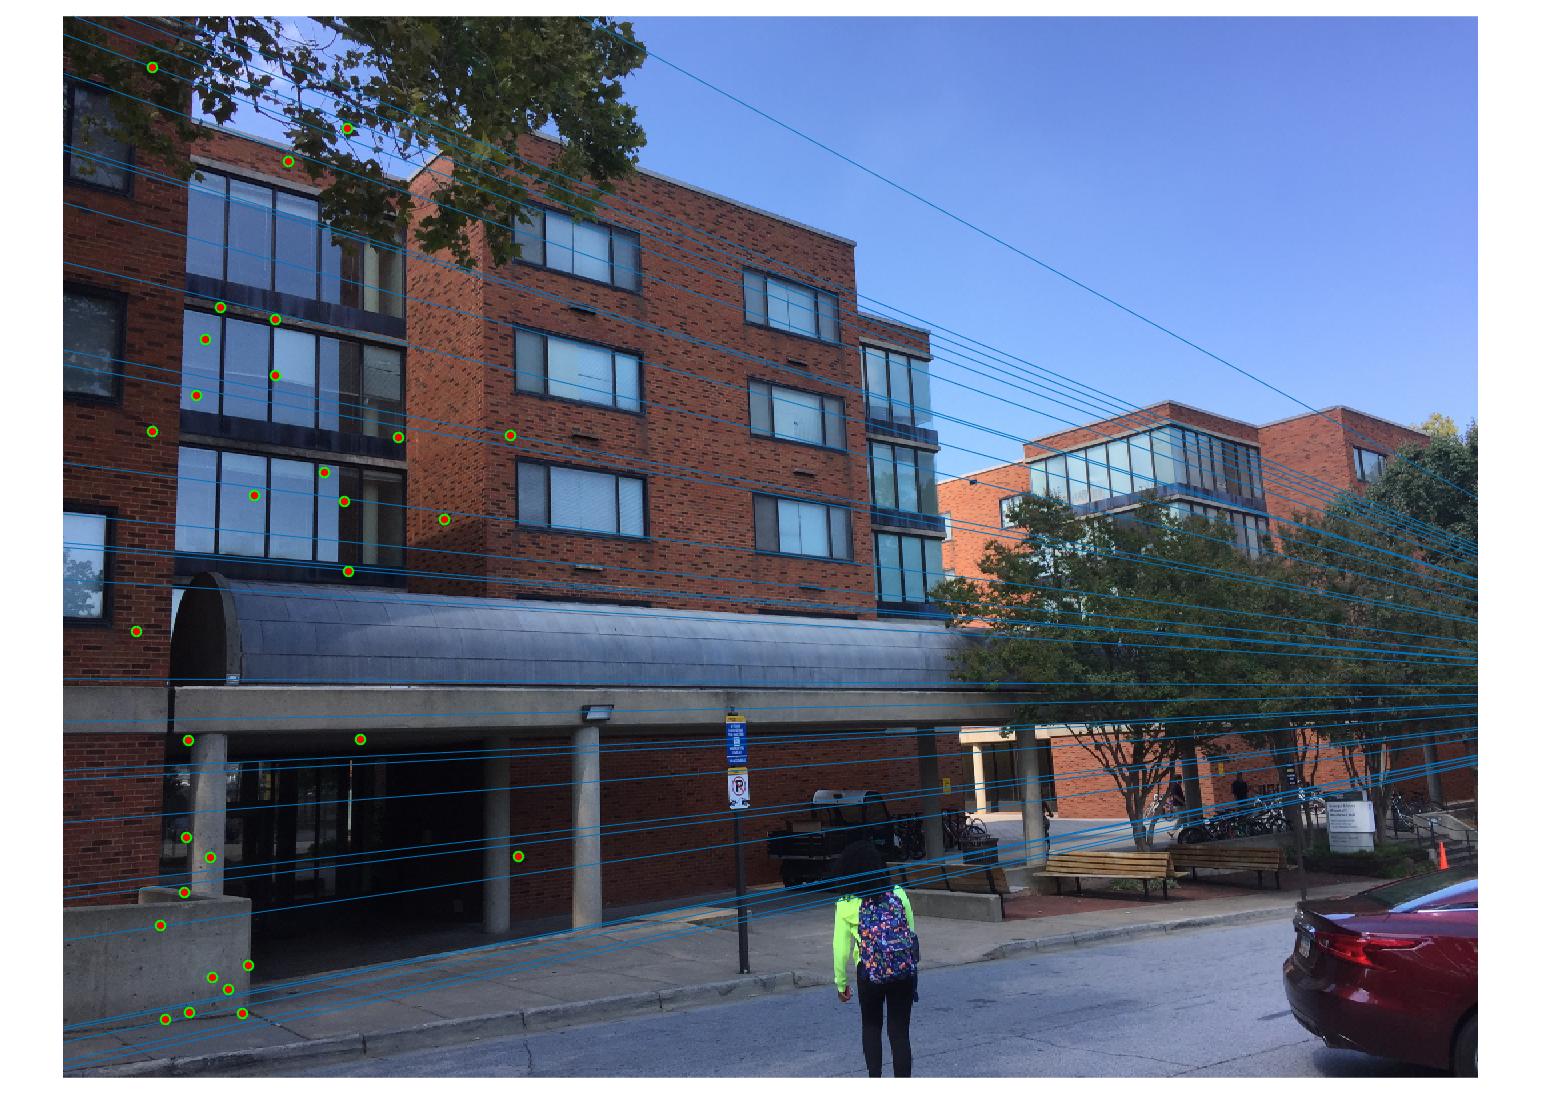
|
Conclusion
On using normalized coordinates for estimating Fundamental Matrix with RANSAC (SIFT features). The two parameters which could be changed were number of iterations of RANSAC and threshold value. It was found significant improvement is observed in mapping points to the epipolar lines for different images for different threshold values as mentioned above and the iterations were set to 2000. With or without normalization there wasnt a major difference in results obtained for Mount Rushmore image pair, but we could see significant improvement in results for Episcopal Gaudi.