Project 3 / Camera Calibration and Fundamental Matrix Estimation with RANSAC
In this project I have written few different algorithms that helps in understanding camera and scene geometry. Then using one of them I have demonstrated how we can filter away spurious matches from SIFT descriptors and achieve near perfect point to point matcing in real world images. This report is divided in three parts:
- Camera projection matrix and camera center
- Fundamental matrix estimation
- Fundamental matrix with RANSAC
Let's go through each of them:
1. Camera projection matrix and camera center
Here I'm computing projection matrix of the camera from the given mapping for 2-d image coordinates to 3-d world coordinates. Then using this matrix I 'm calculating camera center in terms of world coordinates.
- This is the projection matrix equation which involves the 2-D image and 3-D world homogenous coordinates.
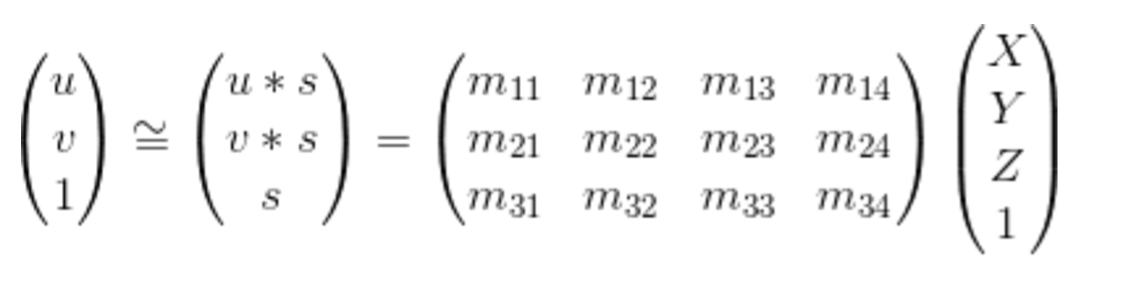
- This M matrix can be solved by the system of linear equations, but the problem here is that M is defined upto a scale. It has multiple different solutions some of which might not be useful.
- To fix this scale I have put m34 = 1
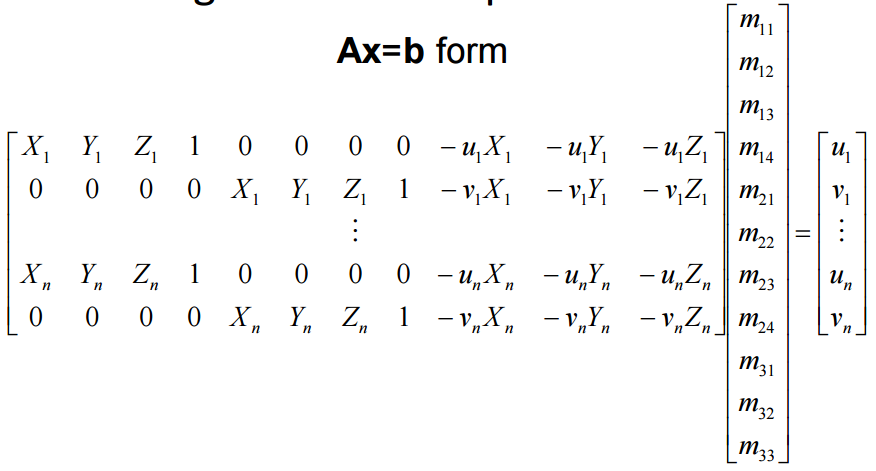
- Now this can be solved by least squares regression.
Projection matrix(not scaled):
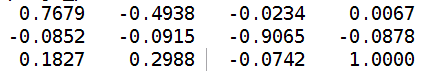
- Then I have normalized and scaled the M Matrix by a factor of -1.
Projection matrix(scaled):
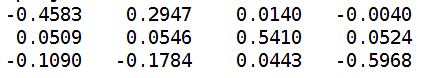
- In order to validate my projection matrix I used residual to measure its validity. The residual is just the distance (square root of the sum of squared differences in u and v).
Residual: 0.0445
- In order to compute camera center, I used the following equation: C = - Q-1 m4, here Q is the first 3 columns of M
Camera center: -1.5126, -2.3517, 0.2827
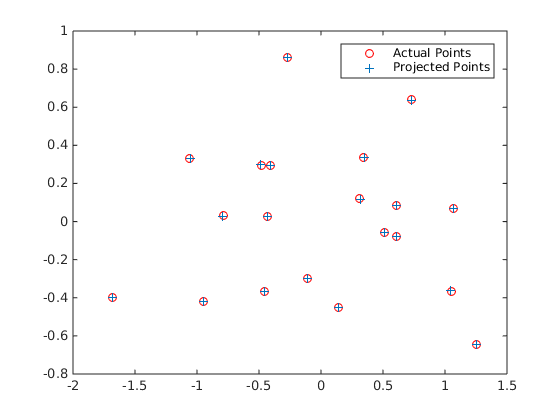
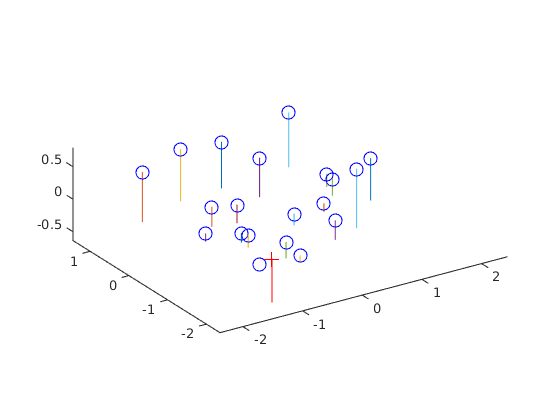
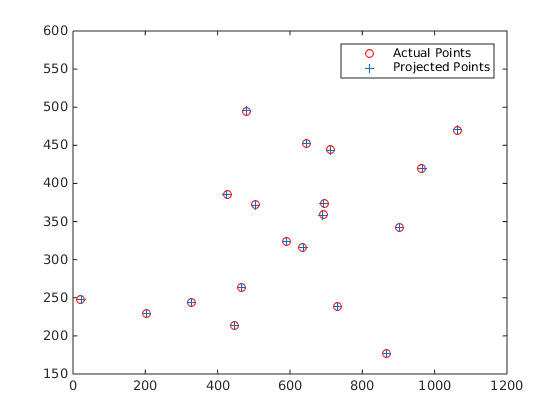
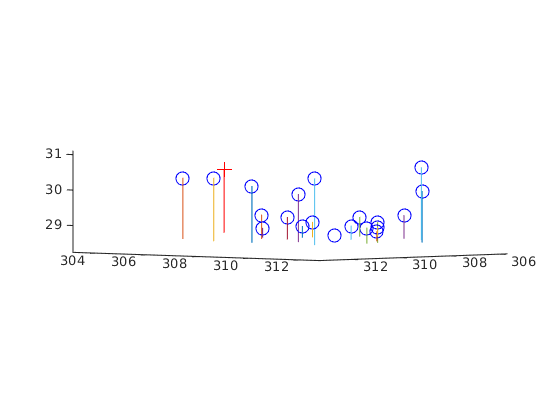
|
From left to right: Projected Points, Camera Center
2. Fundamental matrix estimation
Here I'm computing fundamental matrix from the given mapping for 2-d image coordinates to 2-d image coordinates.
- This is the fundamental matrix equation which involves the 2-D image1 and 2-D image2 homogenous coordinates.
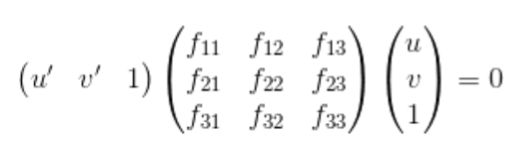
- This F matrix can be solved by the system of linear equations, in the same way as we did for projection matrix. To fix the scale I have put f33 = 1
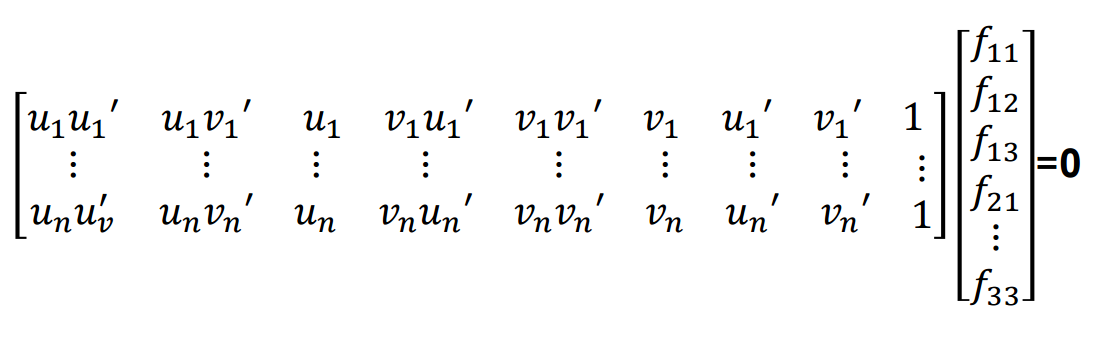
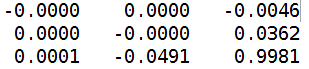
- The least squares estimate of F is full rank; however, the fundamental matrix is a rank 2 matrix. To reduce its rank I applied SVD and set the smallest singular element to zero and then recalculated F back.
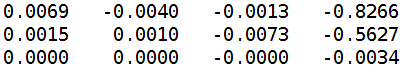
- Fundamental Matrix(using normalization):


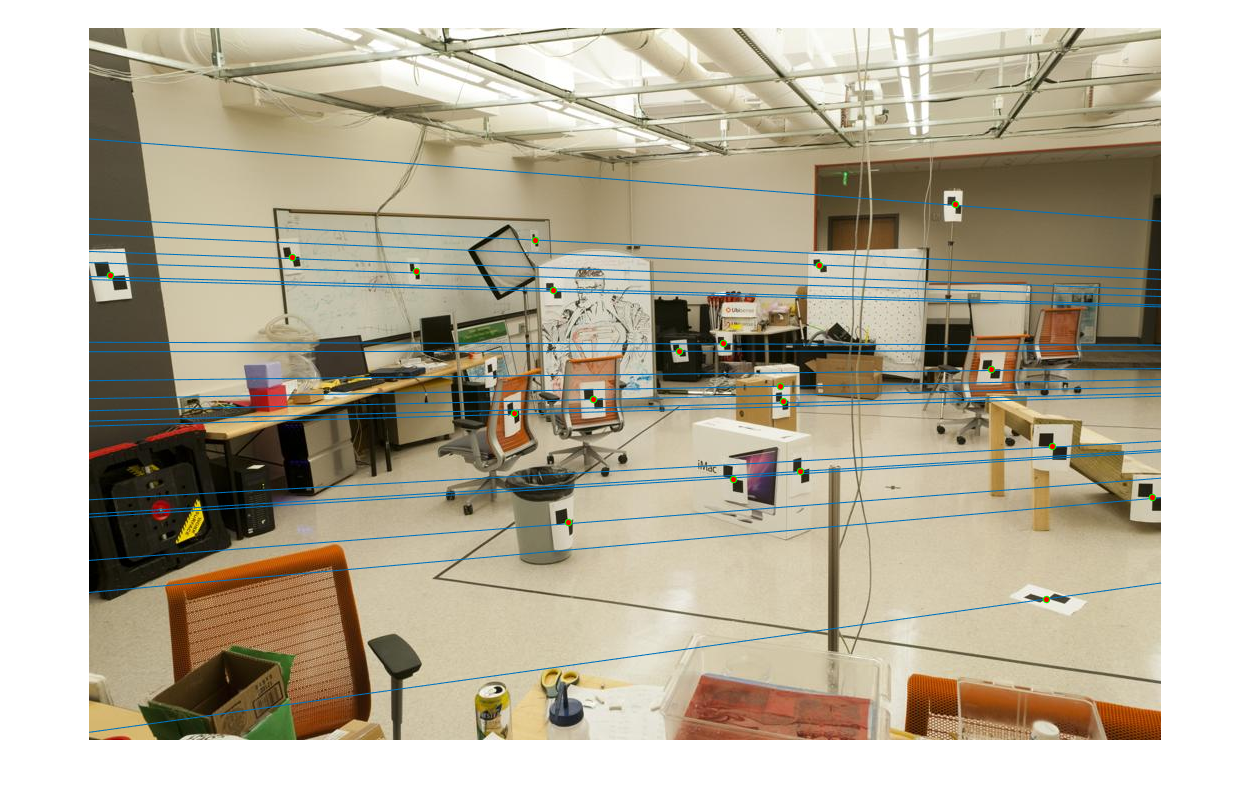
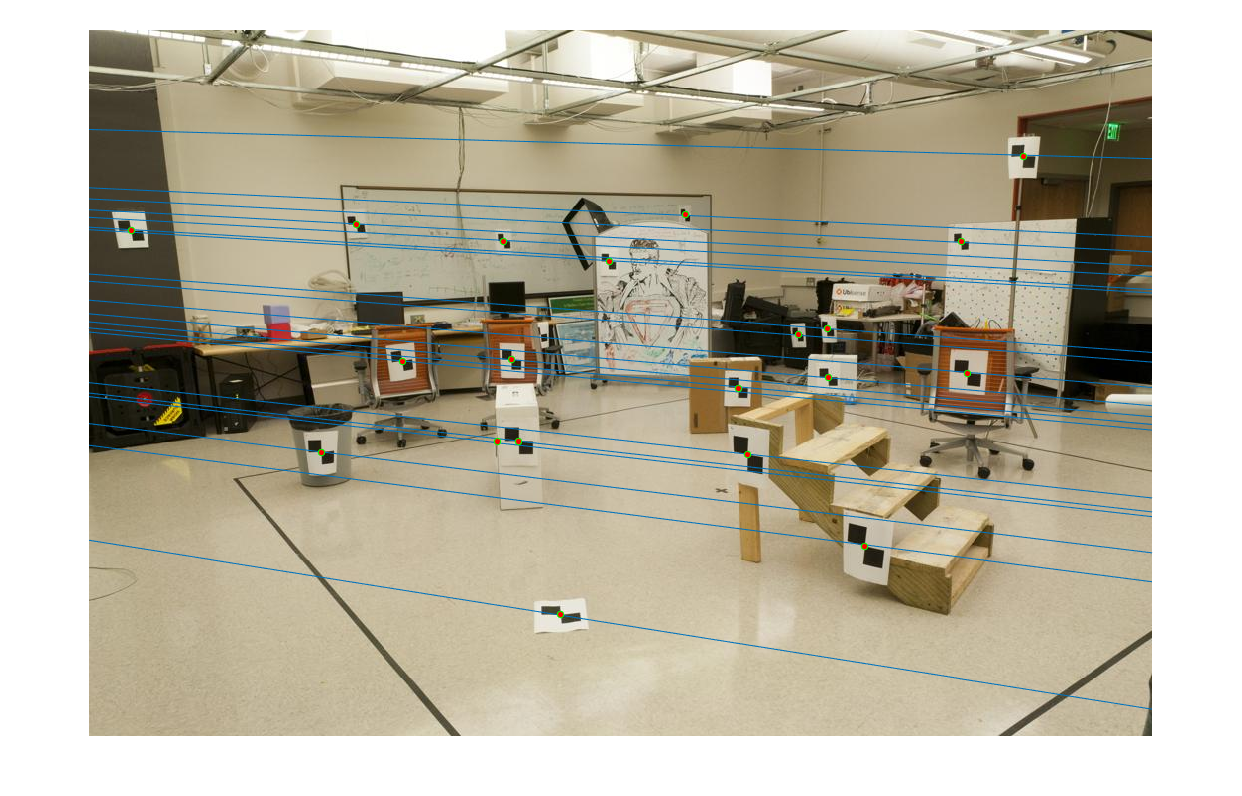
|
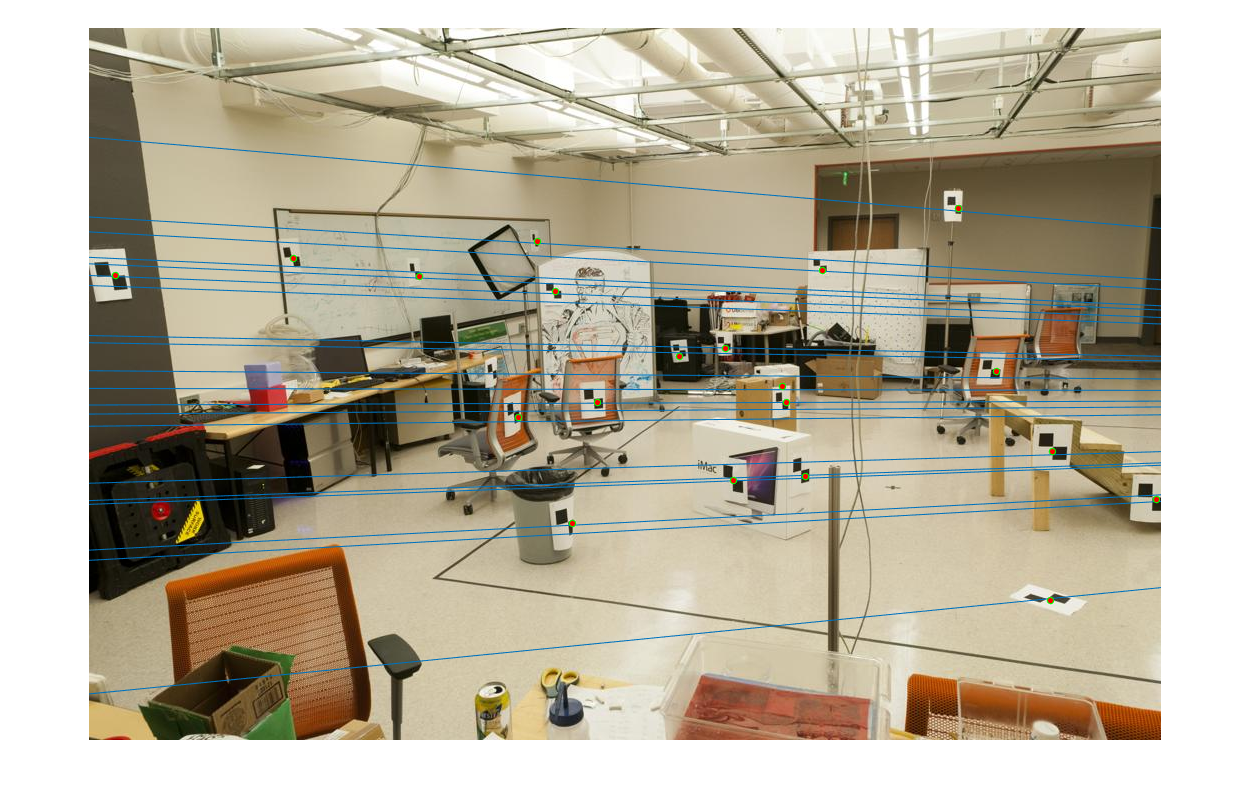
From left to right Epipolar lines in: Image Left, Image Right
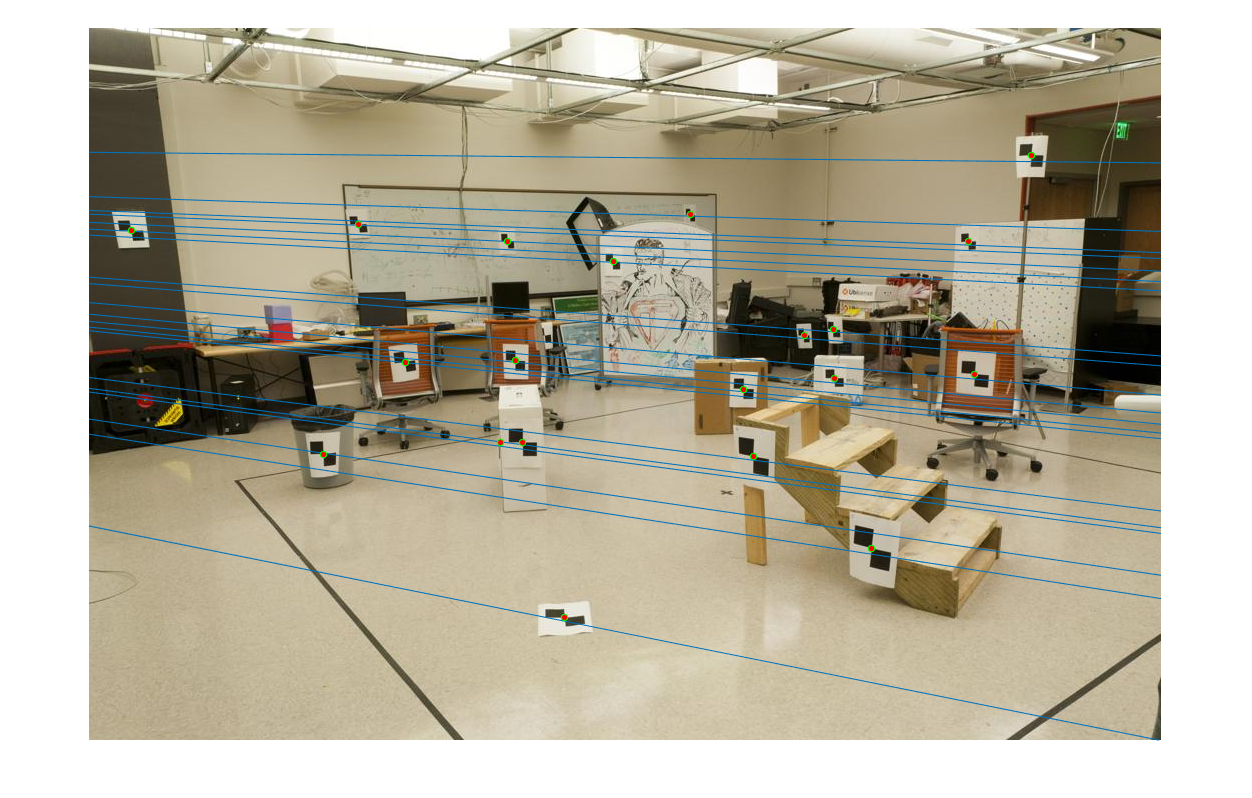
3. Fundamental matrix with RANSAC
Here I'm computing the fundamental matrix with unreliable point correspondences computed with SIFT. As discussed in class, least squares regression is not appropriate in this scenario due to the presence of multiple outliers. In order to estimate the fundamental matrix from this noisy data I used RANSAC in conjunction with your fundamental matrix estimation(normalized). Major steps in RANSAC
- Sample 8 matches and solve for fundamental matrix using these as inputs.
- Measure the number of inliers based on the threshold for the deviations of the x'Fx from zero.
- Update the current FMatrix as the best matrix if we have more number of inliers than the previous best one.
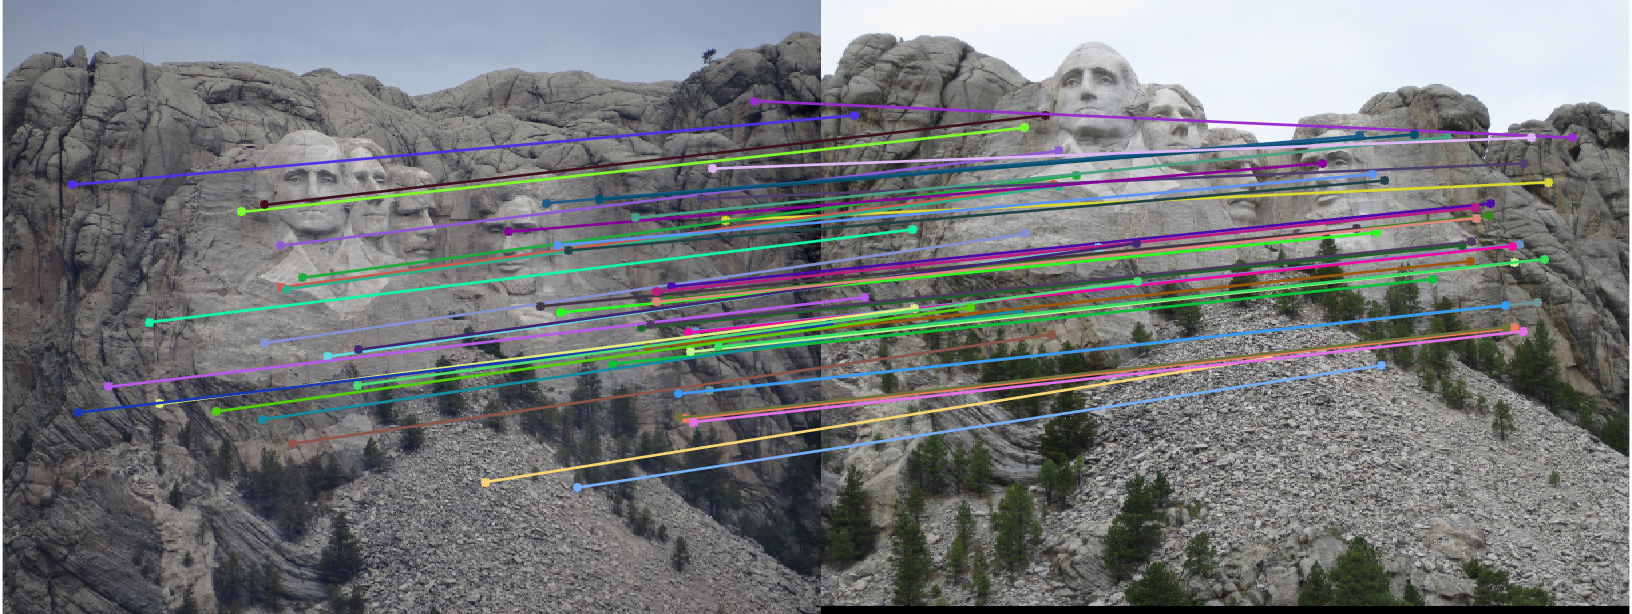
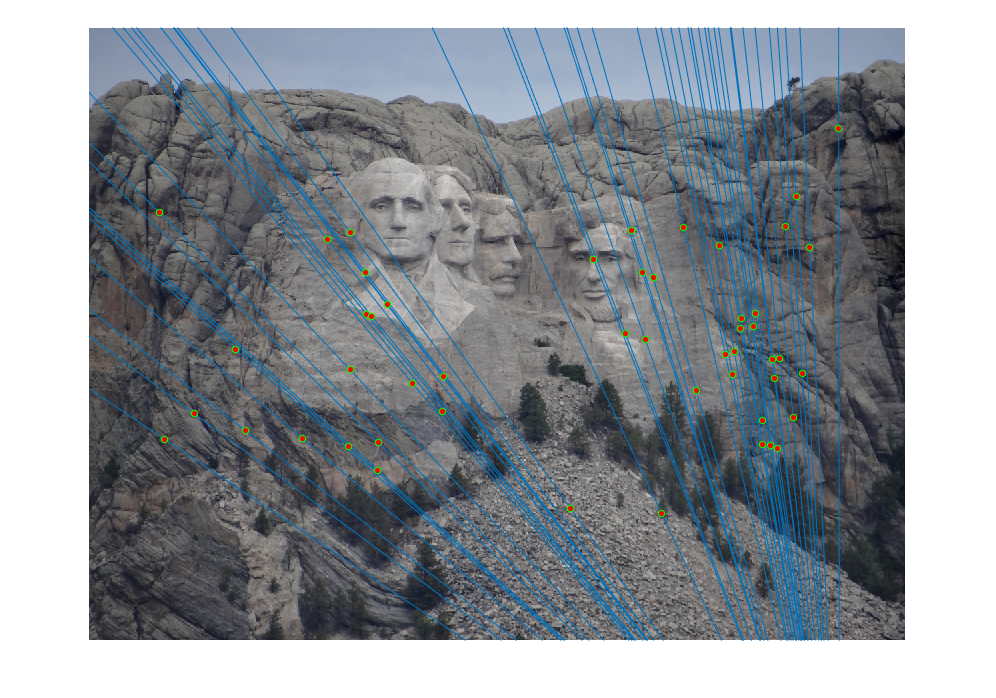
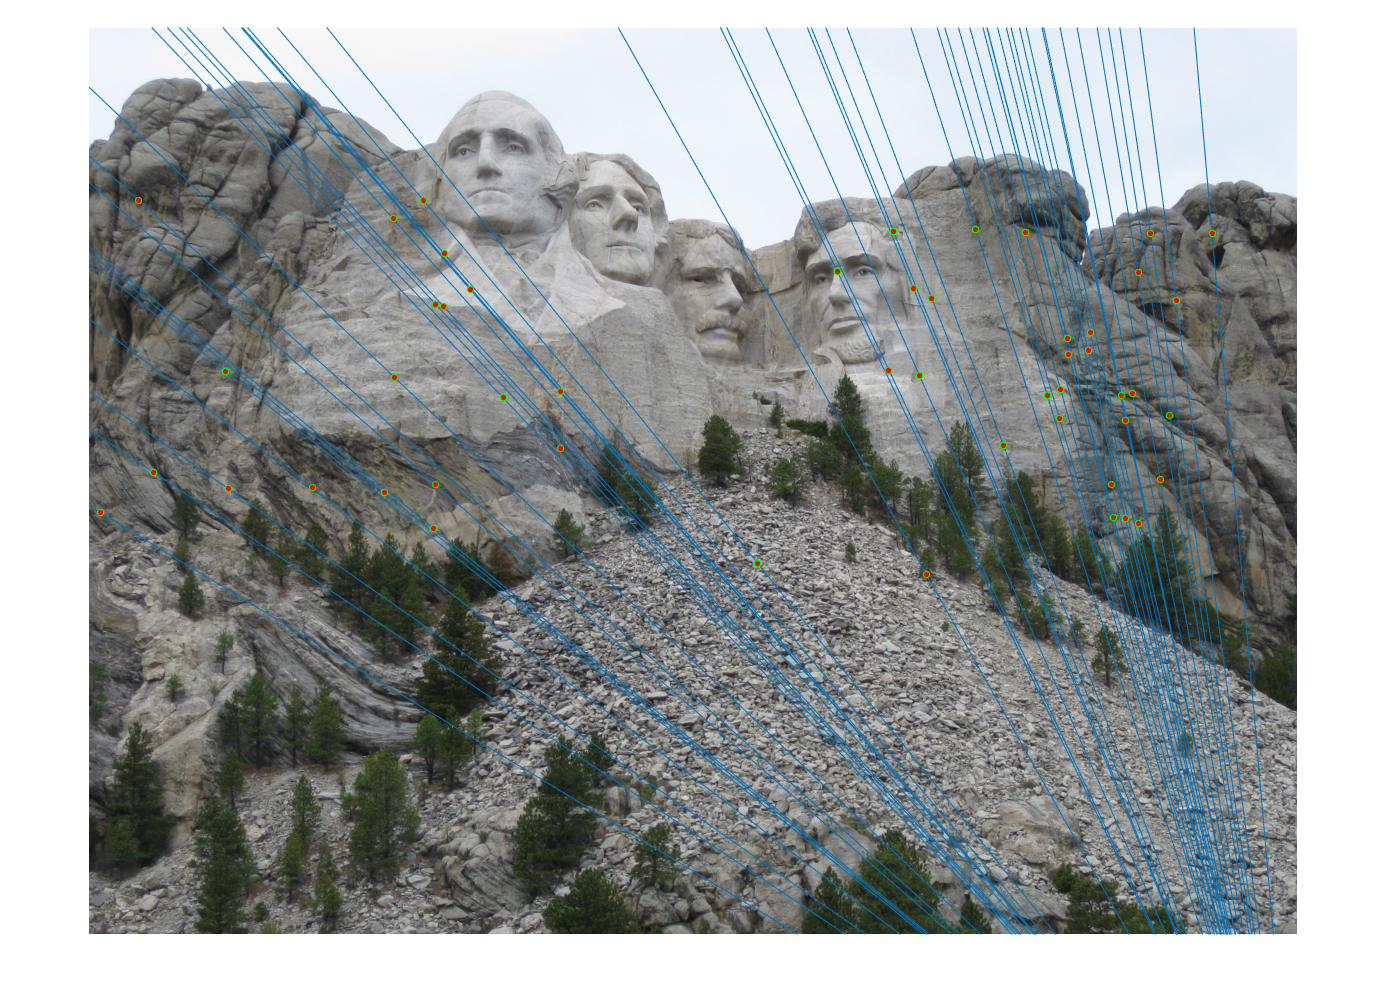
Dataset: Mount Rushmore
Threshold(abs deviation from zero) = 0.020
Number of iterations = 5000
Avg number of inliers = 430
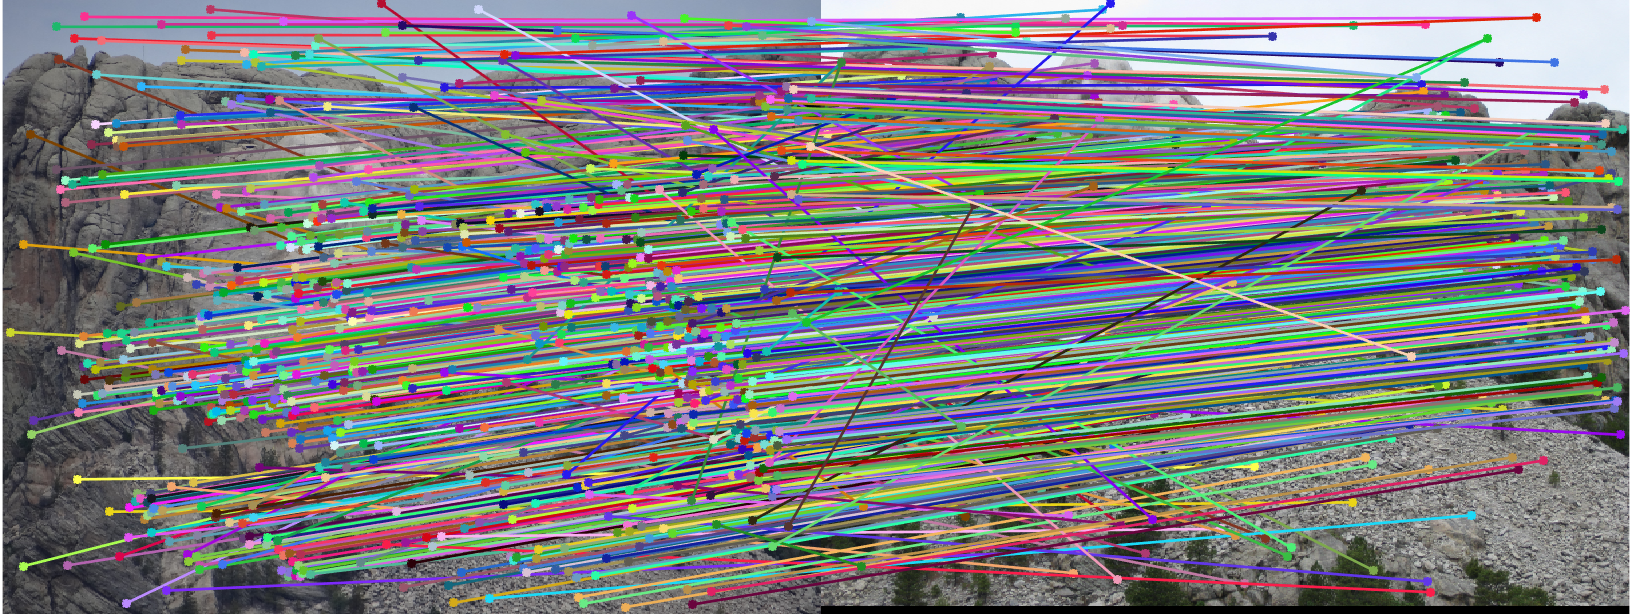
|
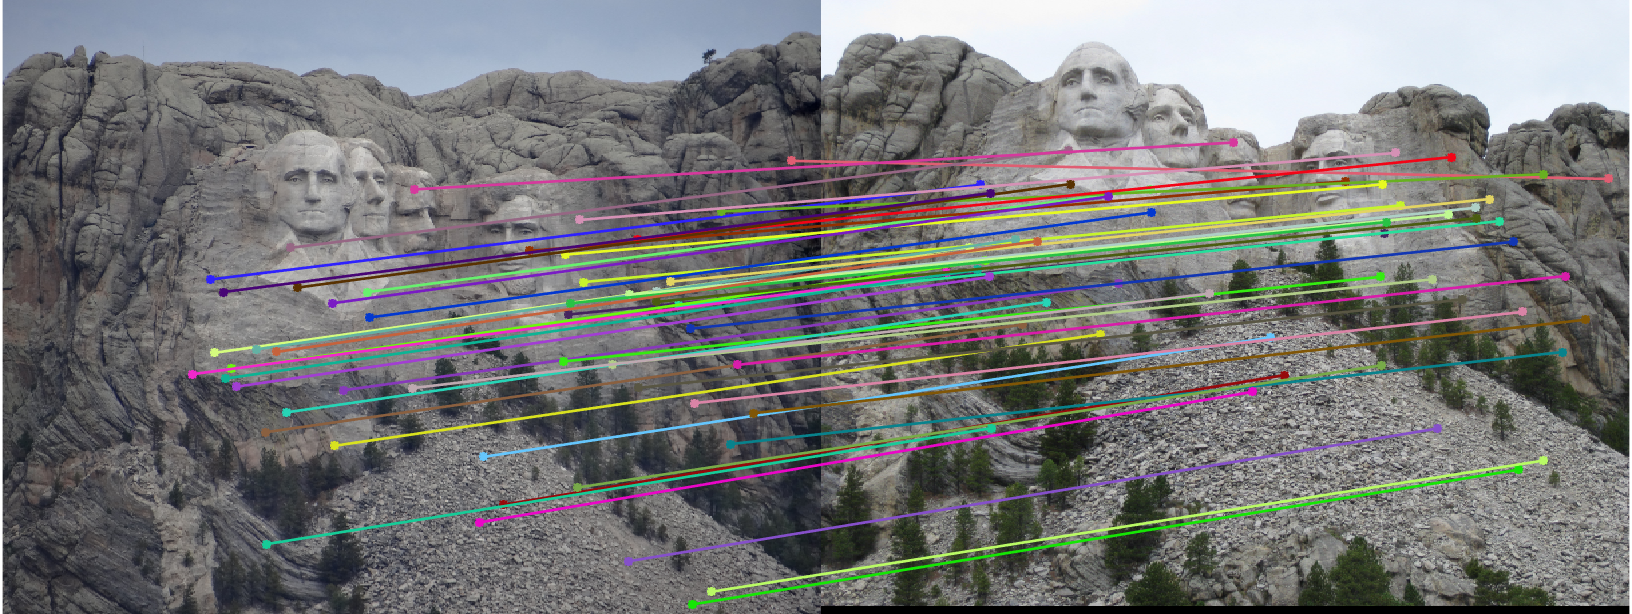
|
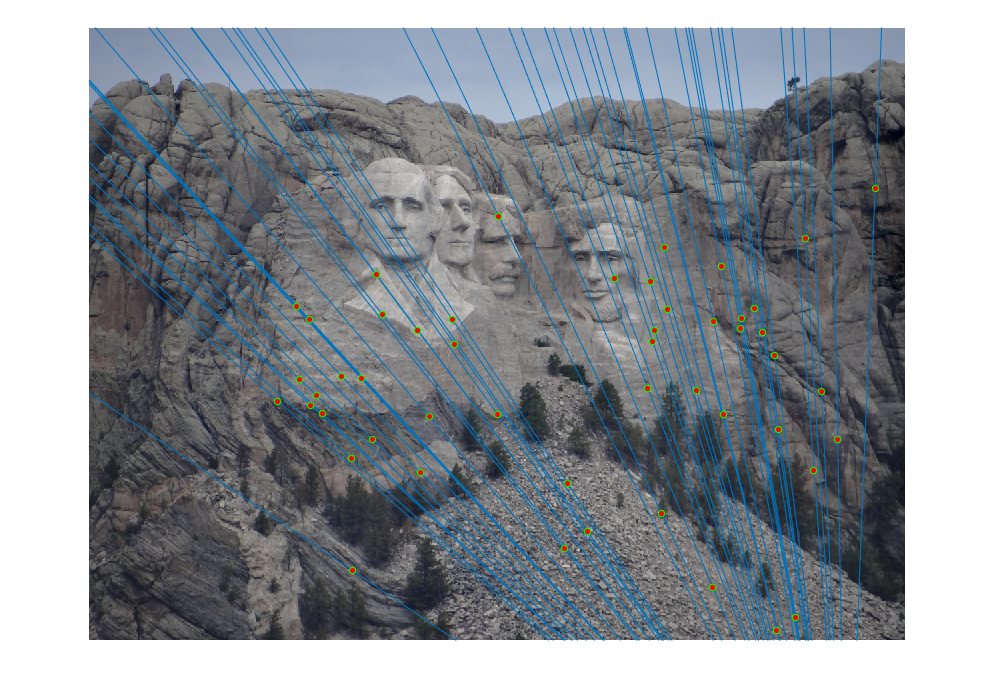
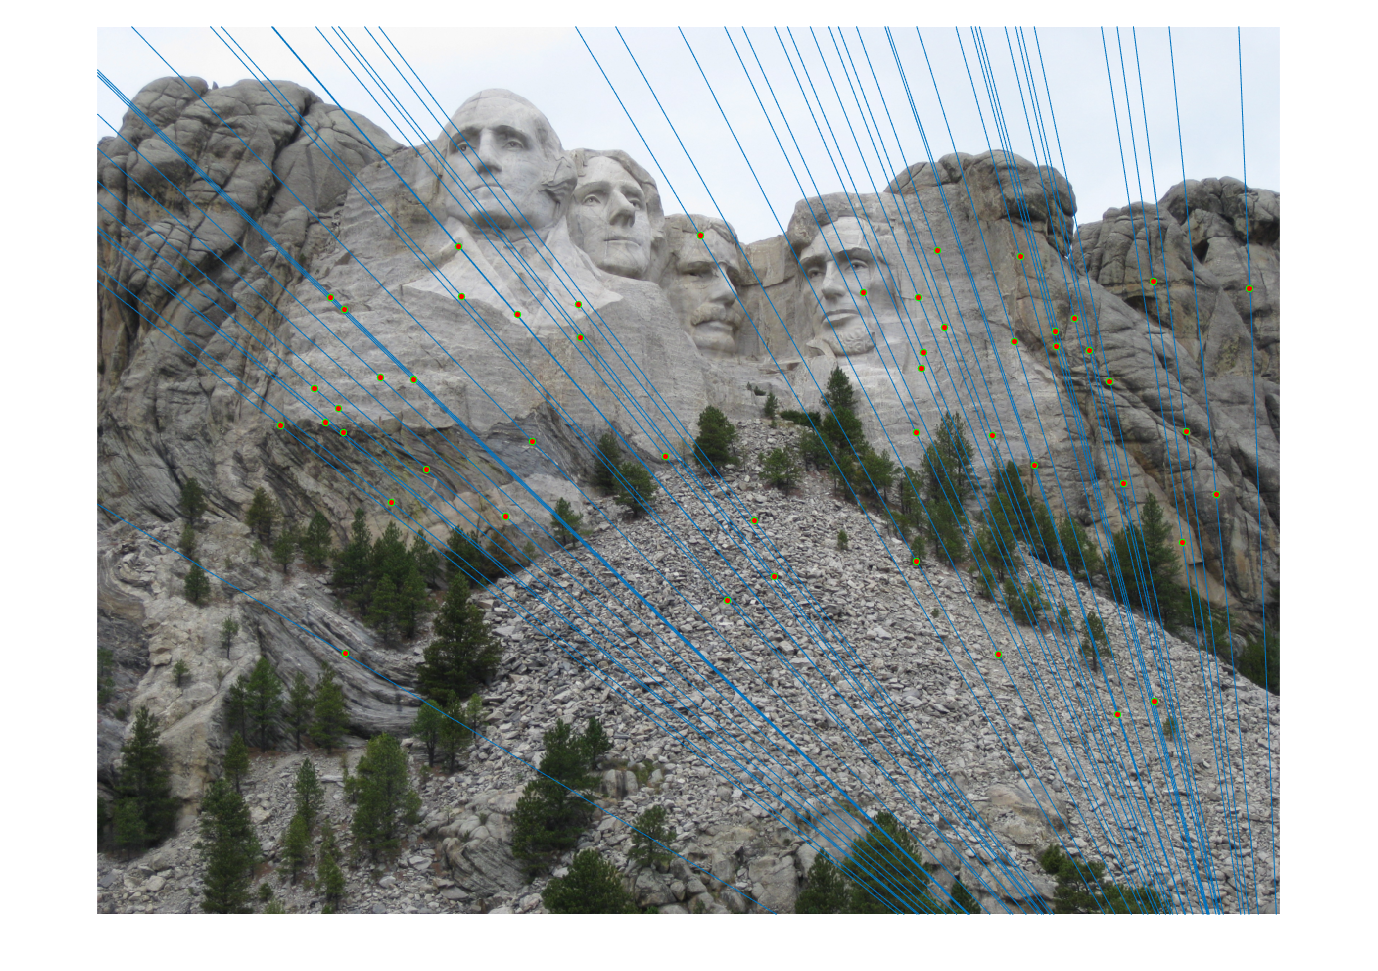
|
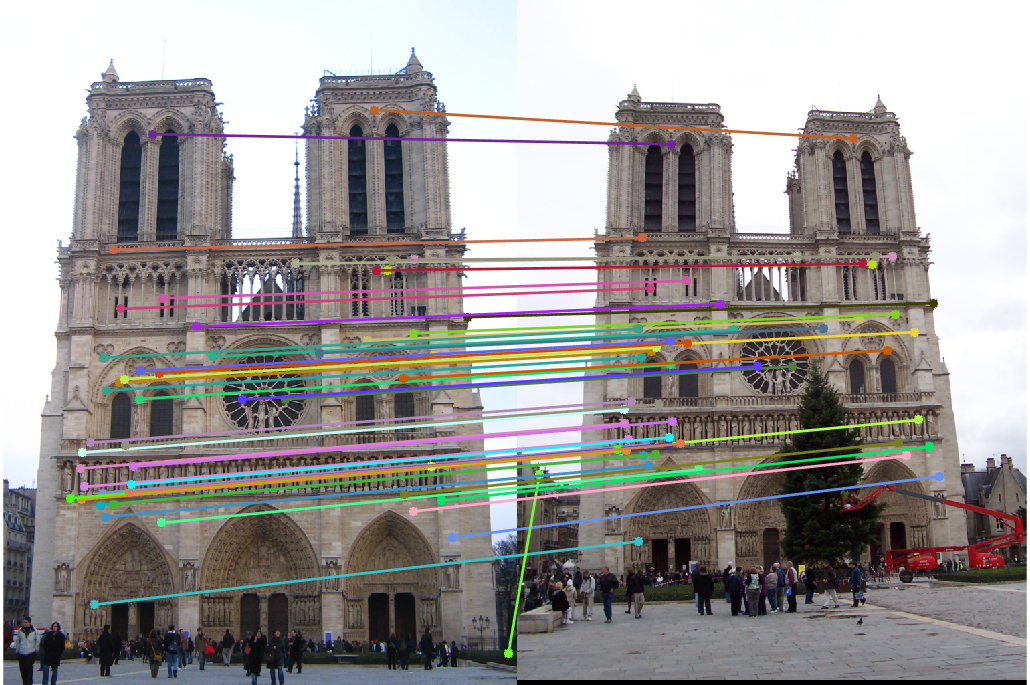
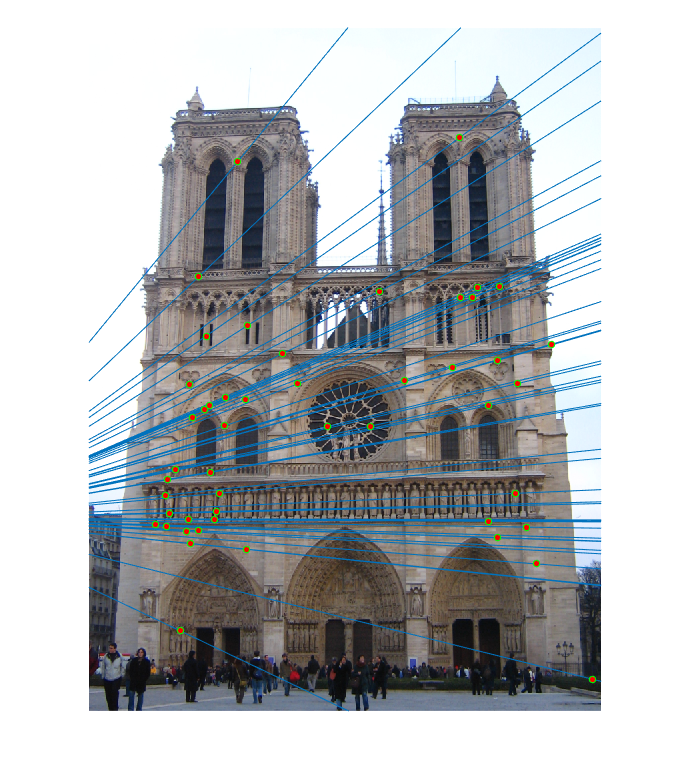
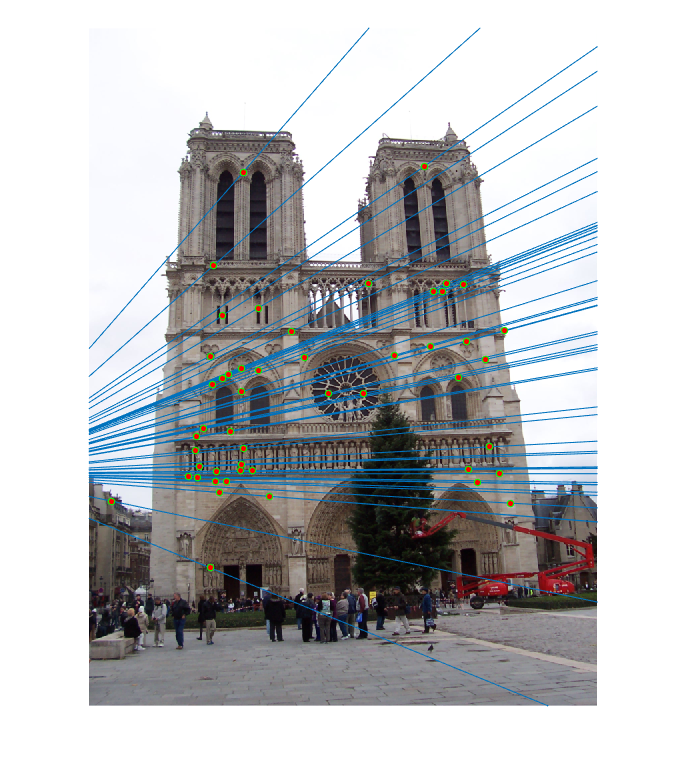
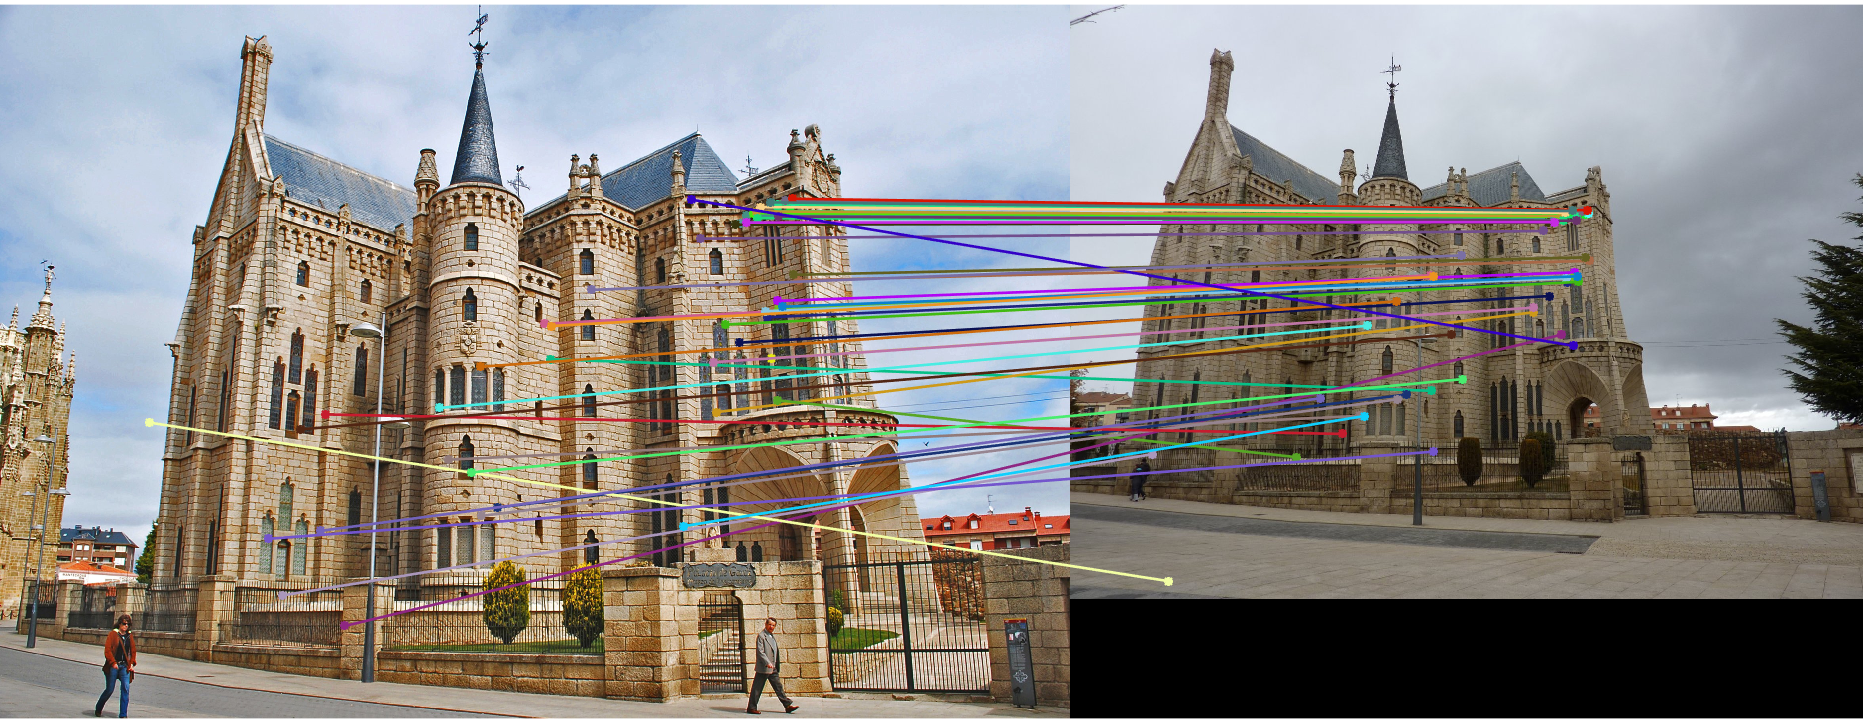
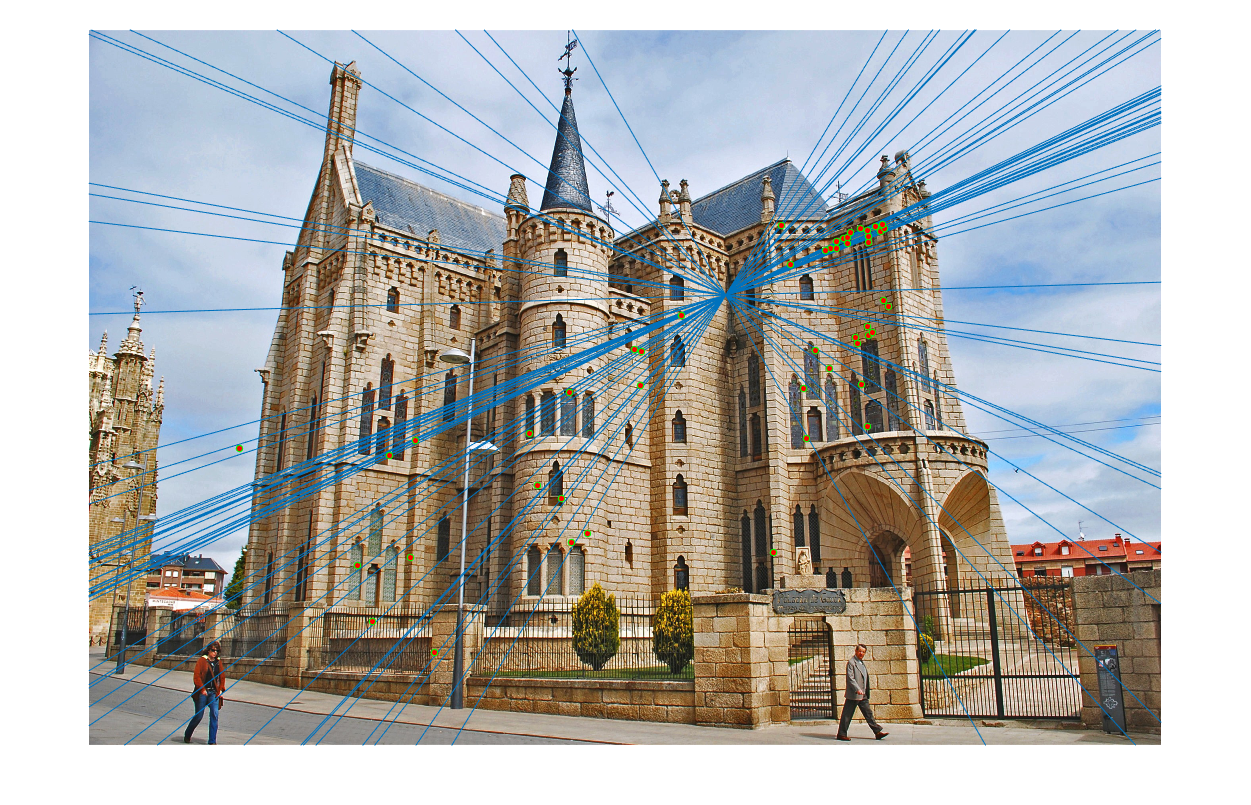
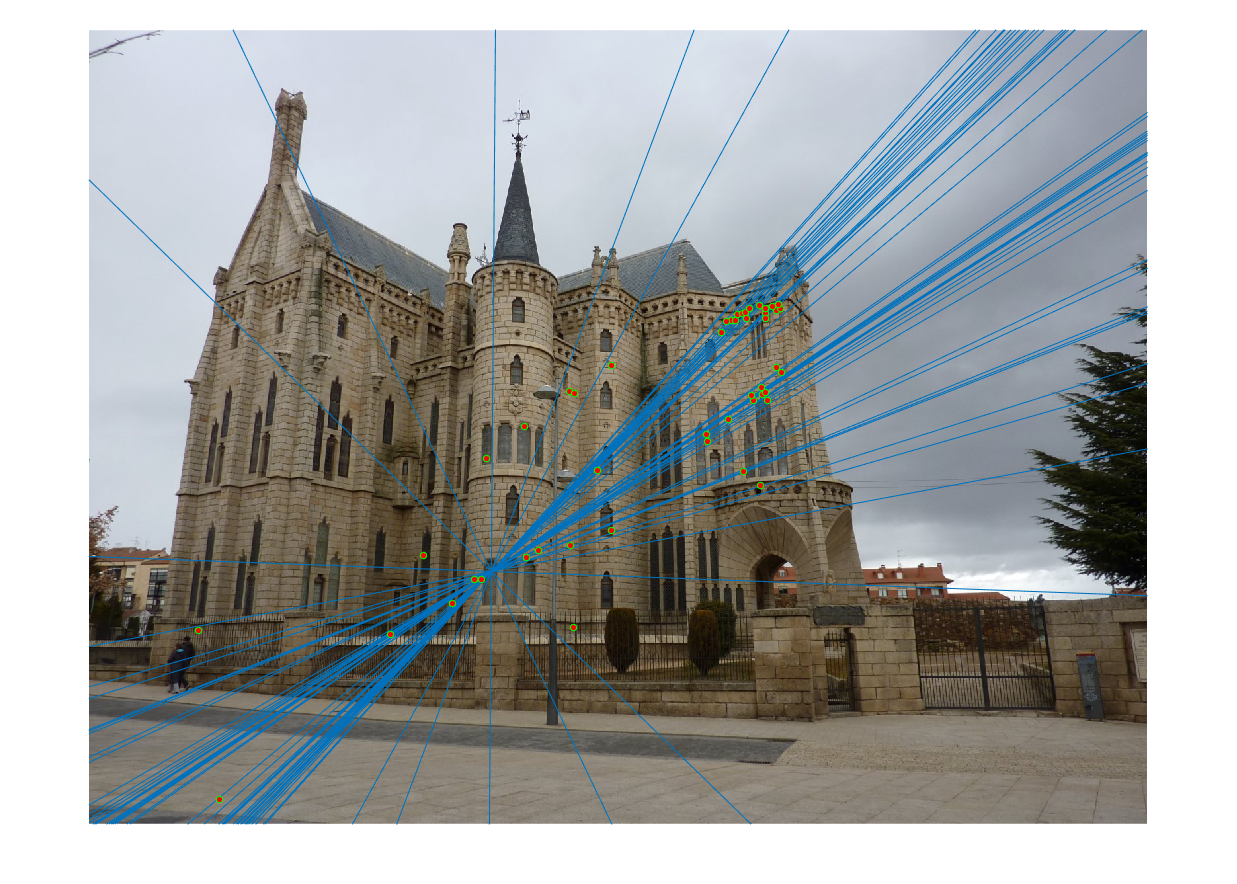
From top to bottom: Matches by sift wrapper. Top 50 matches selected by RANSAC, Epipolar lines obtained for left and right views
Dataset: Notre Dame
Threshold(abs deviation from zero) = 0.035
Number of iterations = 5000
Avg number of inliers = 402
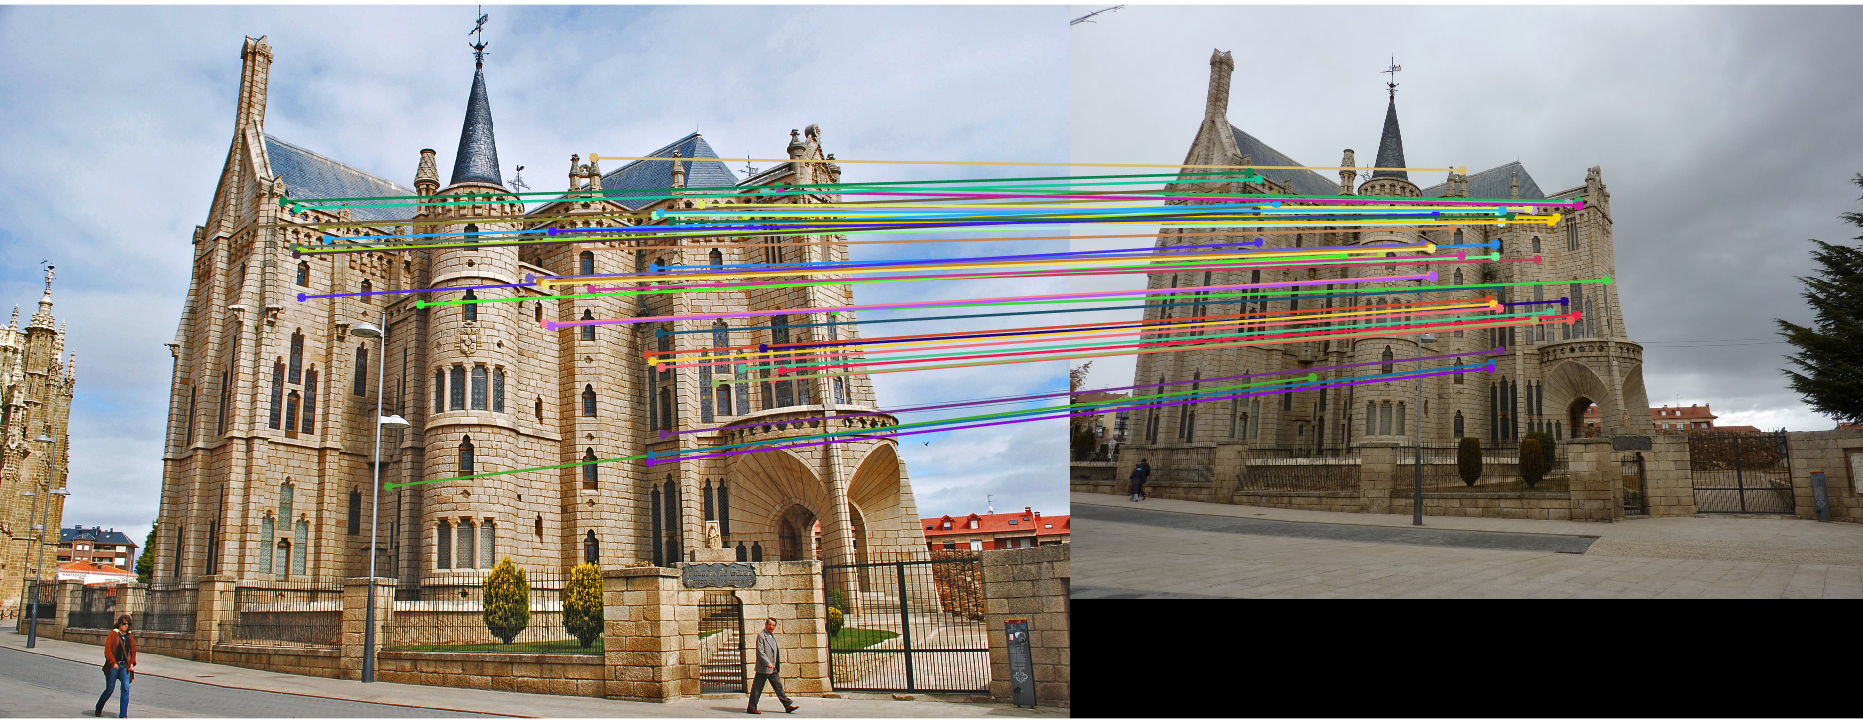
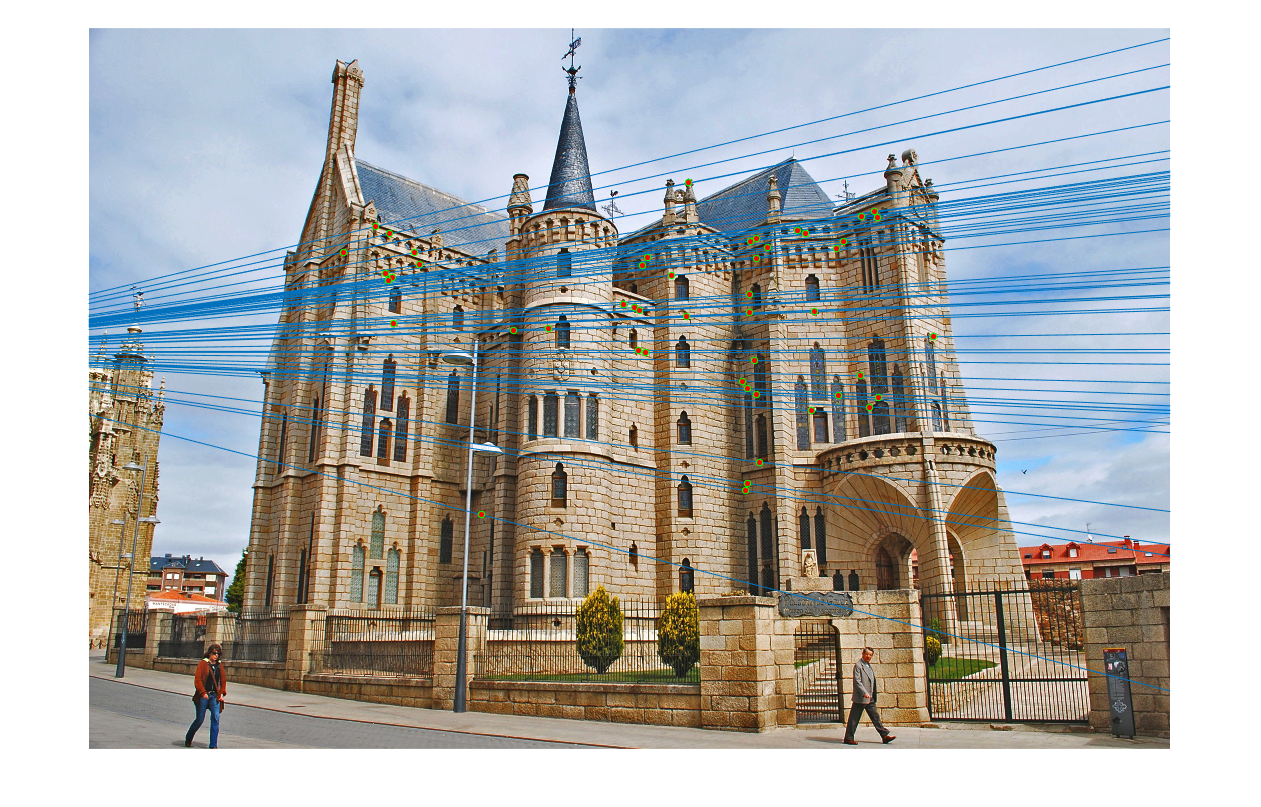
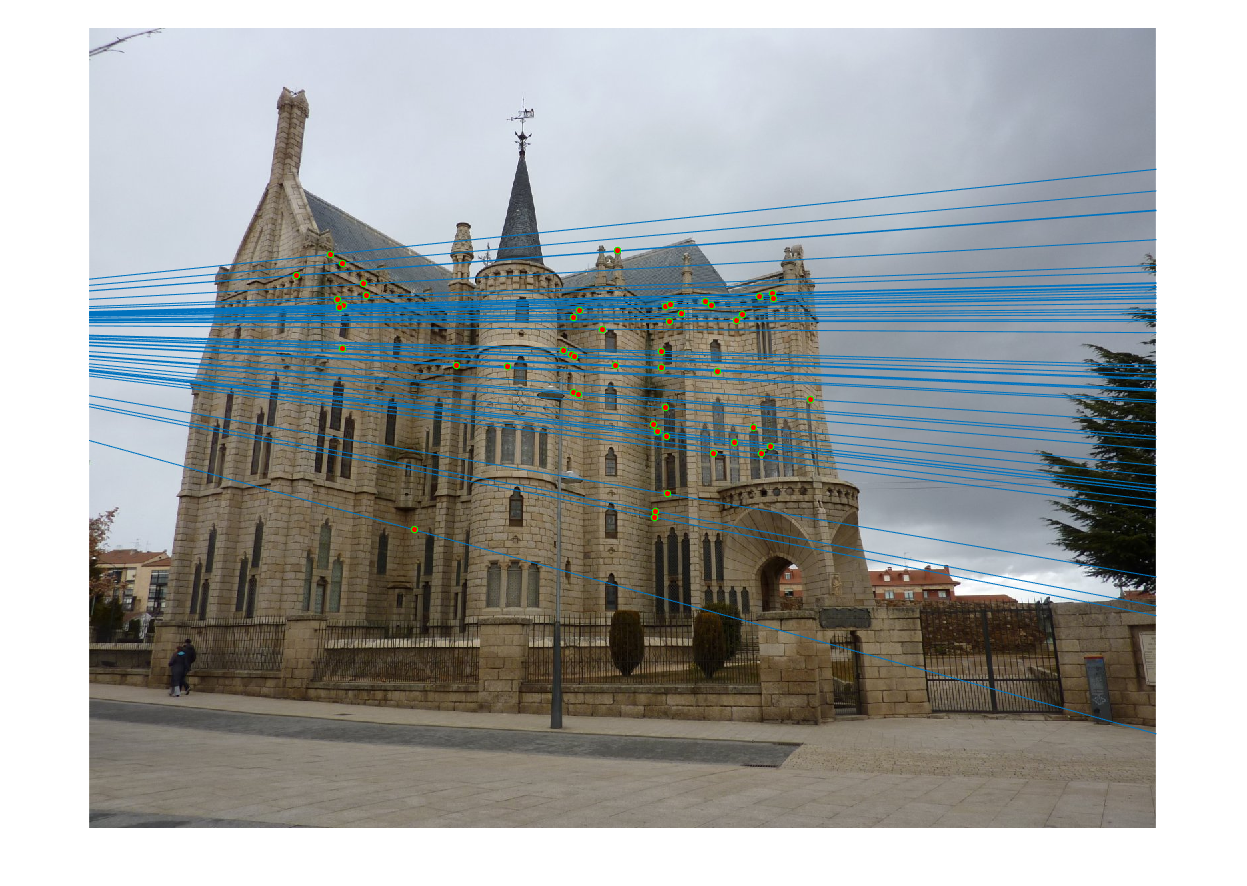
Dataset: Episcopal Gaudi
Threshold(abs deviation from zero) = 0.035
Number of iterations = 5000
Avg number of inliers = 390
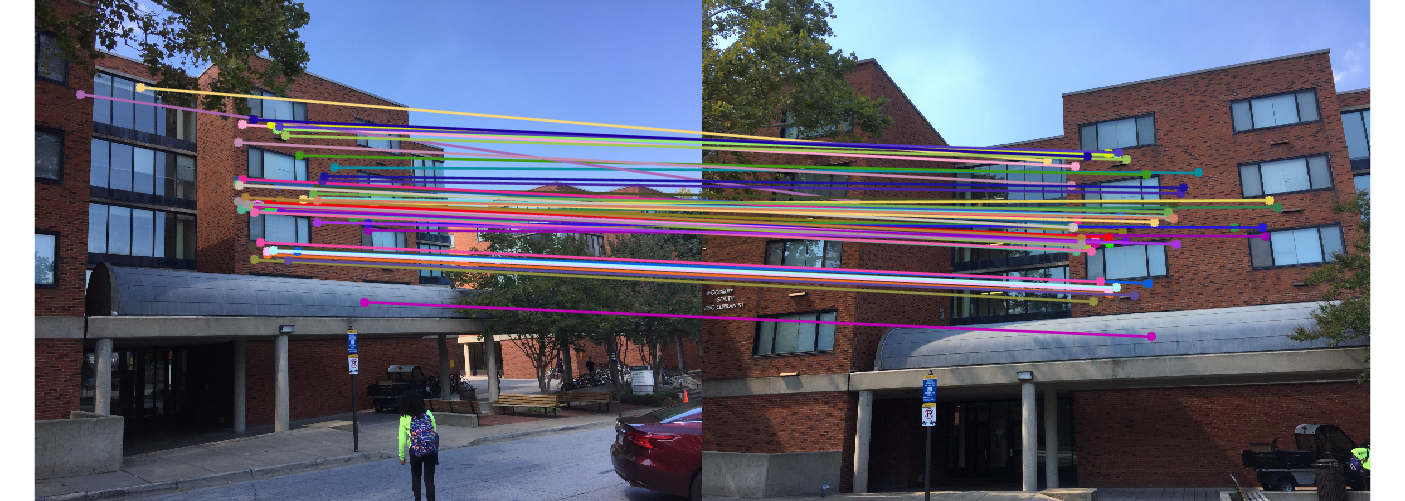
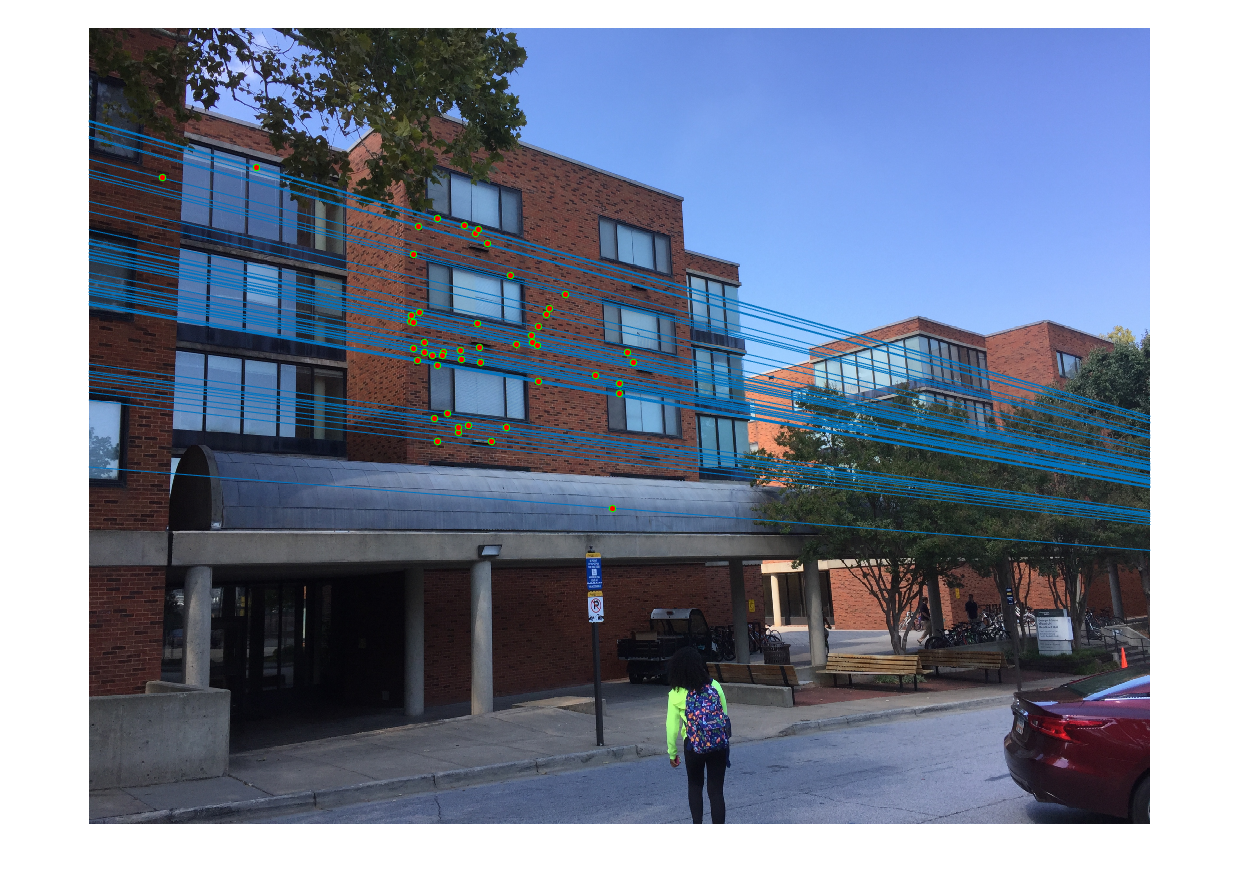
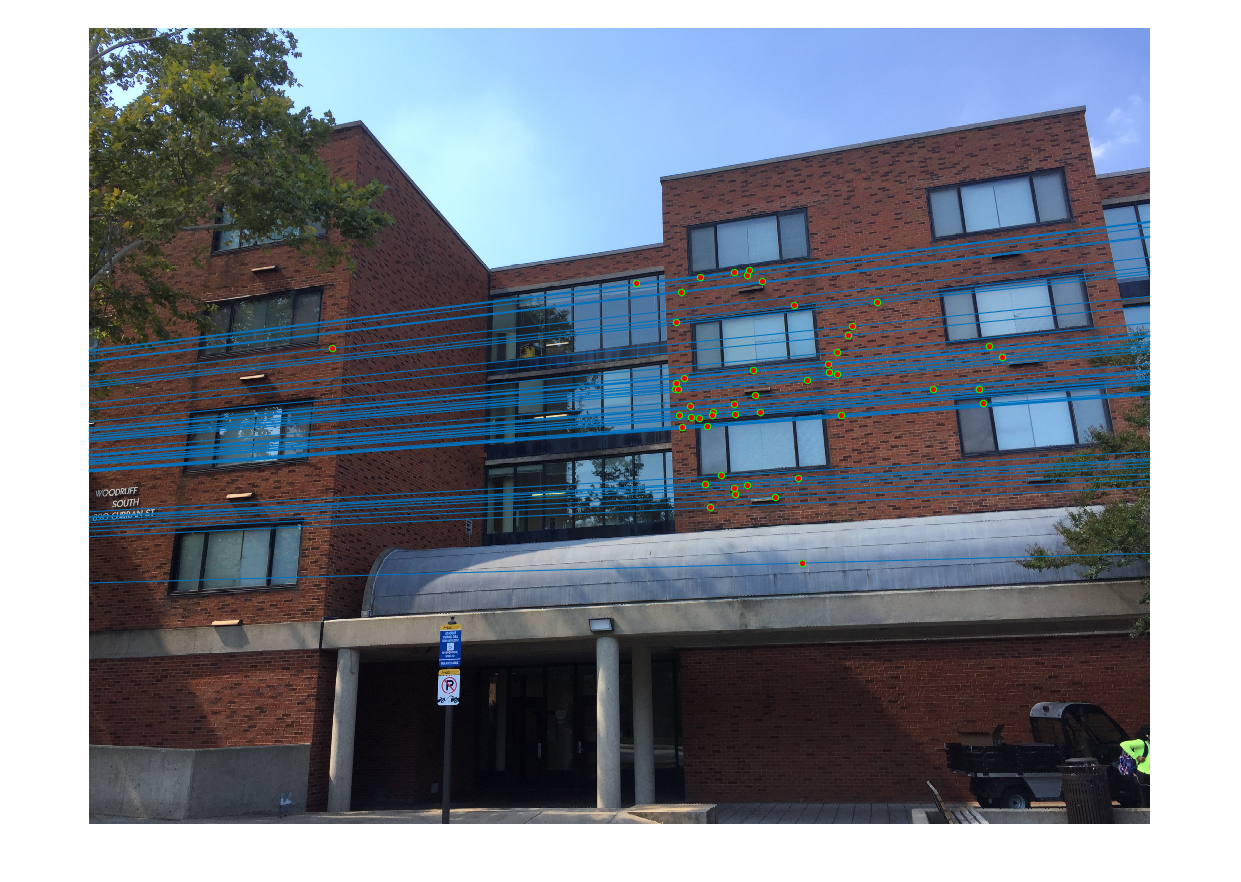
Dataset: Woodruff Dorm
Threshold(abs deviation from zero) = 0.085
Number of iterations = 5000
Avg number of inliers = 238
Extra Credits
Projection Matrix and Camera Center
1. Experiment with un-normalized points from 2-D to 3-D mapping
As we can see from the results, we obtained a high residual value. Surprisingly this is not apparent from the projected points vs actual points. But is visible in the camera center locations: .
- Projection matrix:
- Residual: 15.6217
- Camera Center: 303.0967, 307.1842, 30.4223
Fundamental matrix estimation
1. Normalization
- Here I 'm doing the normalization through linear transformations such that the mean of the points becomes zero and the average distance from center magnitude becomes about square root of 2.
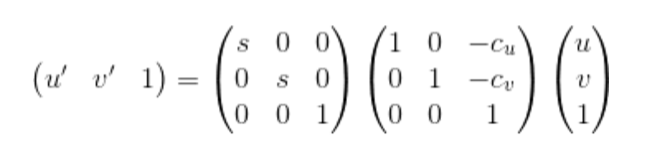
- The transform matrix T is the product of the scale and offset matrices. c_u and c_v are the mean coordinates. I have computed the scale using standard deviation
- To get new coordinates: Points_new = (T * Points_old')'
- To scale my coordinates back tothe original coordinates: Forig = TbT * Fnorm * Ta
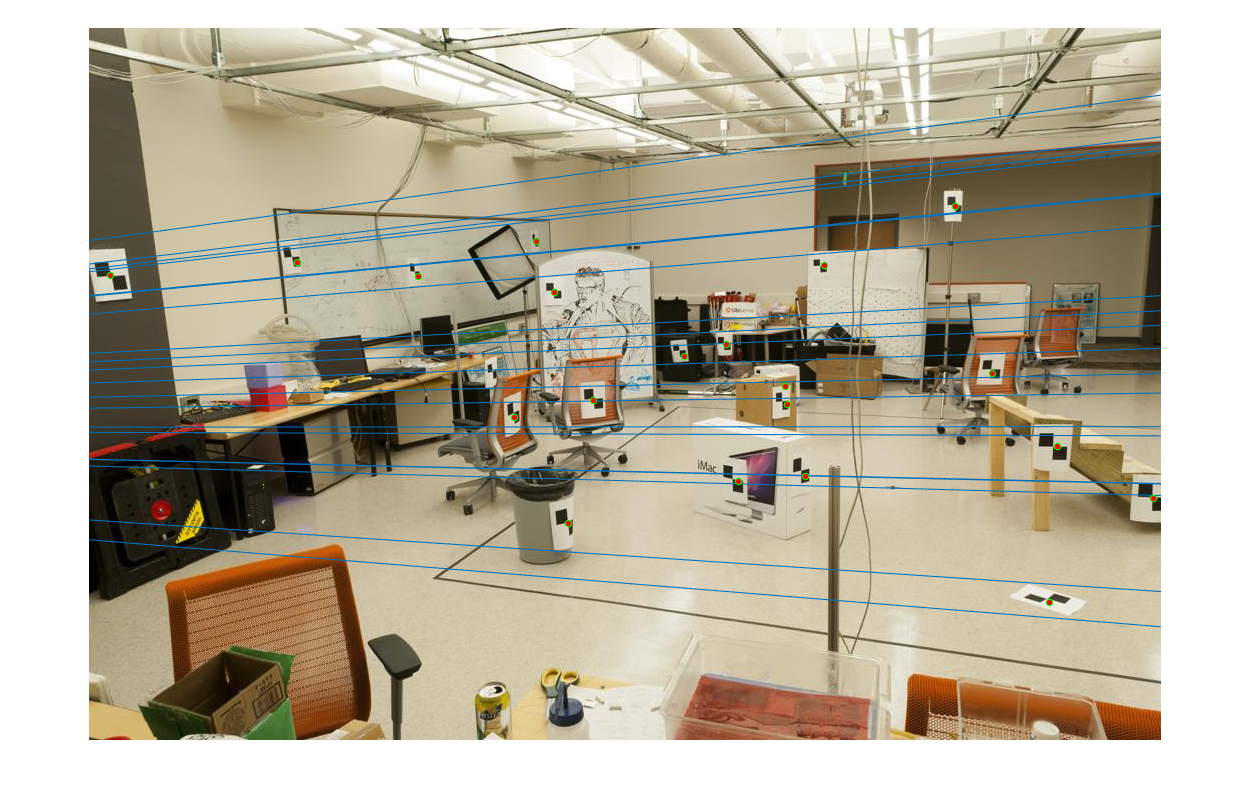
- Results: Although the improvements are not significant for this dataset, we can still see that epipolar lines are more accurate in this(passing through the points for all the points) compared to the un-normalized case(Few epipolar lines passing through the points)
Un-normalized
Normalized
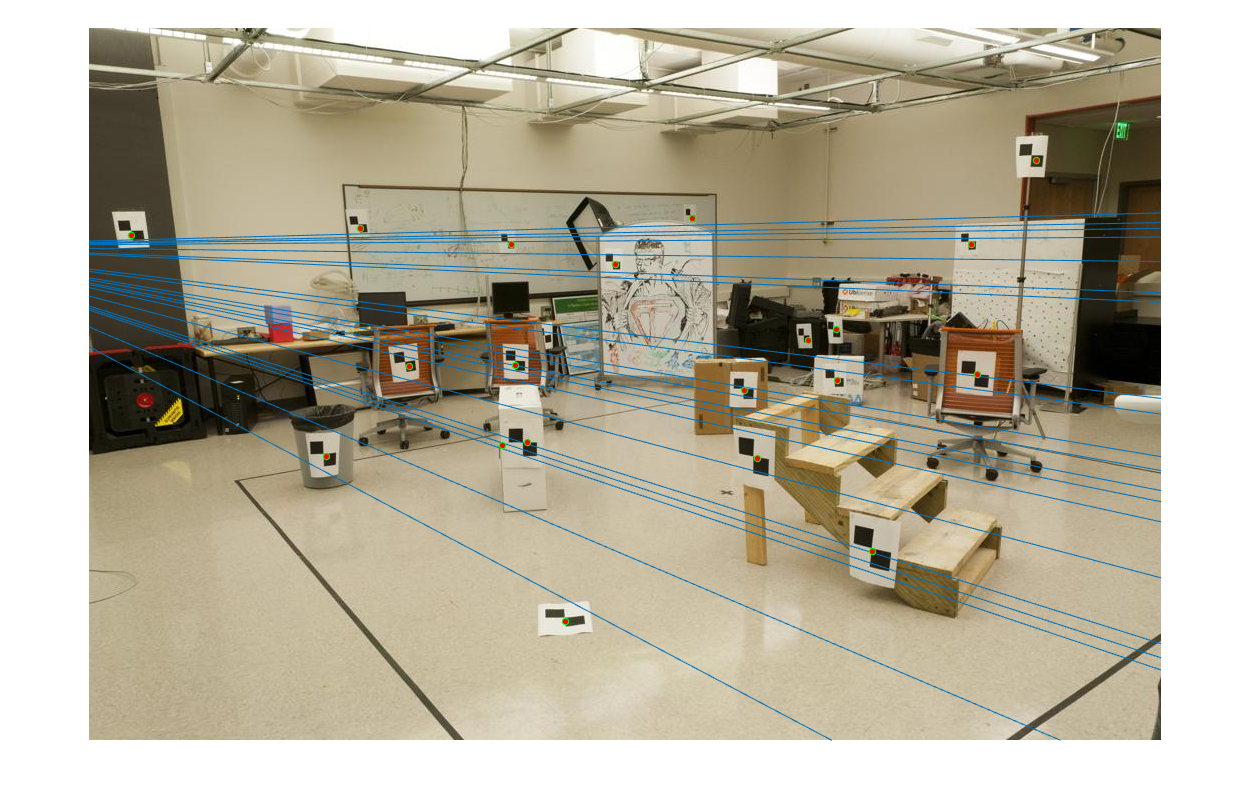
2. Experiment with noisy data
The performance enhancement by normalization is more visible here where we added some noise to the points data. We can see here, with normalization it performs much better with normalization, although not as good as without noise.
Un-normalized
Normalized
Fundamental matrix with RANSAC
1. Normalization experiment with RANSAC
Clearly in case of Gaudi the improvement in the matches and the epipolar lines is significant when using normalization in F matrix calculation. But in the case of Mount rushmore the difference is very minimum as most of the initial matches are correct by SIFT.
Un-normalized
Normalized
Un-normalized
Normalized