Project 3: Camera Calibration and Fundamental Matrix
Estimating Projection Matrix and Camera Center
First, I estimated the Projection Matrix between the 2d and 3d points. In order to do this, we derived a homogenous equation from the projection matrix equation and then fixed the last value in the matrix to 1 to create this equation in the form Ax=B.
                                                     [M11       [ u1

                                                      M12         v1

                                                      M13         .

                                                      M14         .

[ X1 Y1 Z1 1 0  0  0  0 -u1*X1 -u1*Y1 -u1*Z1          M21         .

  0  0  0  0 X1 Y1 Z1 1 -v1*X1 -v1*Y1 -v1*Z1          M22         .

  .  .  .  . .  .  .  .    .     .      .          *  M23   =     .

  Xn Yn Zn 1 0  0  0  0 -un*Xn -un*Yn -un*Zn          M24         .

  0  0  0  0 Xn Yn Zn 1 -vn*Xn -vn*Yn -vn*Zn ]        M31         .

                                                      M32         un

                                                      M33         vn ]
I then solved this using the matlab mldivide function to estimate x.
Using the projection matrix, we then derived the center from the calculated Projection Matrix.
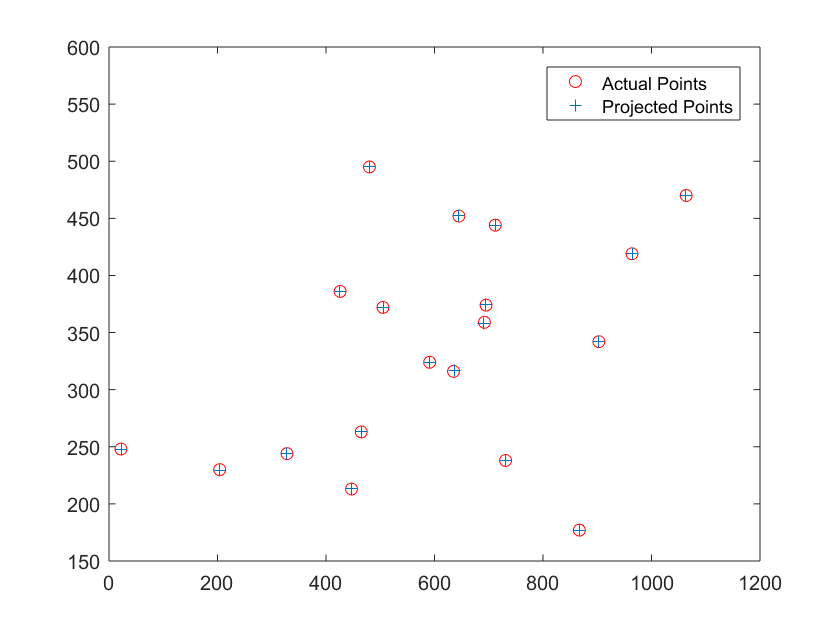
The below graph shows the accuracy between the Projected points estimated from the Projection Matrix and the actual projected points.
Estimating Fundamental Matrix using Linear Regression
I estimated the Fundamental Matrix between matched points from two images using the 8 point method. From the equation converting points from one image to another using the Fundamental Matrix, we derived the following homogenous equation

We then set up an equation in the form Ax=0 with the x being the values in the fundamental matrix and used SVD find a least squares solution for x. We then used SVD again to reduce the rank of the fundmental matrix to 2 to keep the contraints on the Fundamental matrix.
Below the results for running this on two images with accurate point mappings
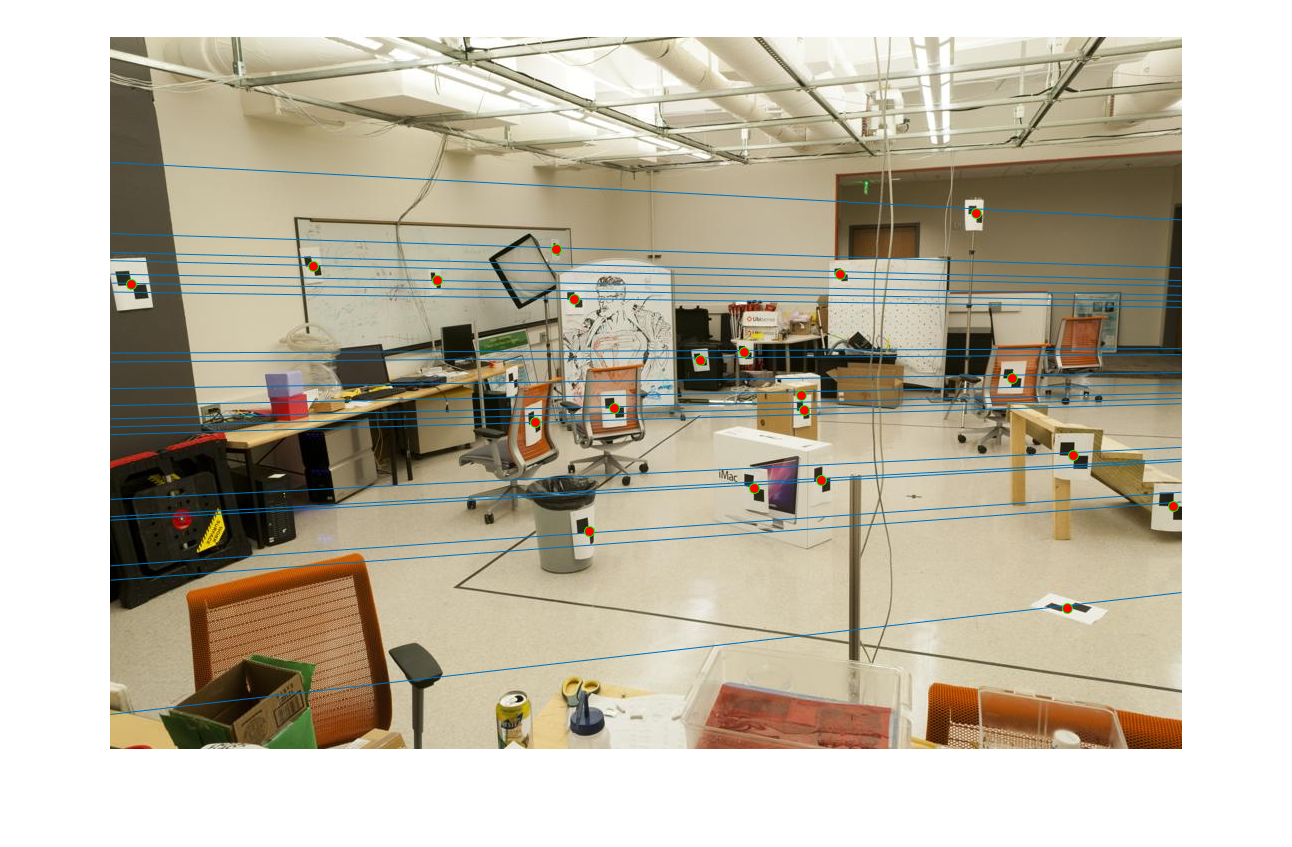
Image 1 with Epipolar lines |
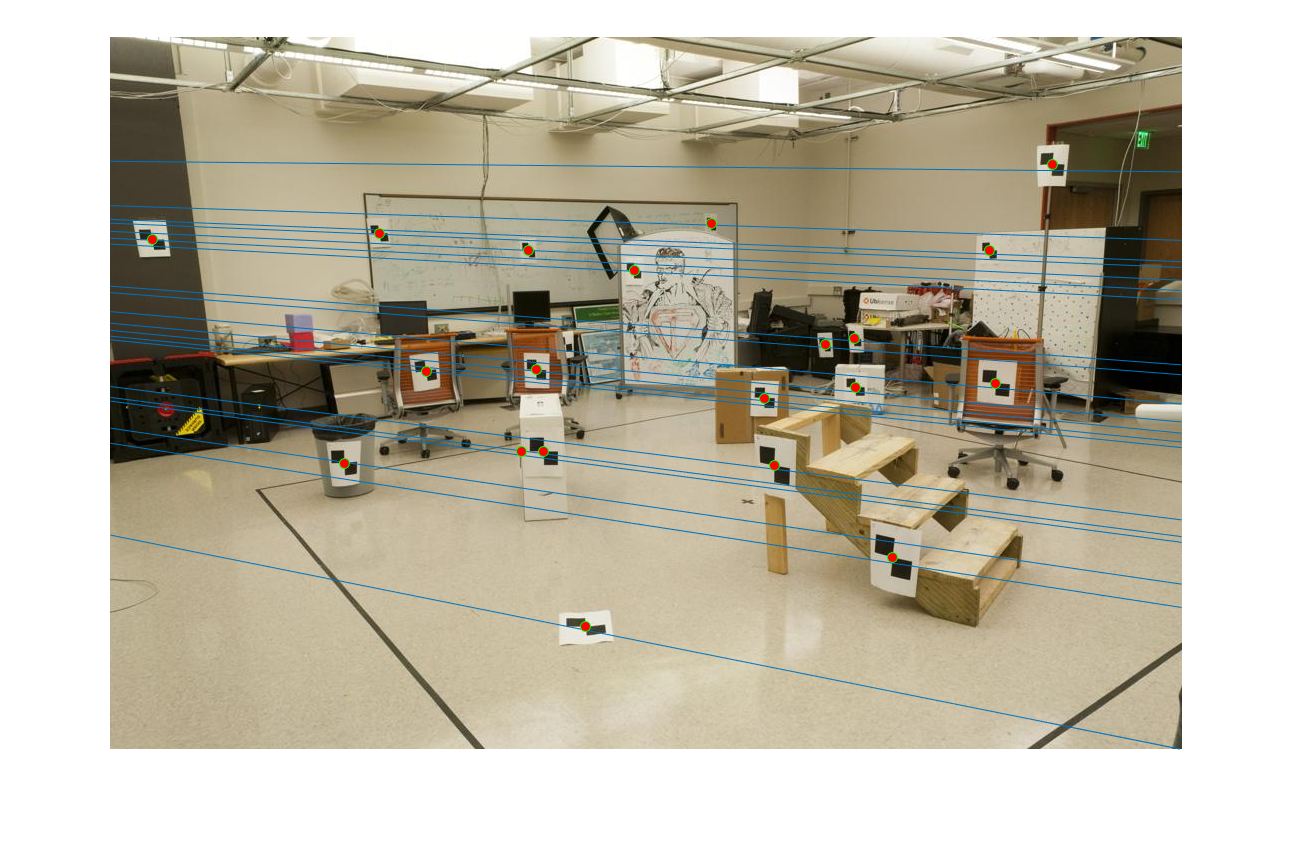
Image 2 with Epipolar lines |
Calculated Fundamental Matrix-0.0000 0.0000 -0.0019 0.0000 0.0000 0.0172 -0.0009 -0.0264 0.9995 |
|
Estimating Fundamental Matrix with Ransac with points matched using SIFT
Linear Regression calculates the Fundamental Matrix well with good matches, but is bad with a mix of good and bad matches such as the results of the SIFT keypoint matching algorithm. In order to solve this issue, we we use Ransac to seperate inliers from outliers while finding the Fundamental Matrix. We use the same 8 point algorithm in order to build possible Fundamental Matrices in Ransac and then calculate inliers and outliers to the model using thresholding. We do this multiple times building models from random points and then use the largest inlier group foudn to calculate a final Fundamental matrix with linear regression.
Below are some of the results of using this method
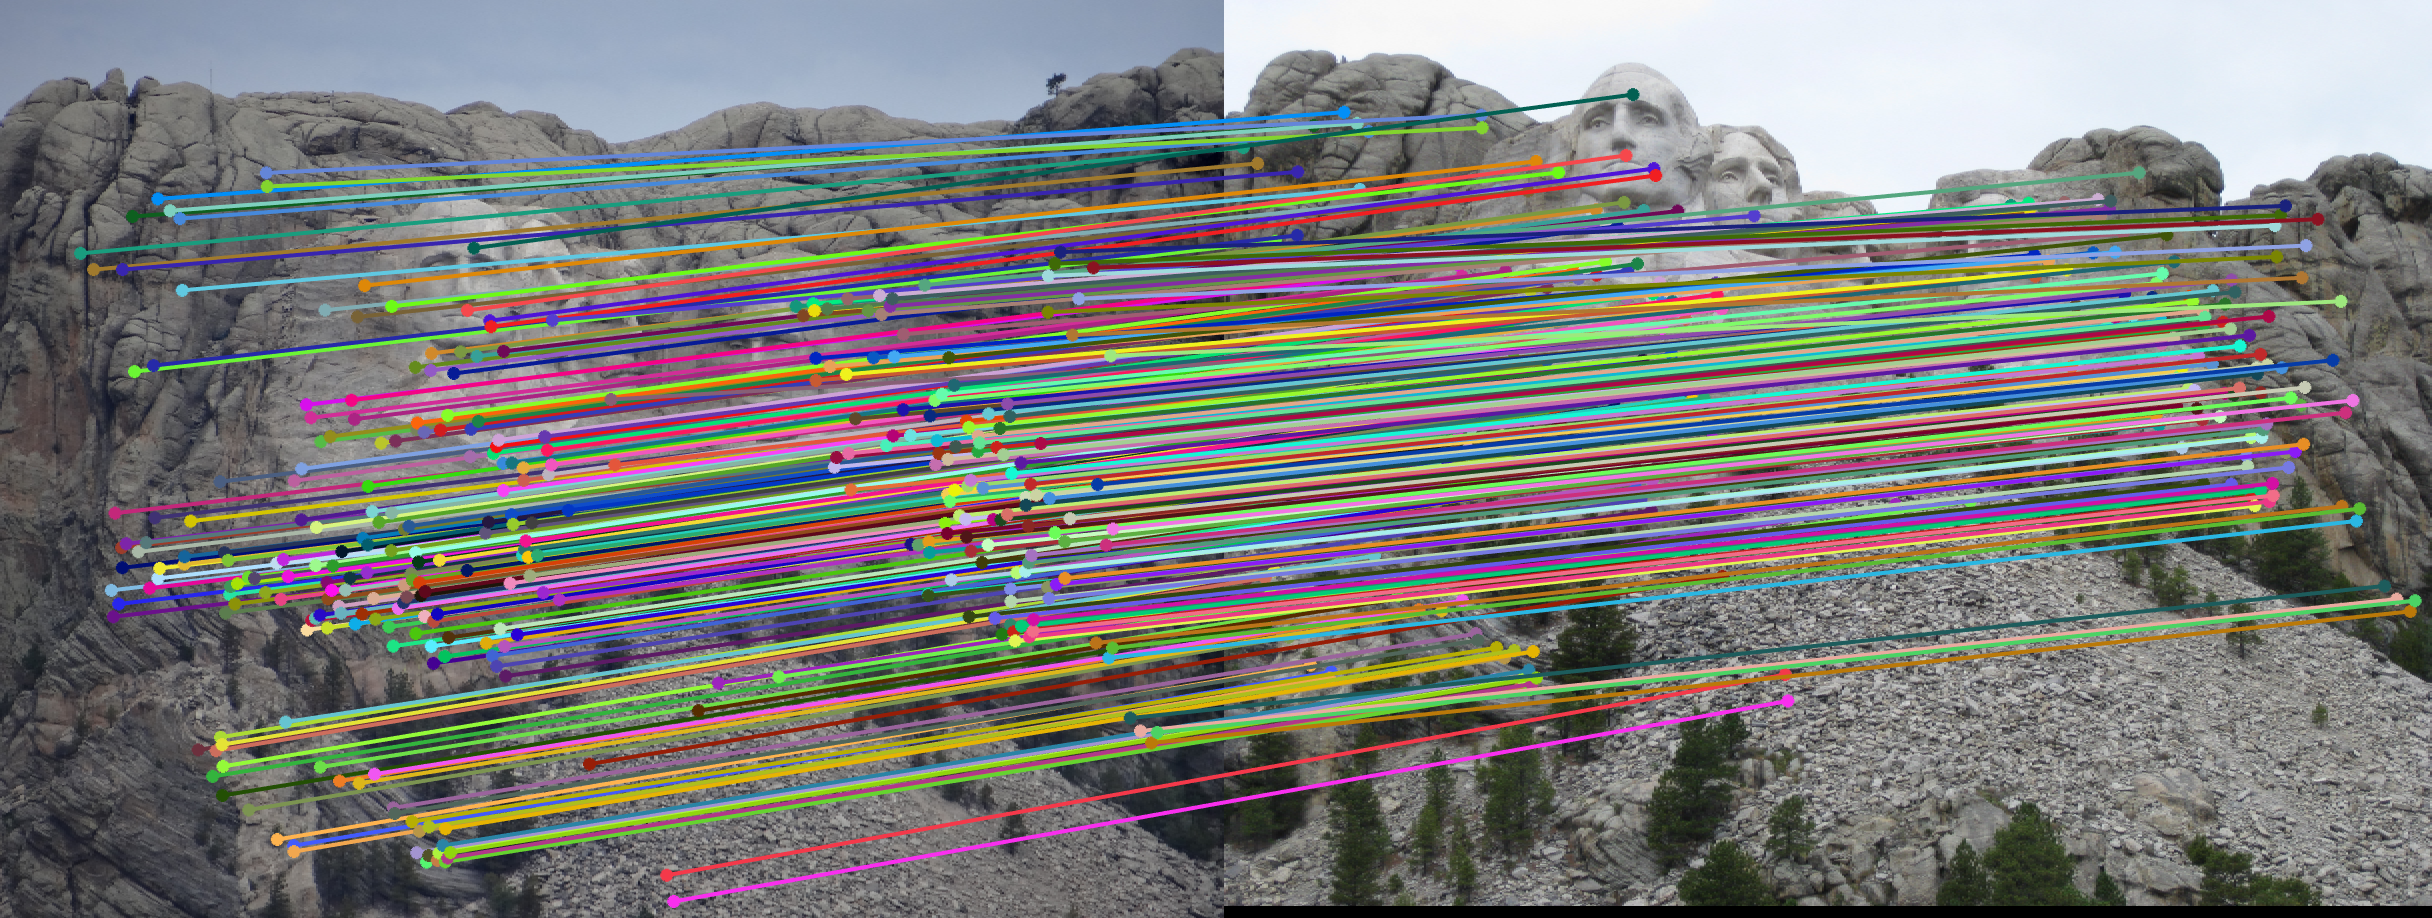
Mount Rushmore
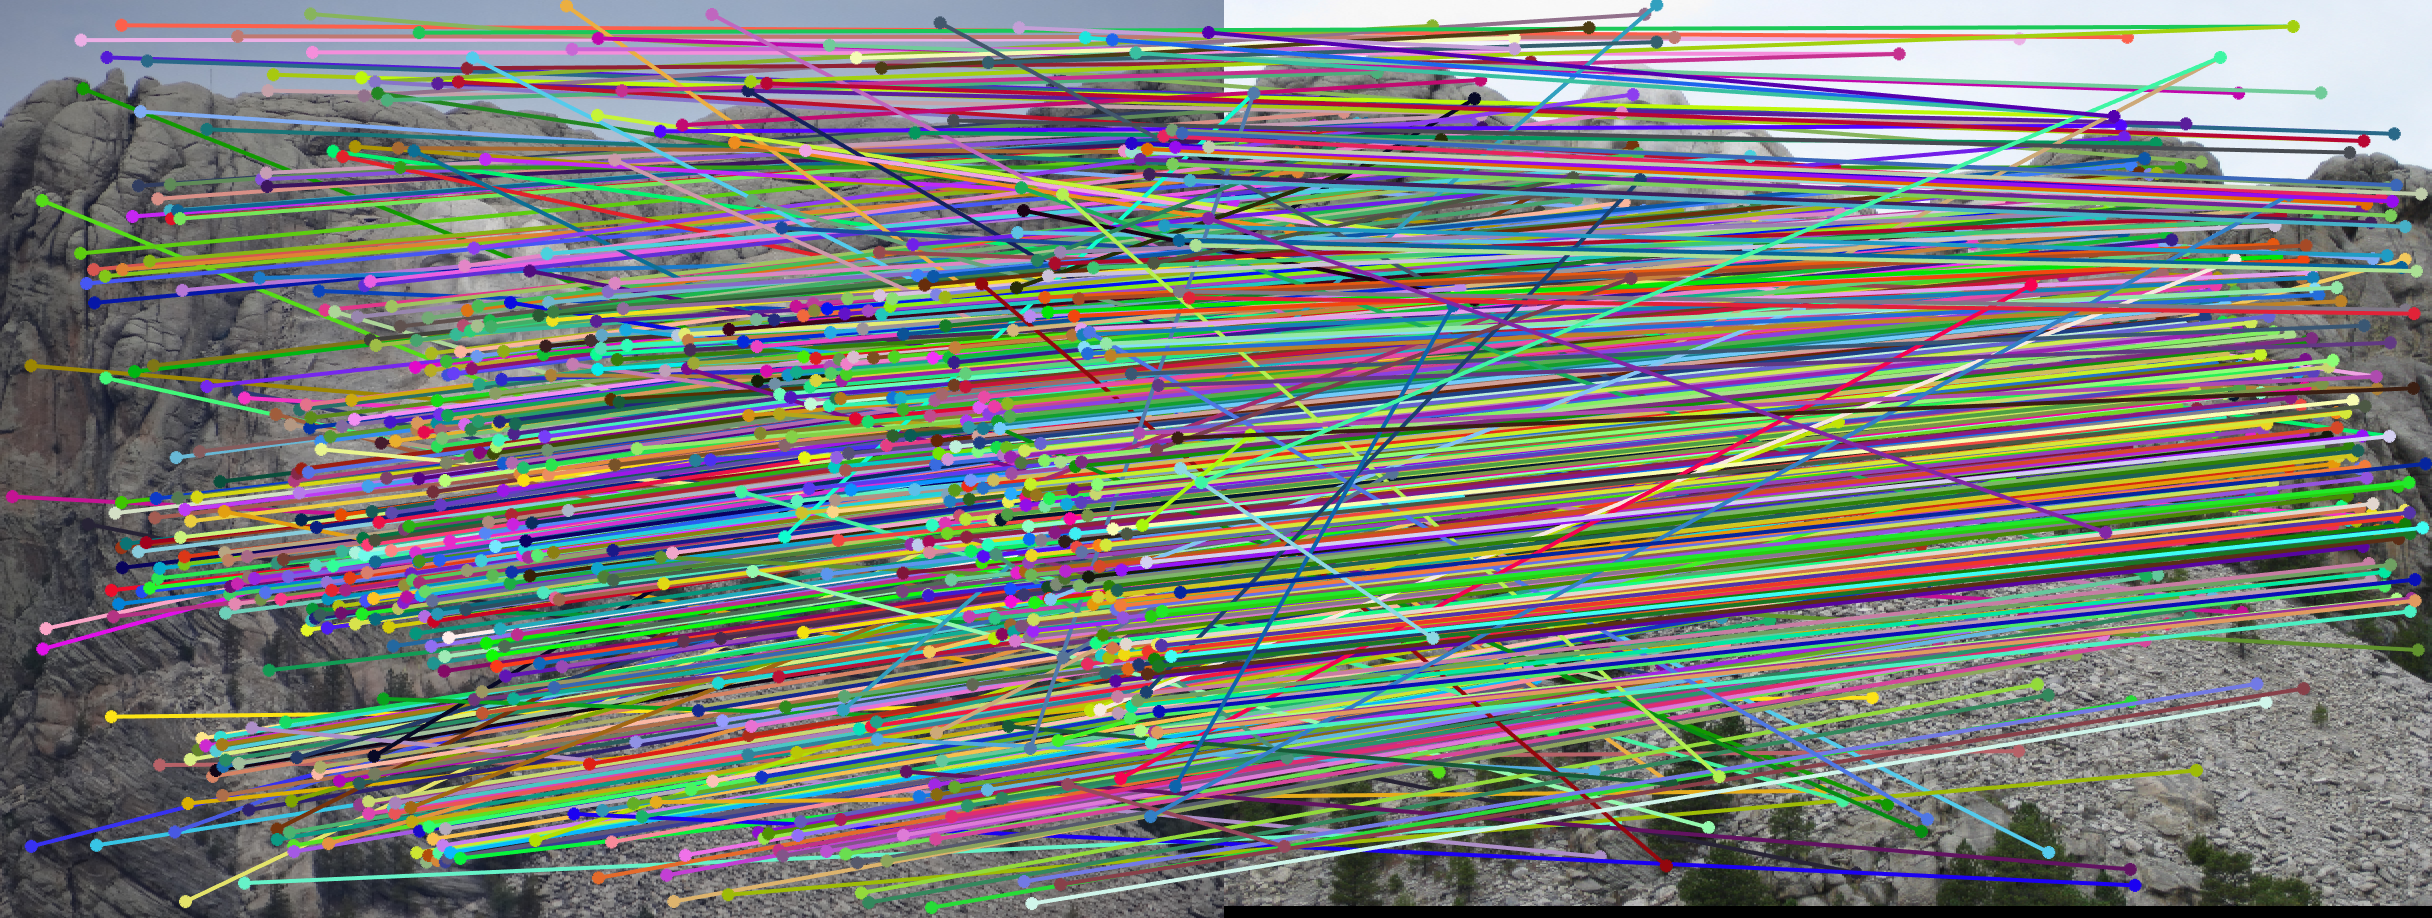
Keypoint Matches from SIFT algorithm |
|
330 Inlier Keypoint Matches from Ransac |
|
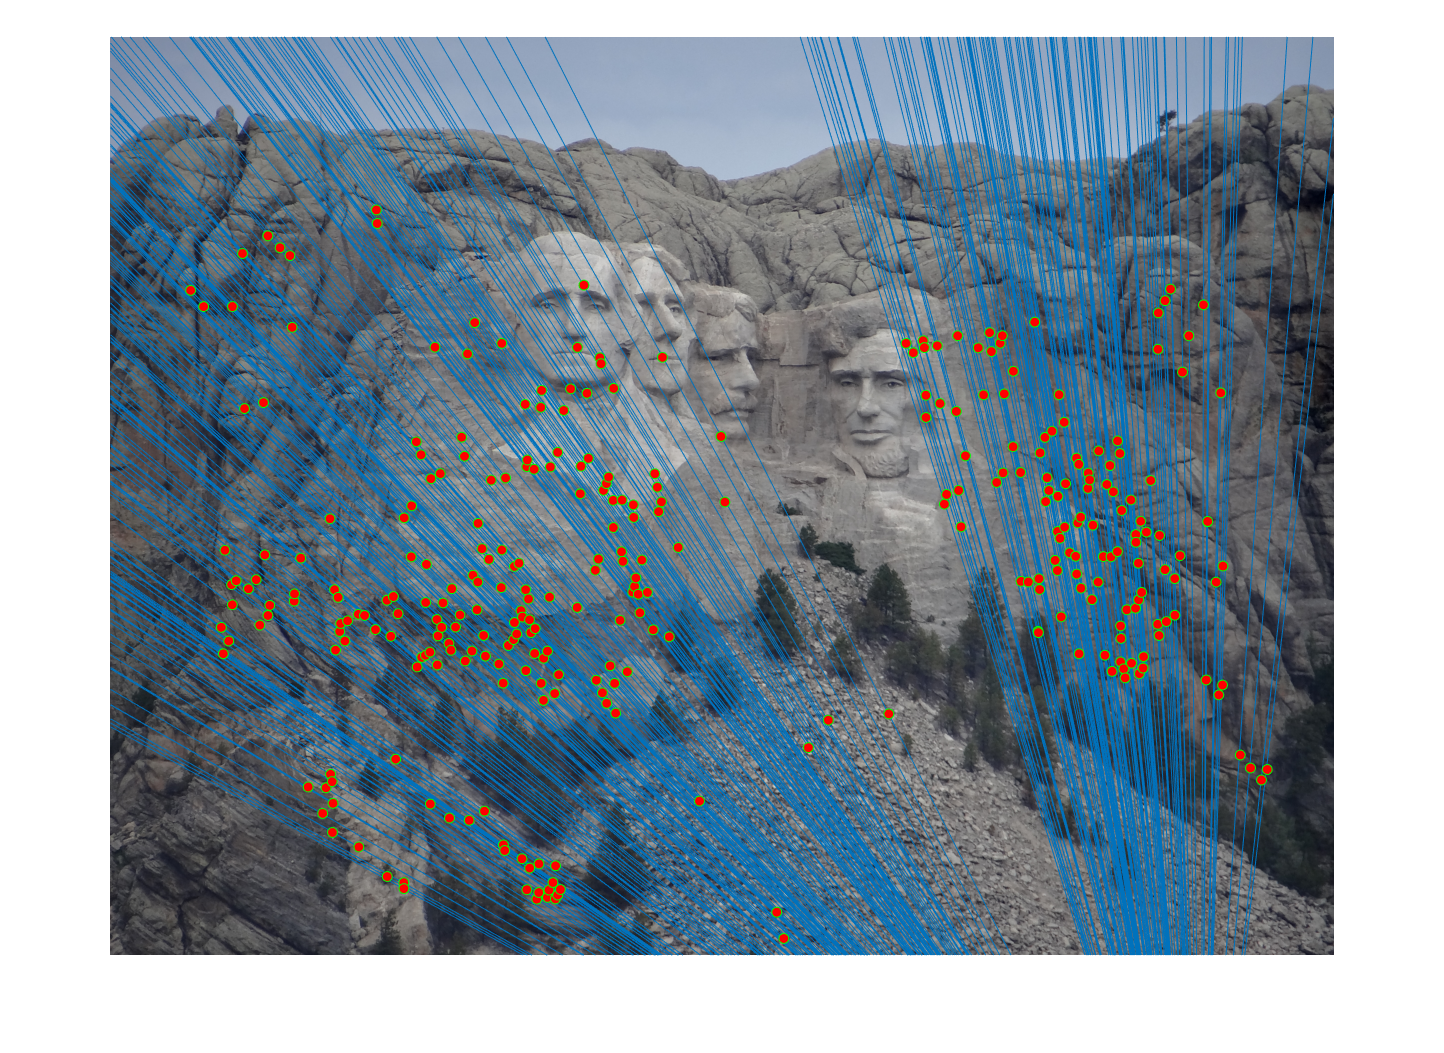
Epipolar lines on image 1 |
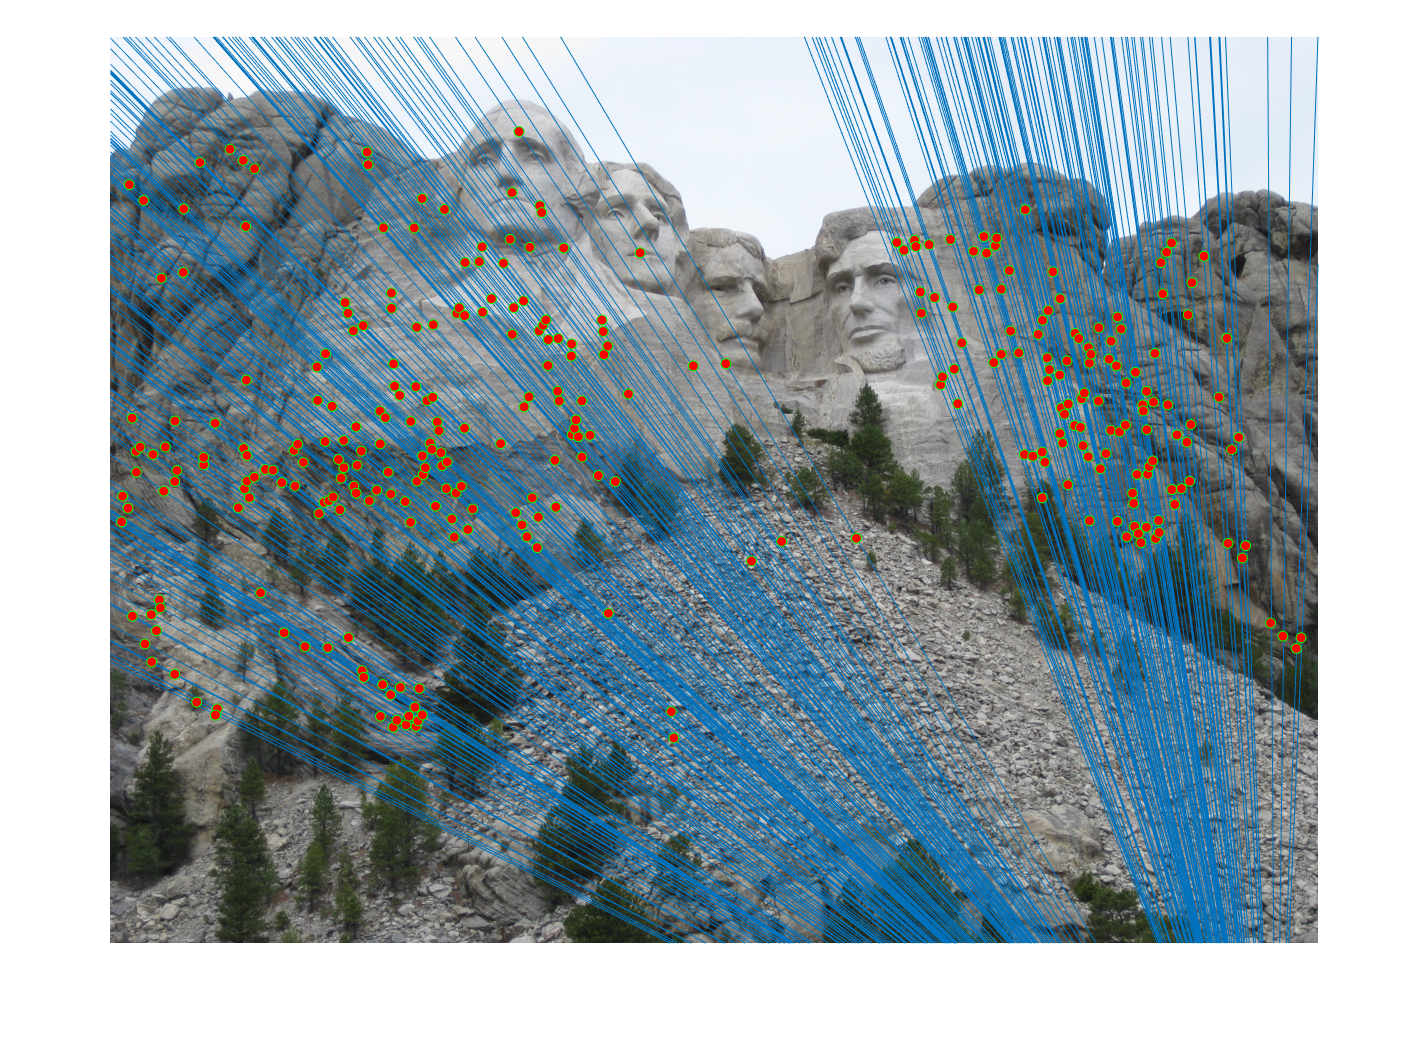
Epipolar lines on image 2 |
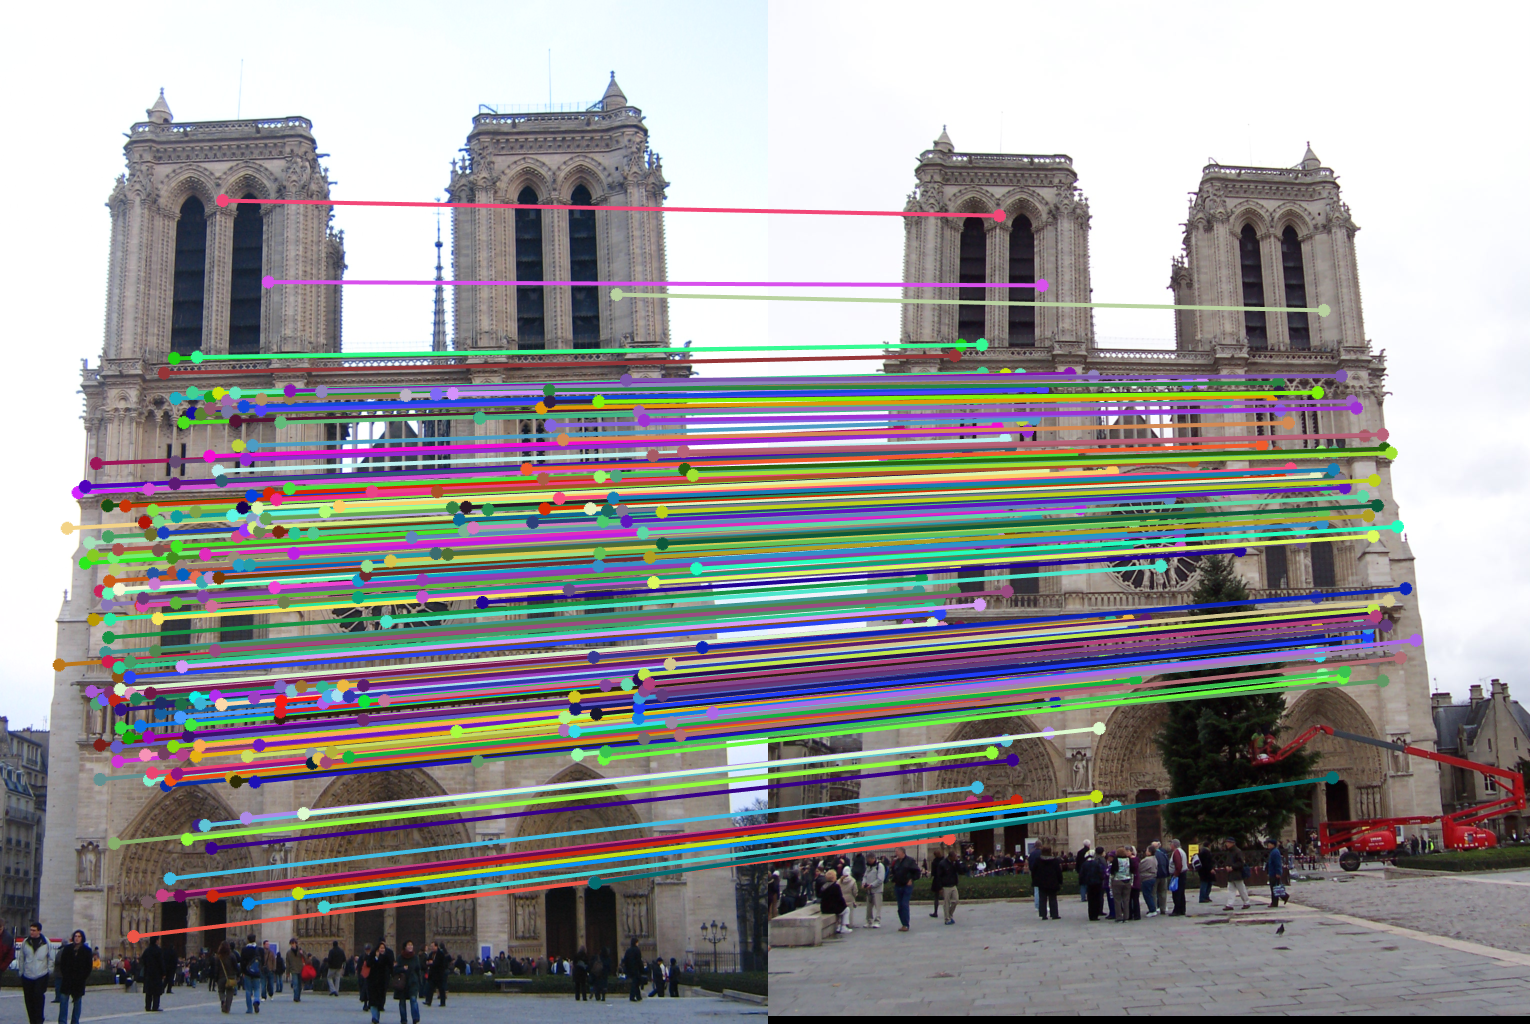
Notre Dame
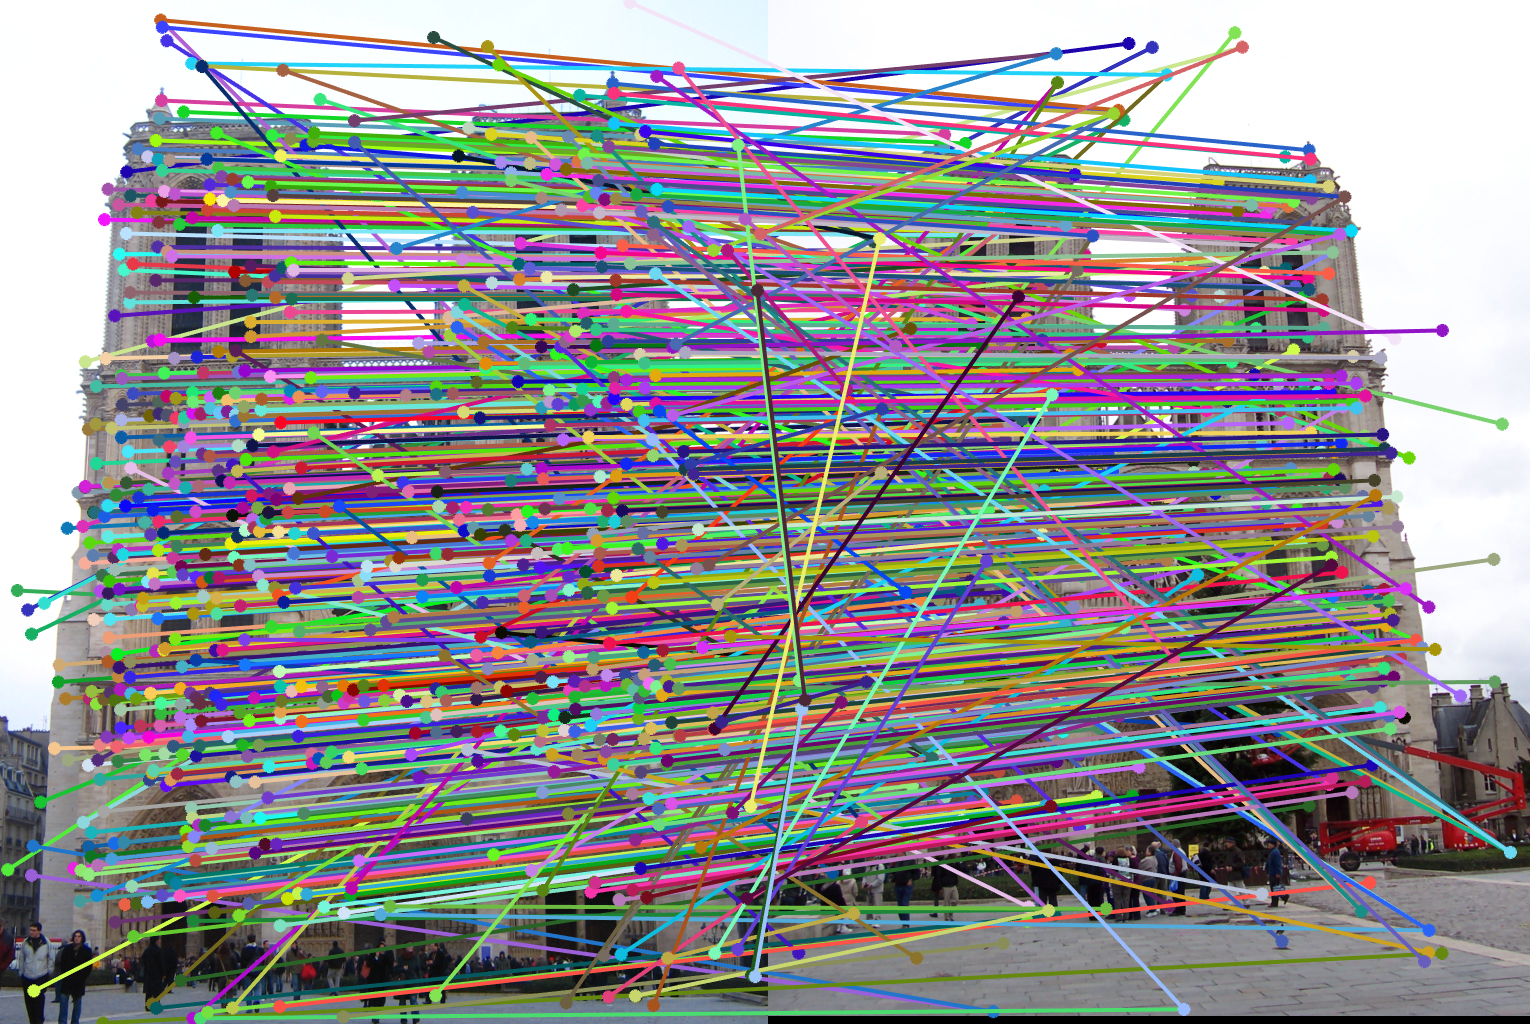
Keypoint Matches from SIFT algorithm |
|
330 Inlier Keypoint Matches from Ransac |
|
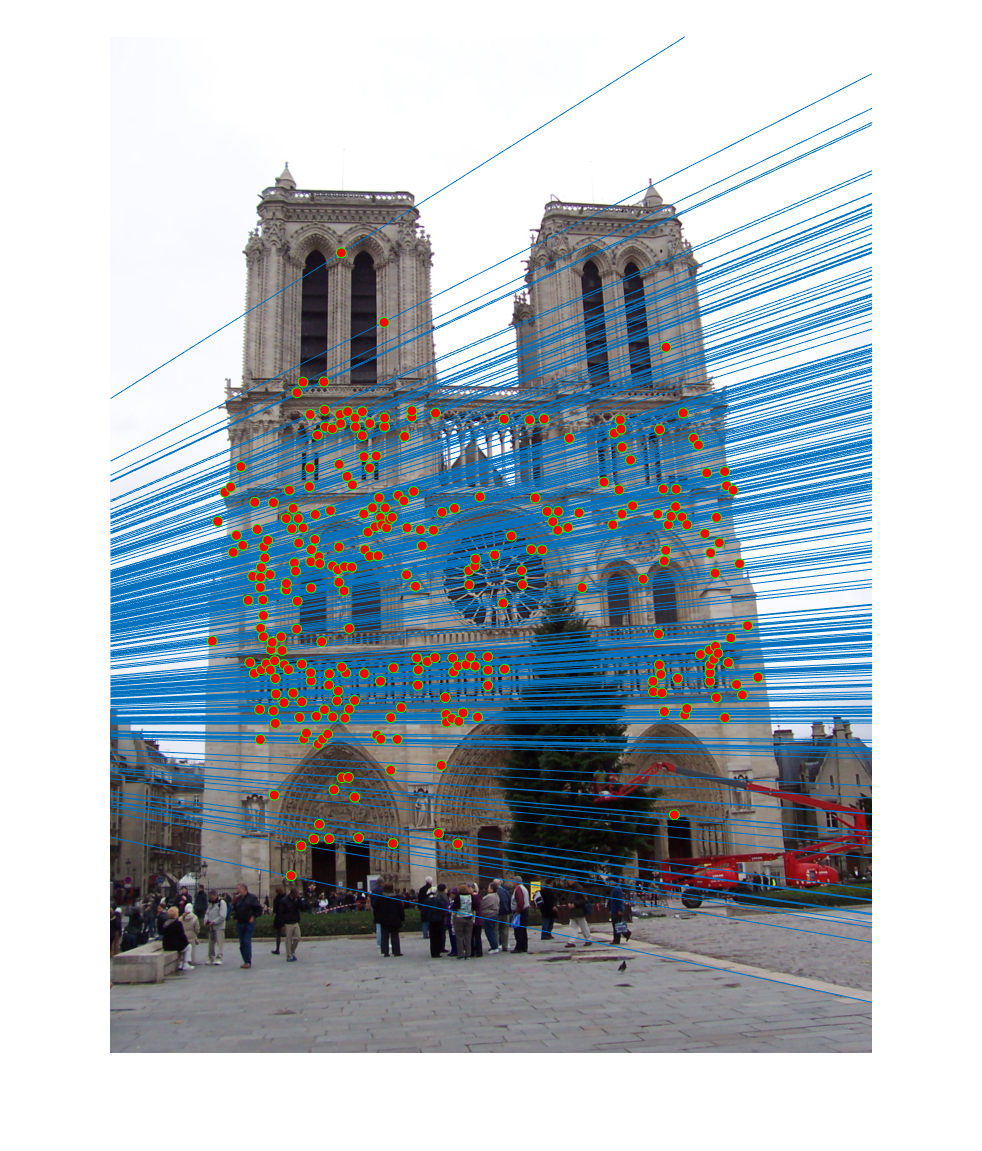
Epipolar lines on image 1 |
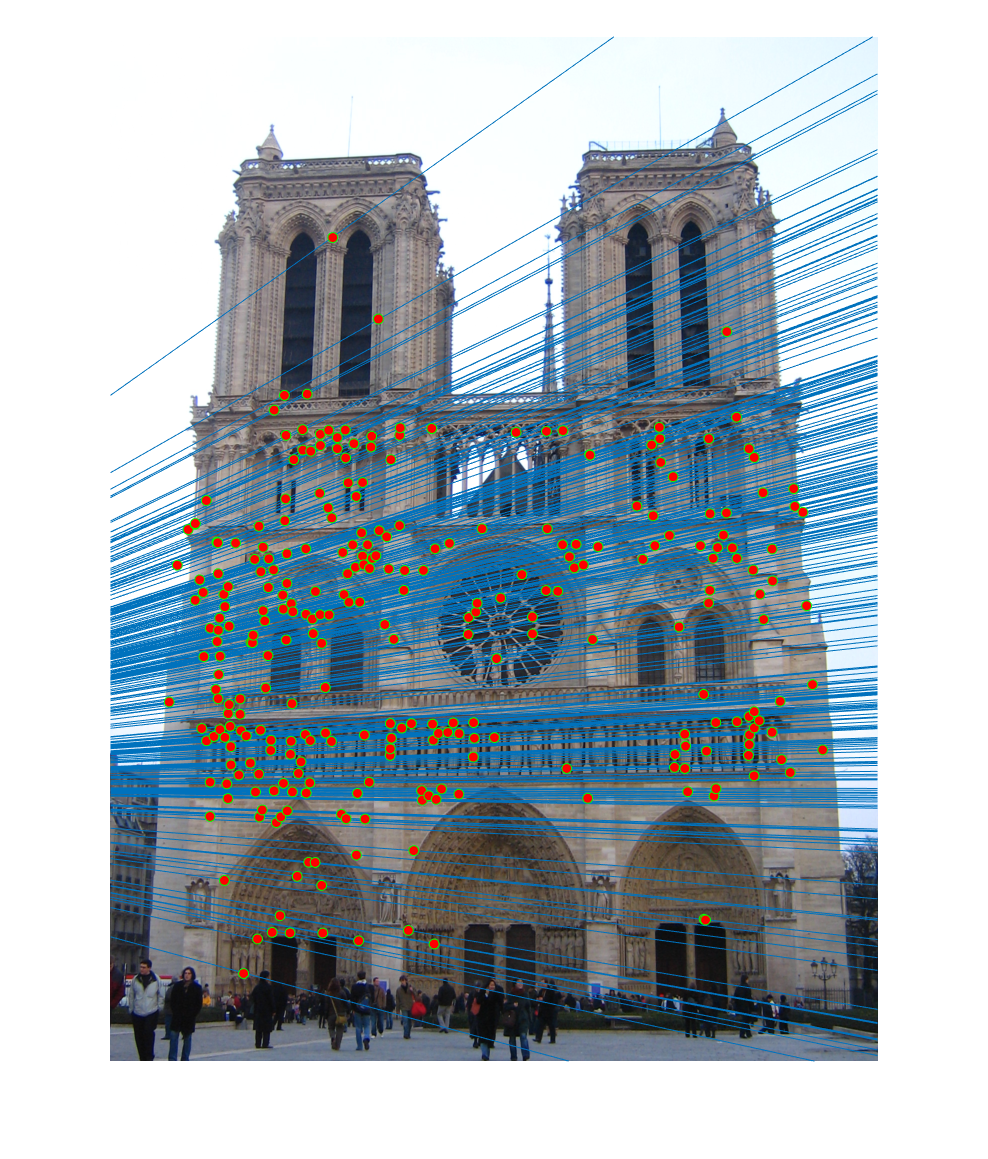
Epipolar lines on image 2 |
Normalizing Points
In order to improve performance and help normalize the ransac error thresholding between images, I tried normalizing points to a mean of zero and square scaling with average magnitude of sqrt(2) before calculating the fundmental matrices. I did this for each image. I used the following transformation matrices.
I calculate c as the mean of the points and Su is the reciprical of the average distance from each u to cu. Sv is the reciprical of the average abs(v-Cv) for the v for each point. I normalized the points for each image when calculating the fundamental matrix and then converted the matrix to work for the unnormalized points. Doing this greatly improved the accuracy of the algorithm. Below is a comparison on the Gaudi dataset.
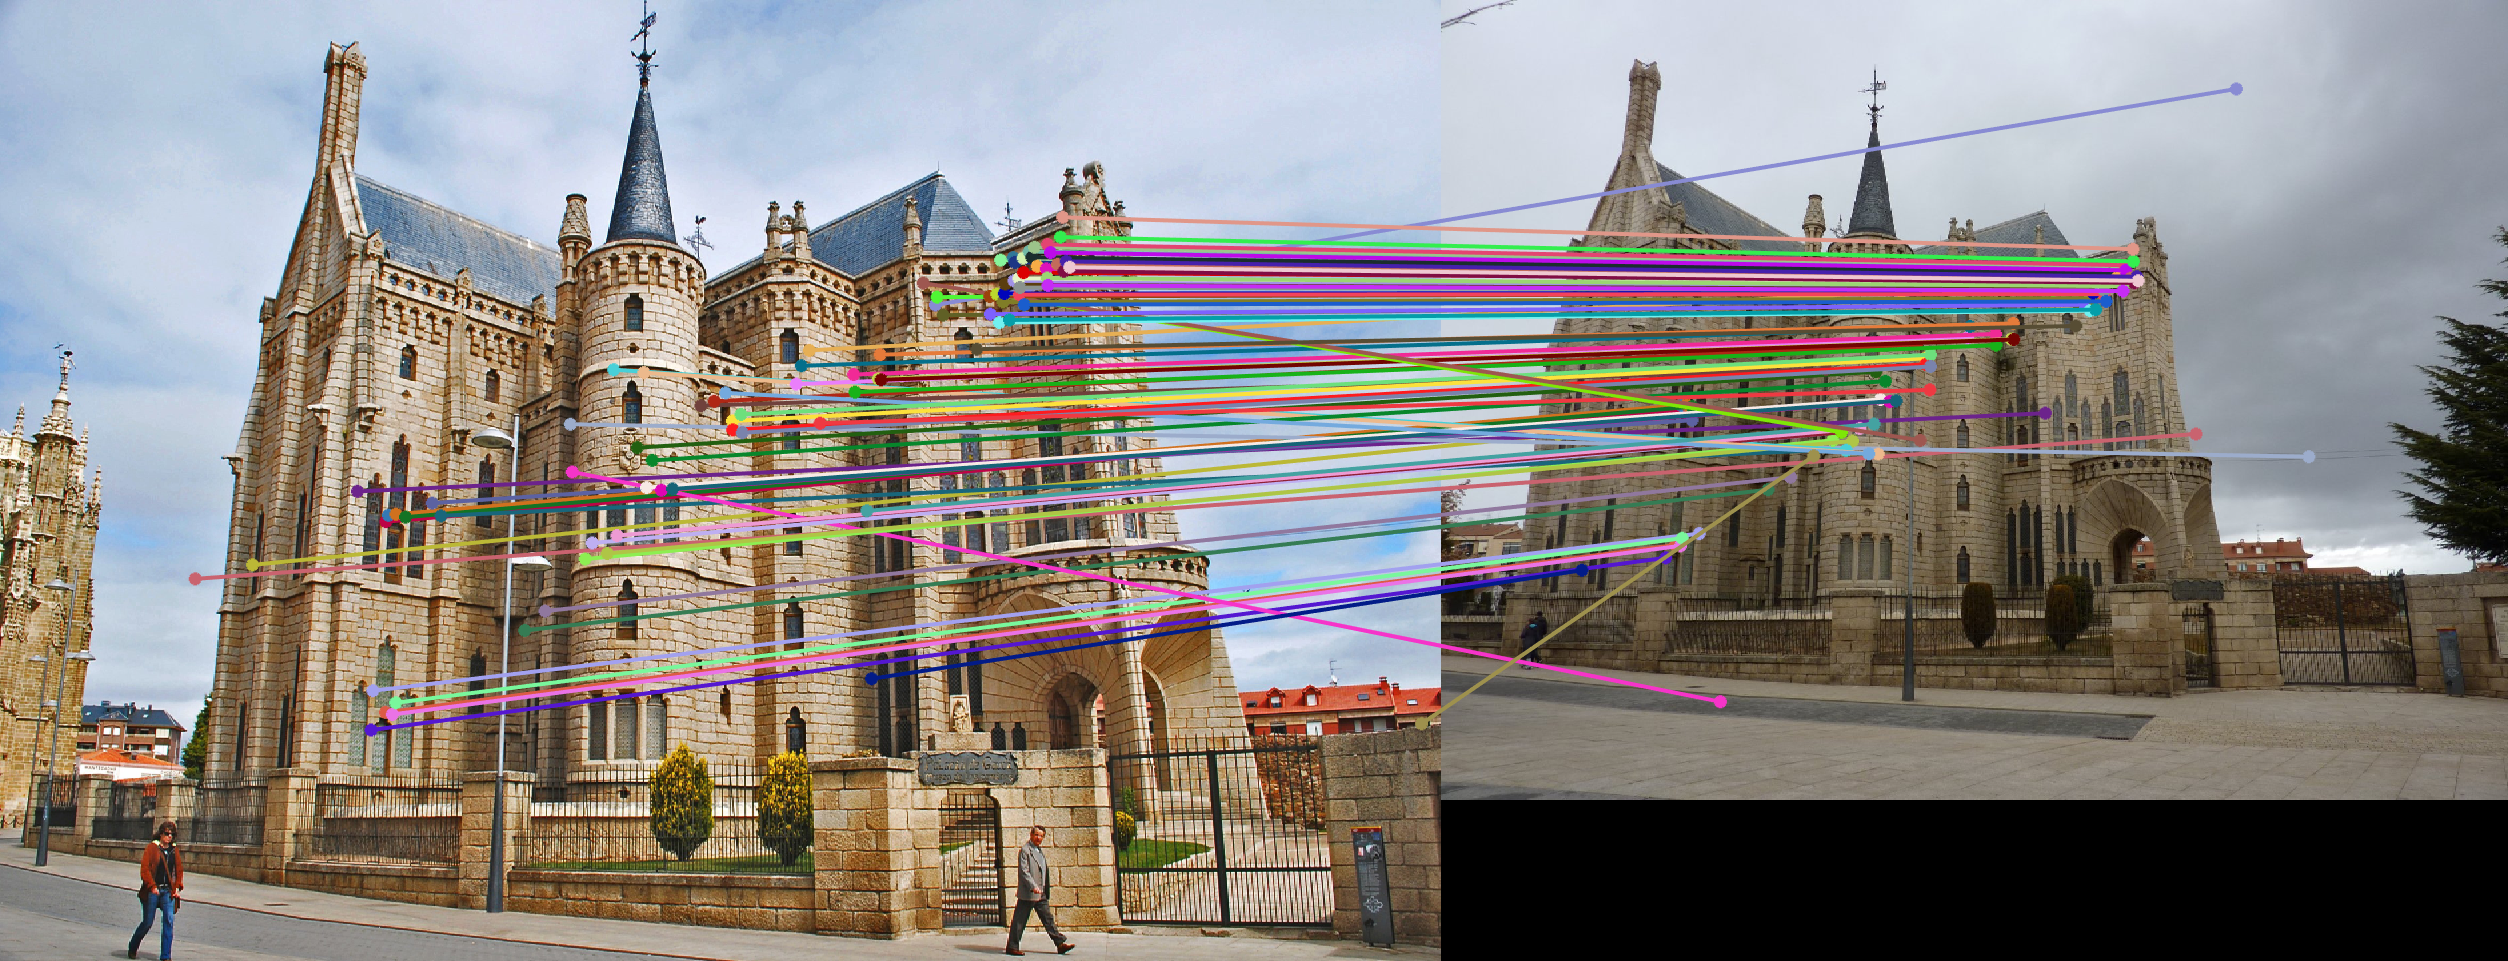
Gaudi
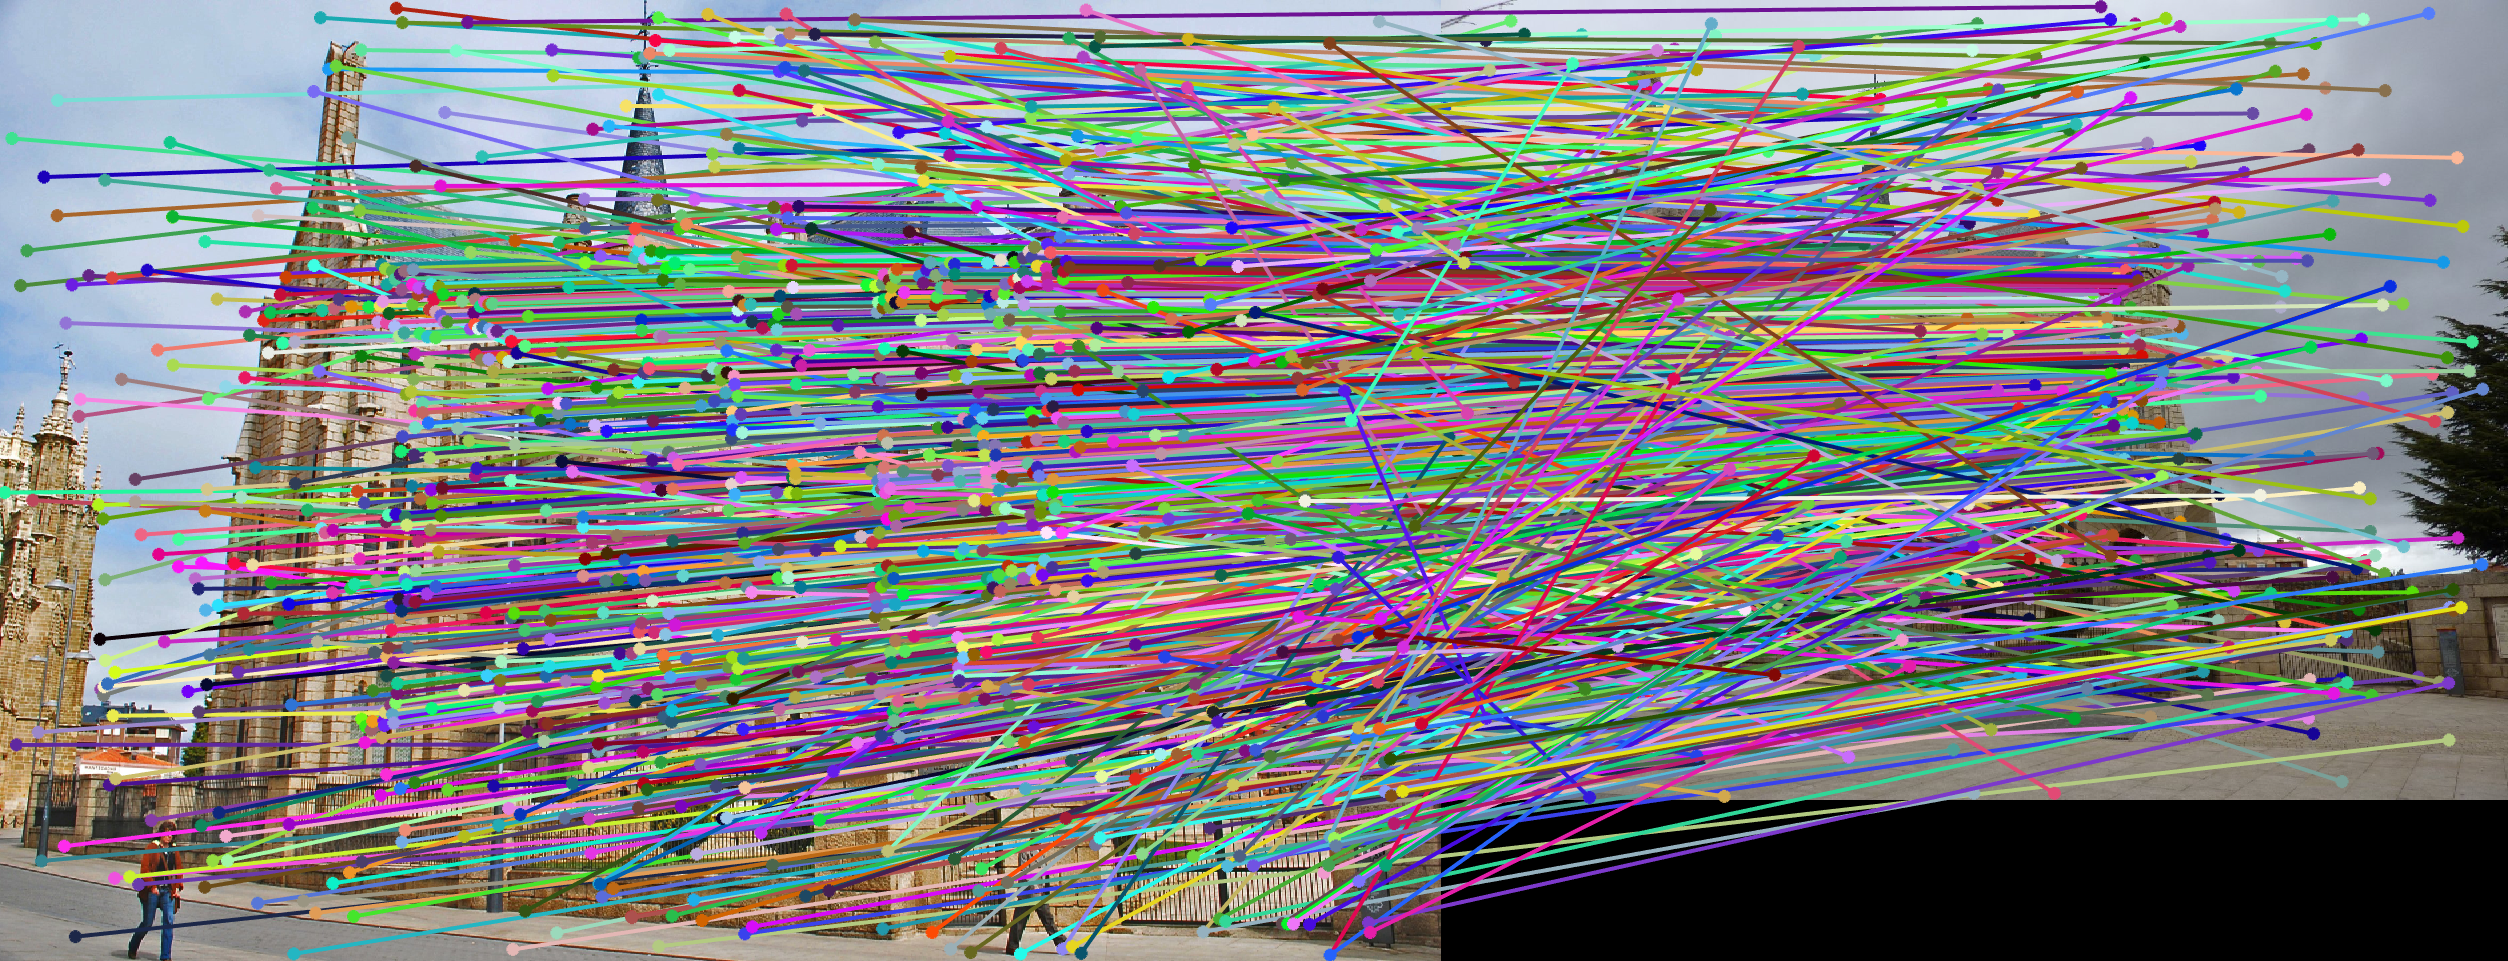
Keypoint Matches from SIFT algorithm |
|
88 Inlier Keypoint Matches from Ransac |
|
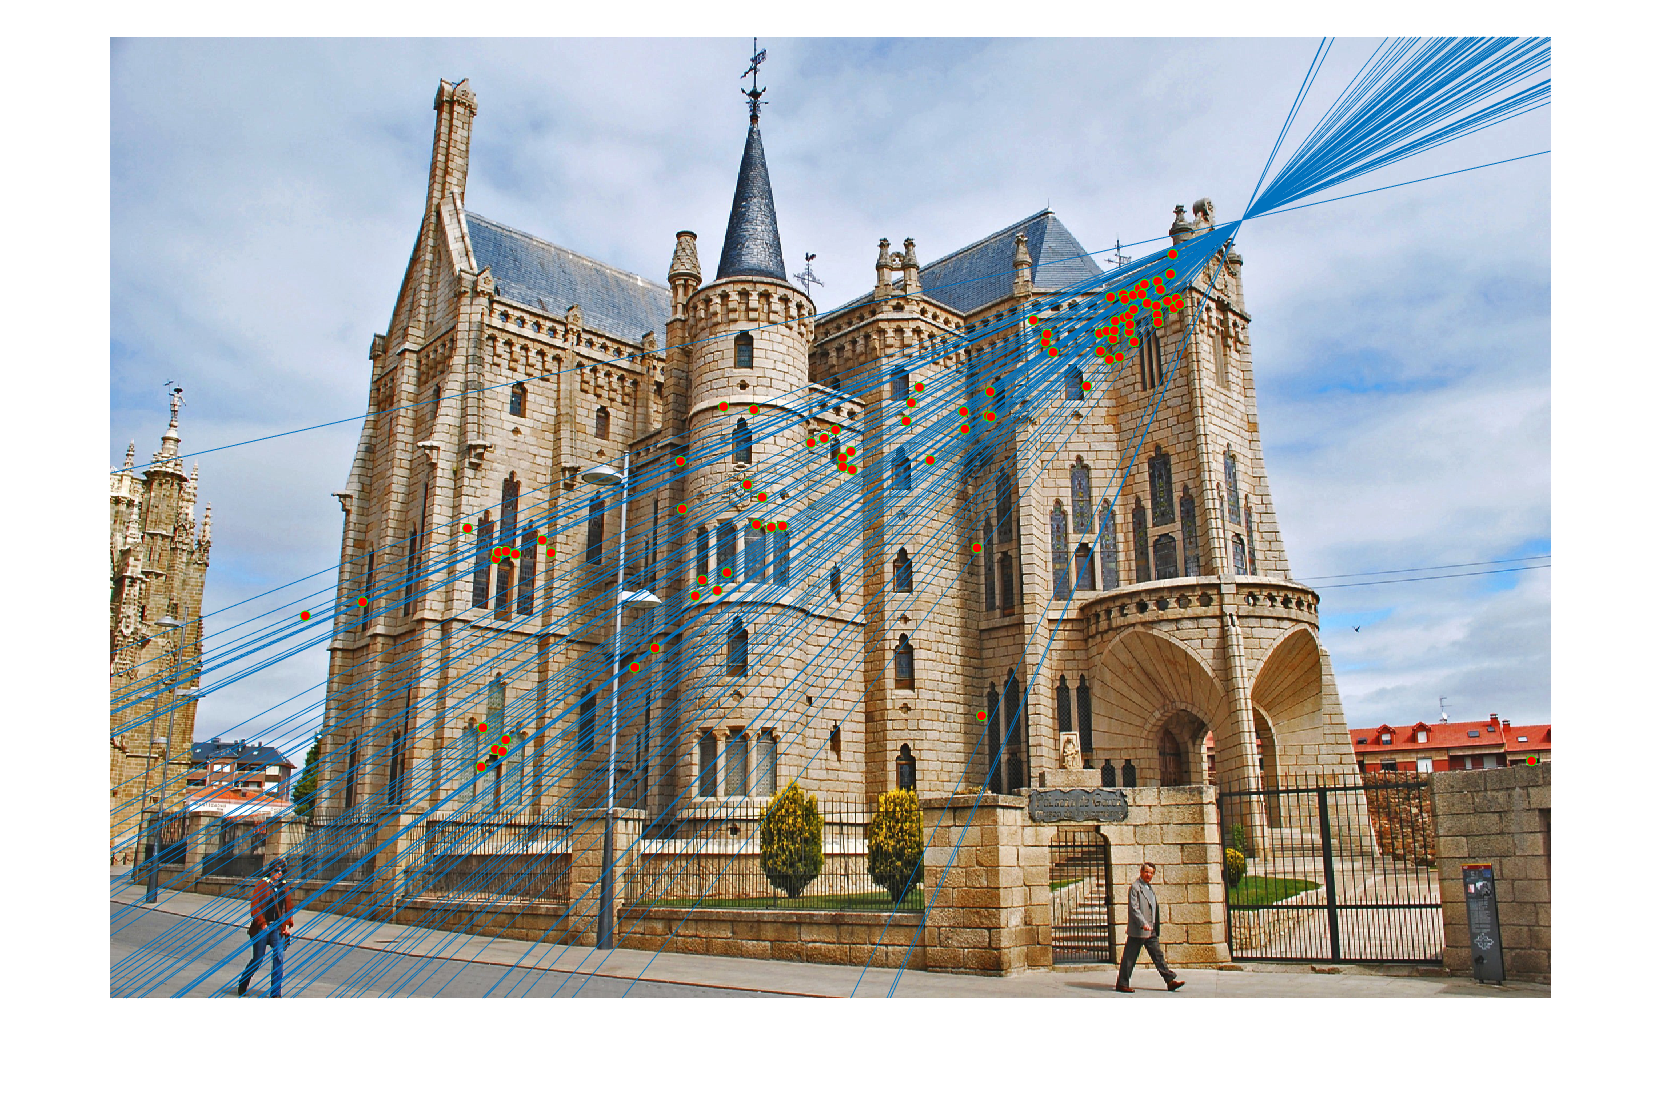
Epipolar lines on image 1 |
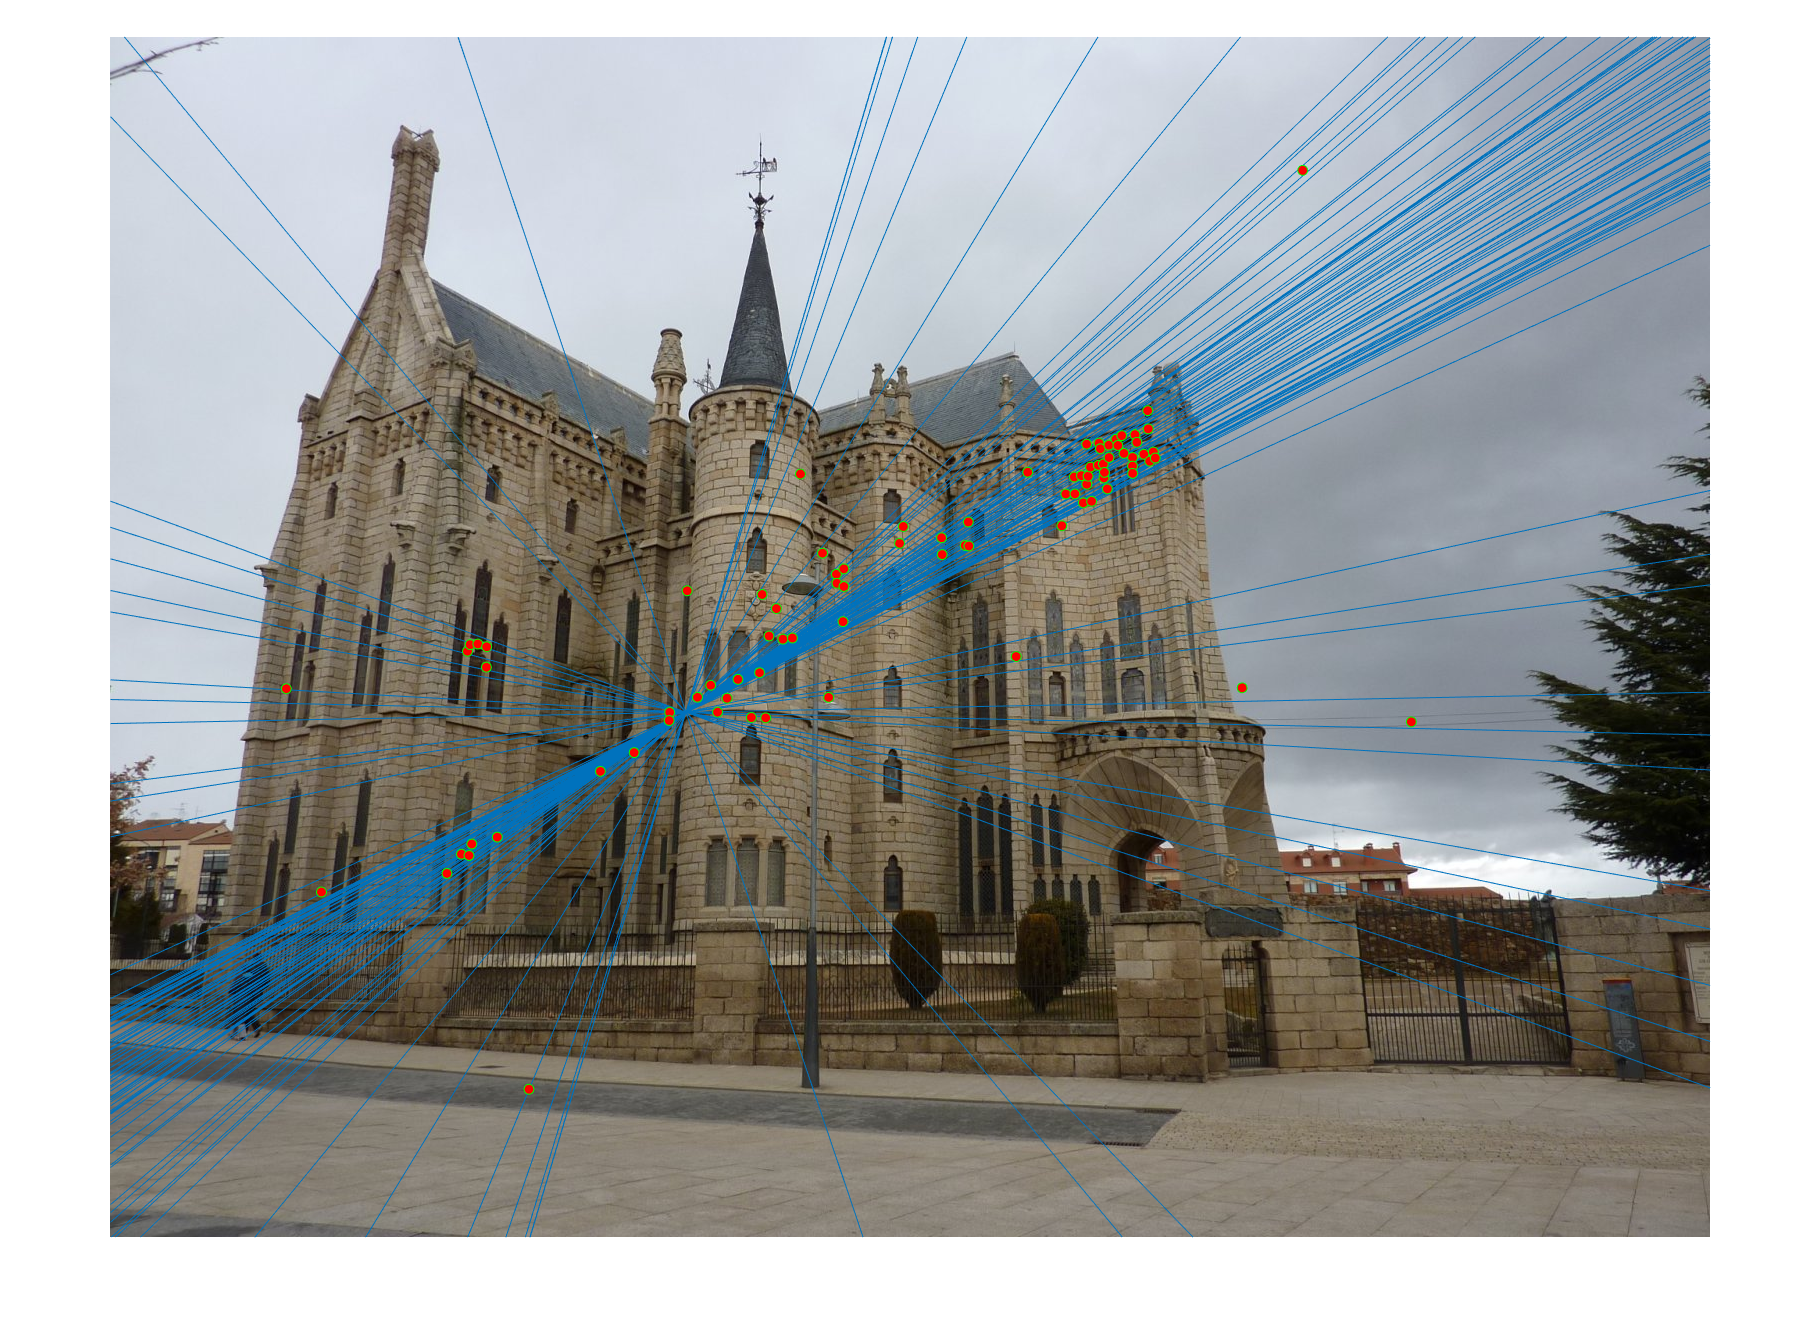
Epipolar lines on image 2 |
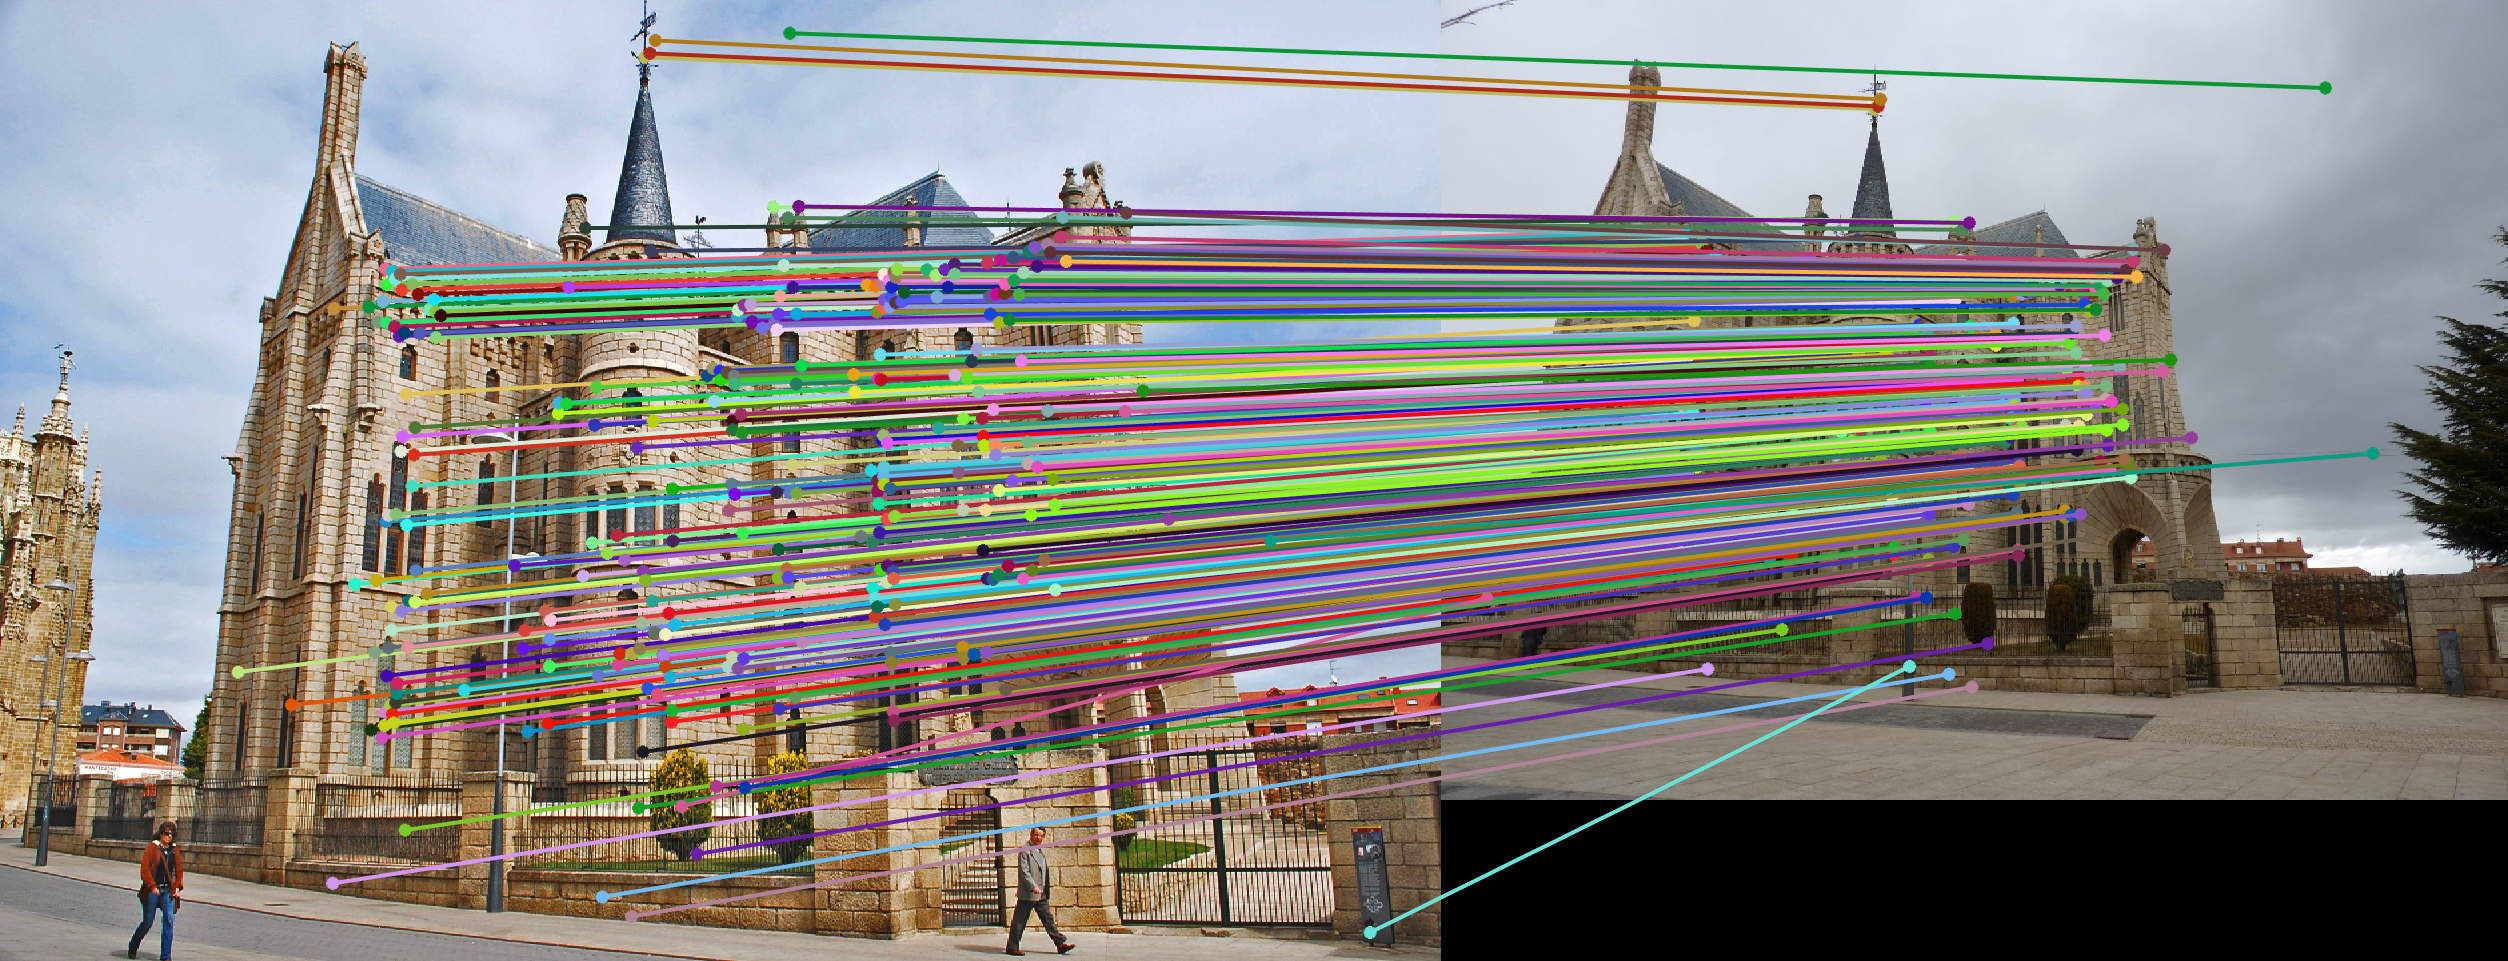
301 Inlier Keypoint Matches from Ransac with Normalized Points |
|
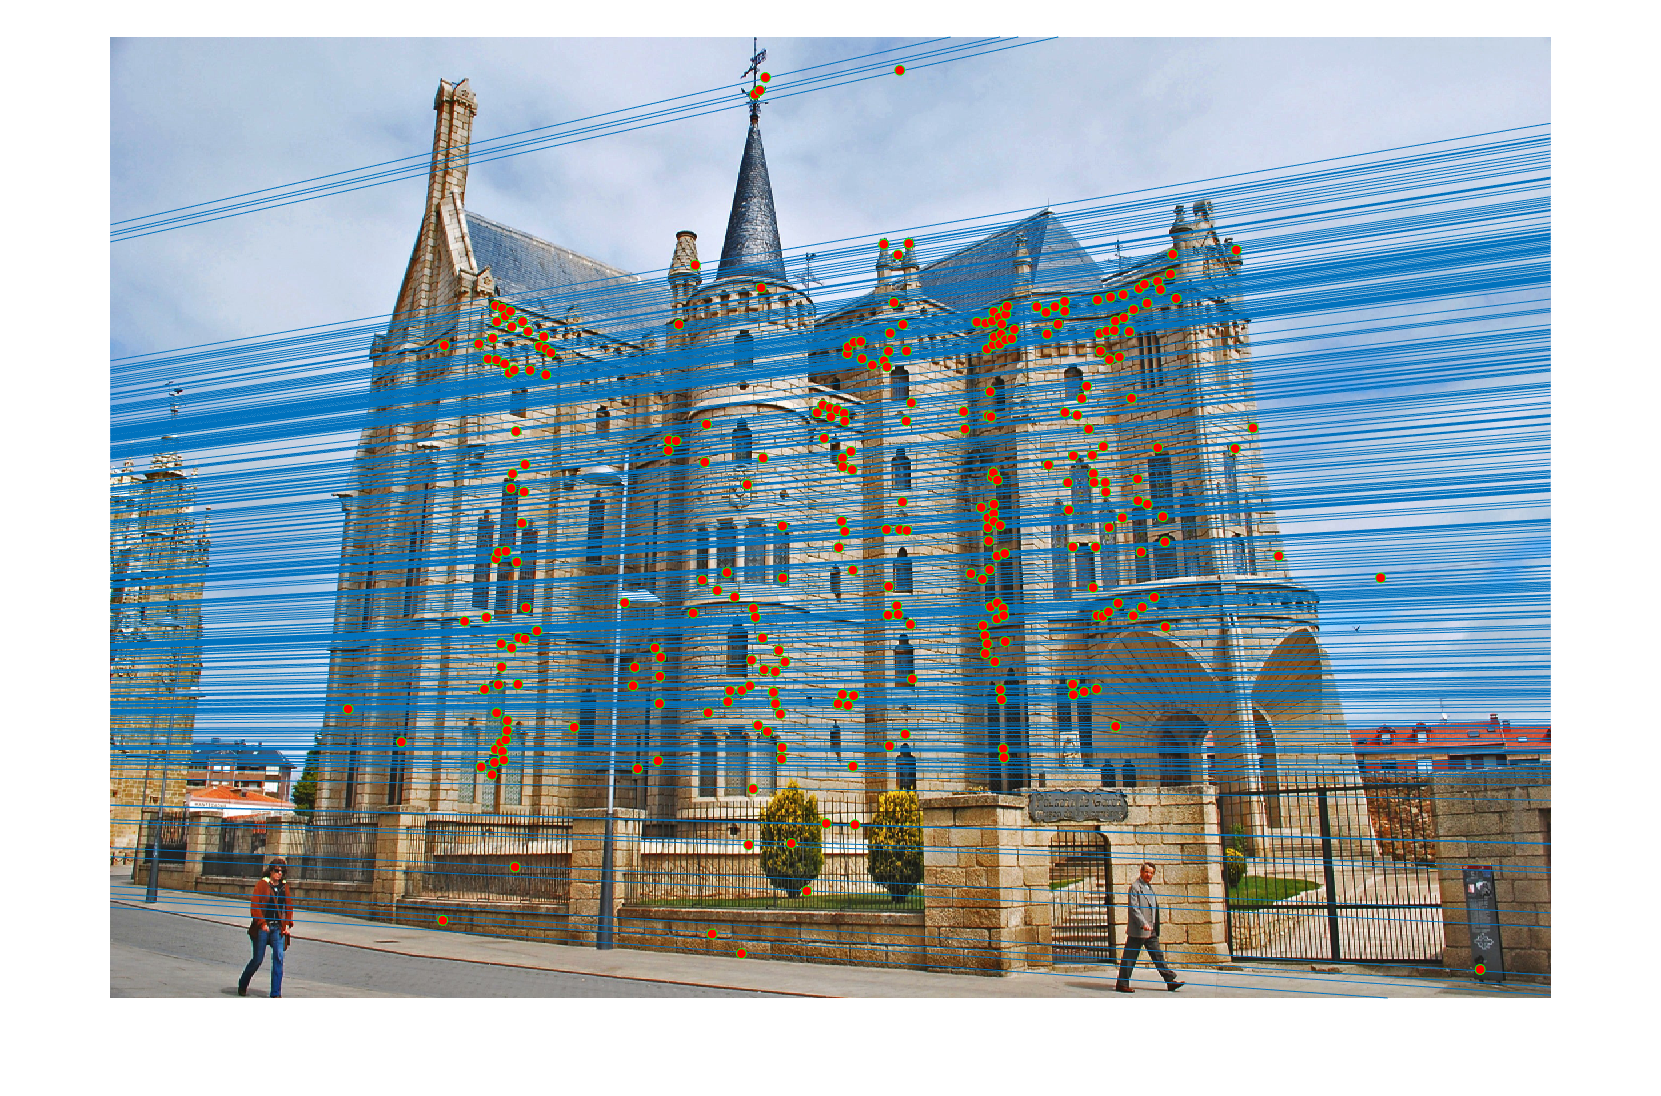
Epipolar lines on image 1 with Normalized Points |
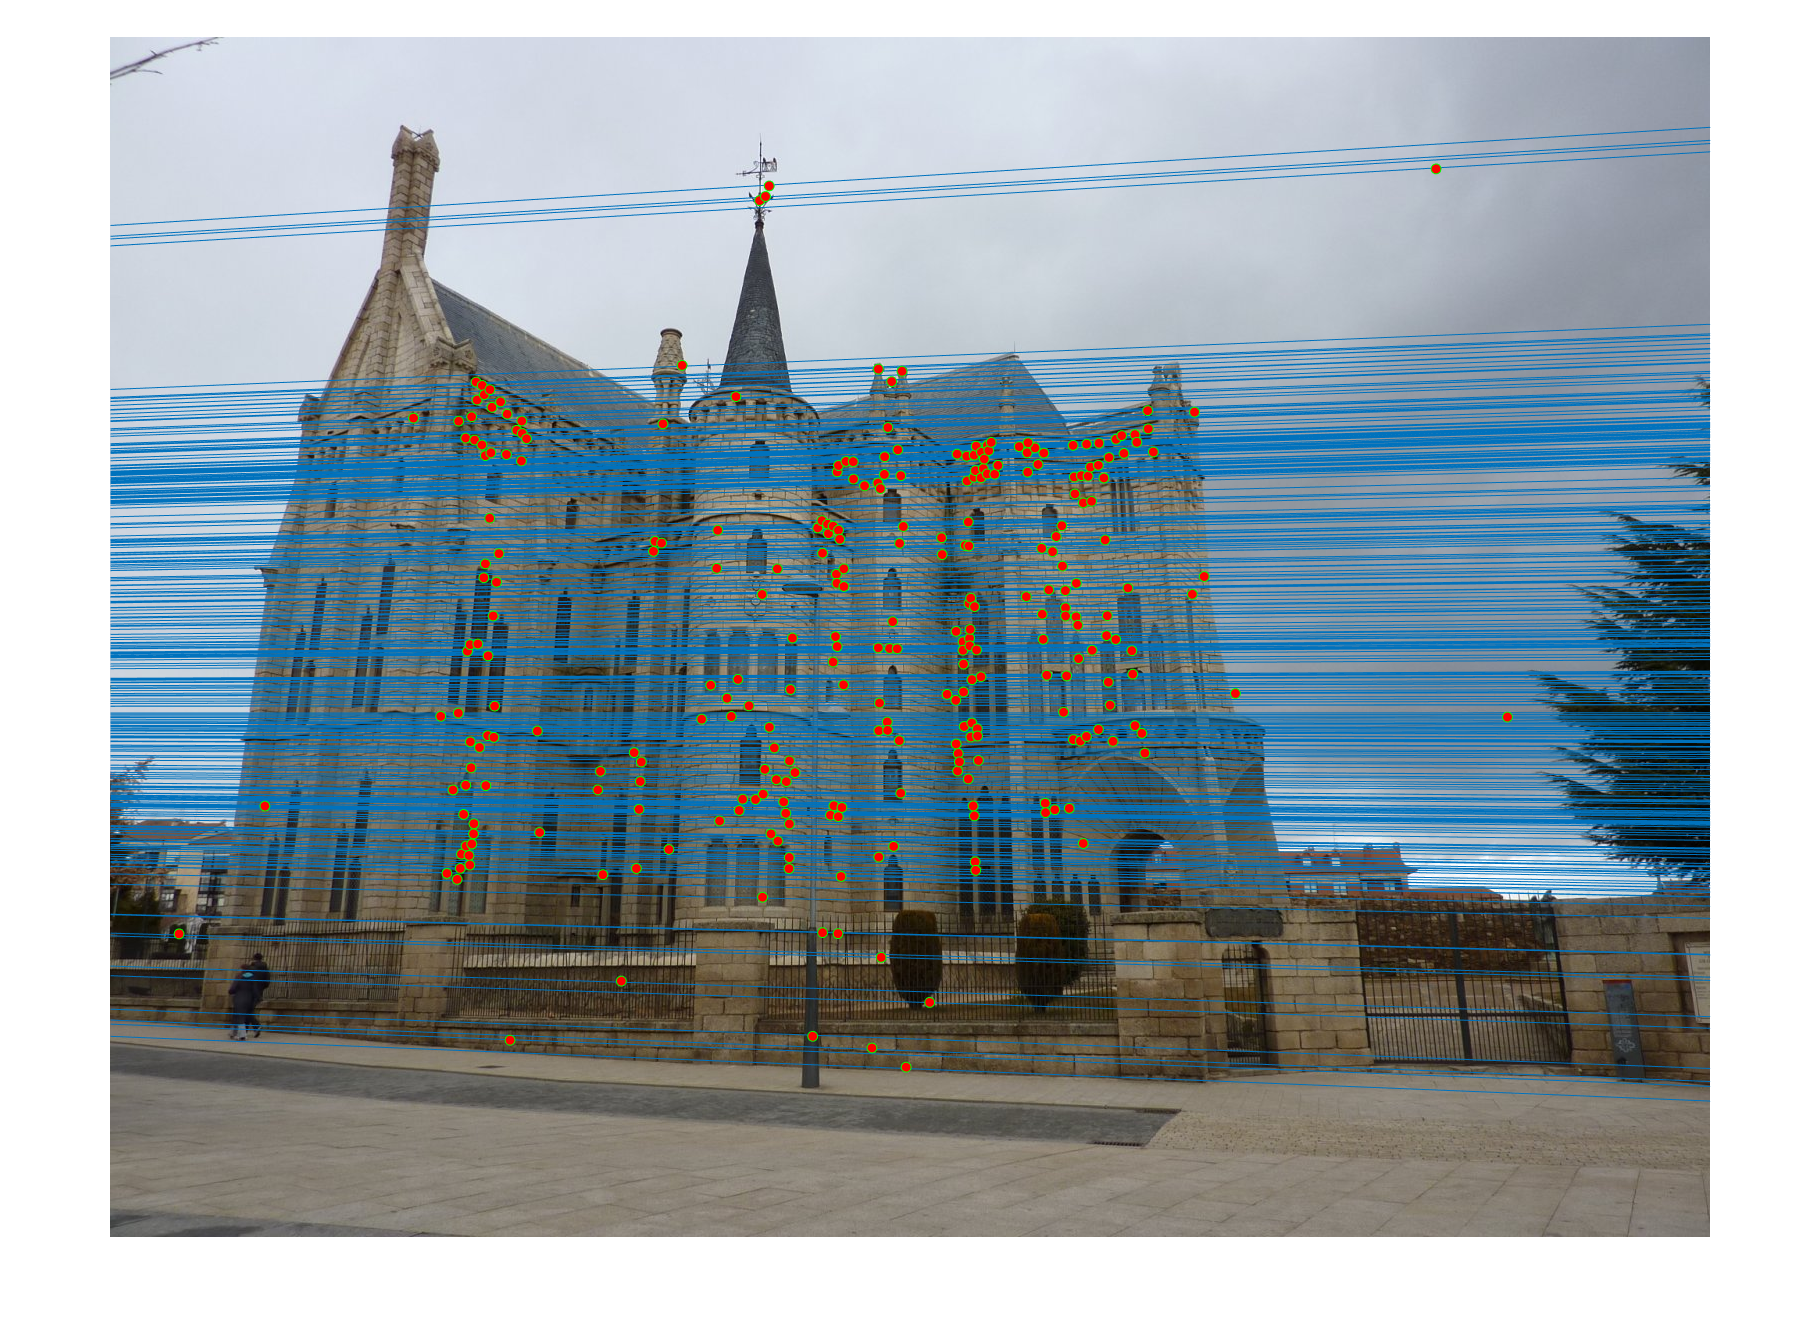
Epipolar lines on image 2 with Normalized Points |