Project 3 / Camera Calibration and Fundamental Matrix Estimation with RANSAC
There were three parts to this project that made the RANSAC algorithm successful. I first had to calibrate the camera so that i could find the camera center each time. The reason for this is because most pictures are taken from different perspective angles and distances, which play a big role in how the image is transformed and percieved. Next, I had to estimate the fundamental matrix for the two given images, which involves figuring out where the interest points were found so that we can create the epipolar lines or the lines in which feature points fall along in the other image. Finally I perform the RANSAC algorithm which is:
- Randomly sample the number of points require to fit the model
- Solve for the model parameters using the samples
- Score by the fraction of inliers within a preset threshold of the model
And we repeat the above until the best model is found with high confidence.
Part 1: Projection Matrix and Camera Center
As mentioned before, I needed to calculate the projection matrix so that i can determine where the camera center is. The crux of the algorithm is evaluating each 2d and 3d point pairing and saving it as two entries in a matrix. u,v are the 2D coordinates, and x,y,z are the 3D coordinates.
row1 = [x,y,z,1,0,0,0,0,-u*x,-u*y,-u*z,-u];
row2 = [0,0,0,0,x,y,z,1,-v*x,-v*y,-v*z,-v];
After populating a matrix with the two rows (above) for every point pairing, I solve the set of linear equations utilizing SVD, grabbing the right singular vectors, V, and reshaping it so that it is now a matrix that has 3 columns.
[U,S,V] = svd(A);
M = V(:,end);
M = reshape(M,[],3)';
Finally, we calculate the center of the camera by using the following equation below, where M is a combination of the intrensic and extrensic parameters. We are assuming to only estimate one extrensic parameter, which is the camera center. M thus can be defined as M=(Q|m4), where Q is a 3x3, and m4 is a 1x3
Center = -inv(Q)*m4;
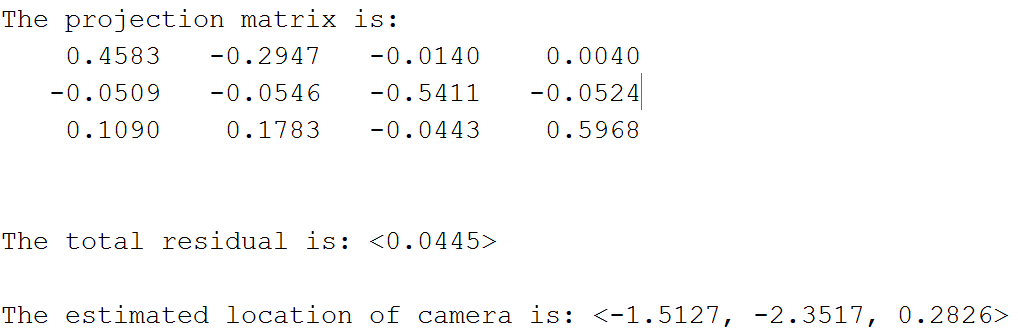
Above were the results I got after running the projection matrix, and camera center calculations. Overall, it was nearly identical to the expected results including some rounding calculations. The only thing different was that my projection matrix was a scalar multiple of the expected results by a factor of -1, which is still deemed correct by the instructions.
Part 2: Fundamental Matrix Estimation
The purpose of this part is to estimate the mapping of points in one image to lines in another via the fundamental matrix.
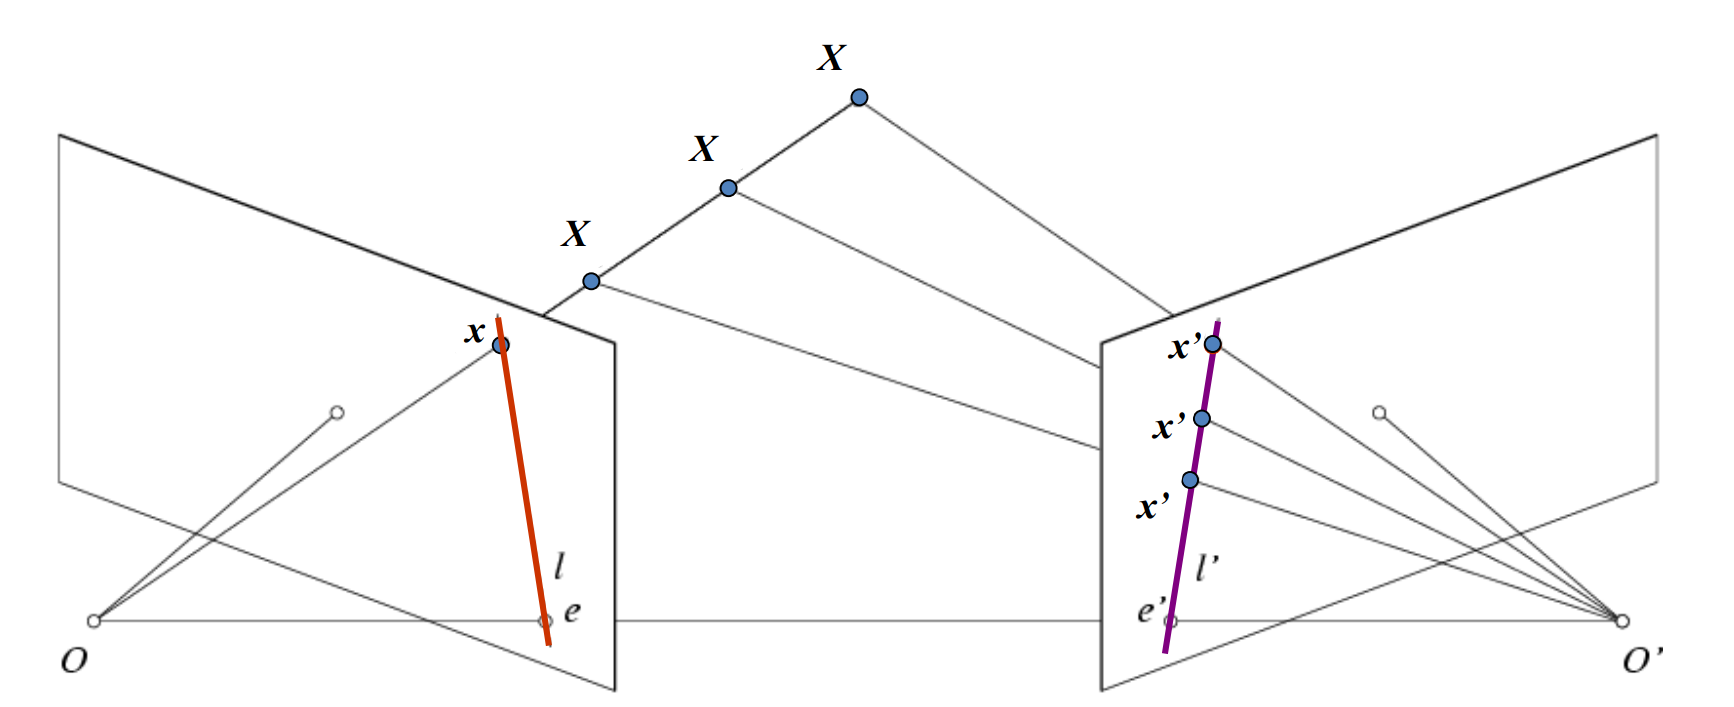
As seen above, by using the fundamental matrix and a given point, x, on one image plane, we can figure out where the same point in the other image, x', belongs by calculating a line that it belongs on, l'.
However, in order to estimate the fundamental matrix, we need to use an algorithm that can calibrate it. Specifically I used the 8-point algorithm, which uses a least-squared solution utilizing SVD from 8 pairs of corrispondences.
line = [u*uPrime, v*uPrime, uPrime, u*vPrime, v*vPrime, vPrime, u, v, 1];

[U, S, V] = svd(A);
f = V(:, end);
F = reshape(f, [3 3])';
For every point pairing, I represent point1 and point2 as u,v and u',v', respectively, and plug it into this formula, which is the crux of the 8-point algorithm. I then insert it into a matrix composed of entries for every point pairing. After that I solve the system of equations utilizing a SVD, and solve for F in particular.
[U, S, V] = svd(F);
S(3,3) = 0;
F_matrix = U*S*V';
After that, i resolve the det(F) = 0 constraint using another SVD, and then return F_matrix as an estimate of the fundamental matrix
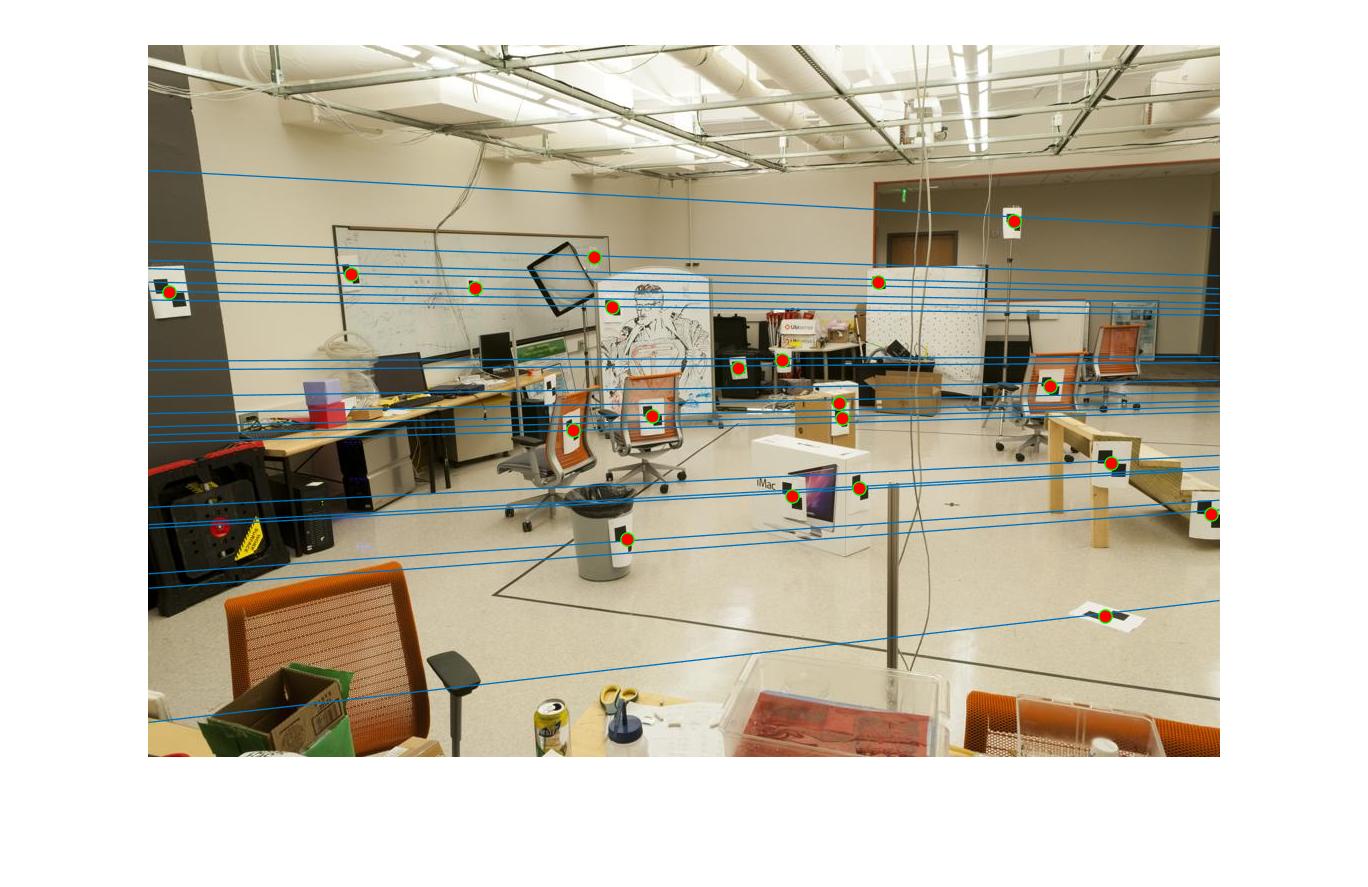
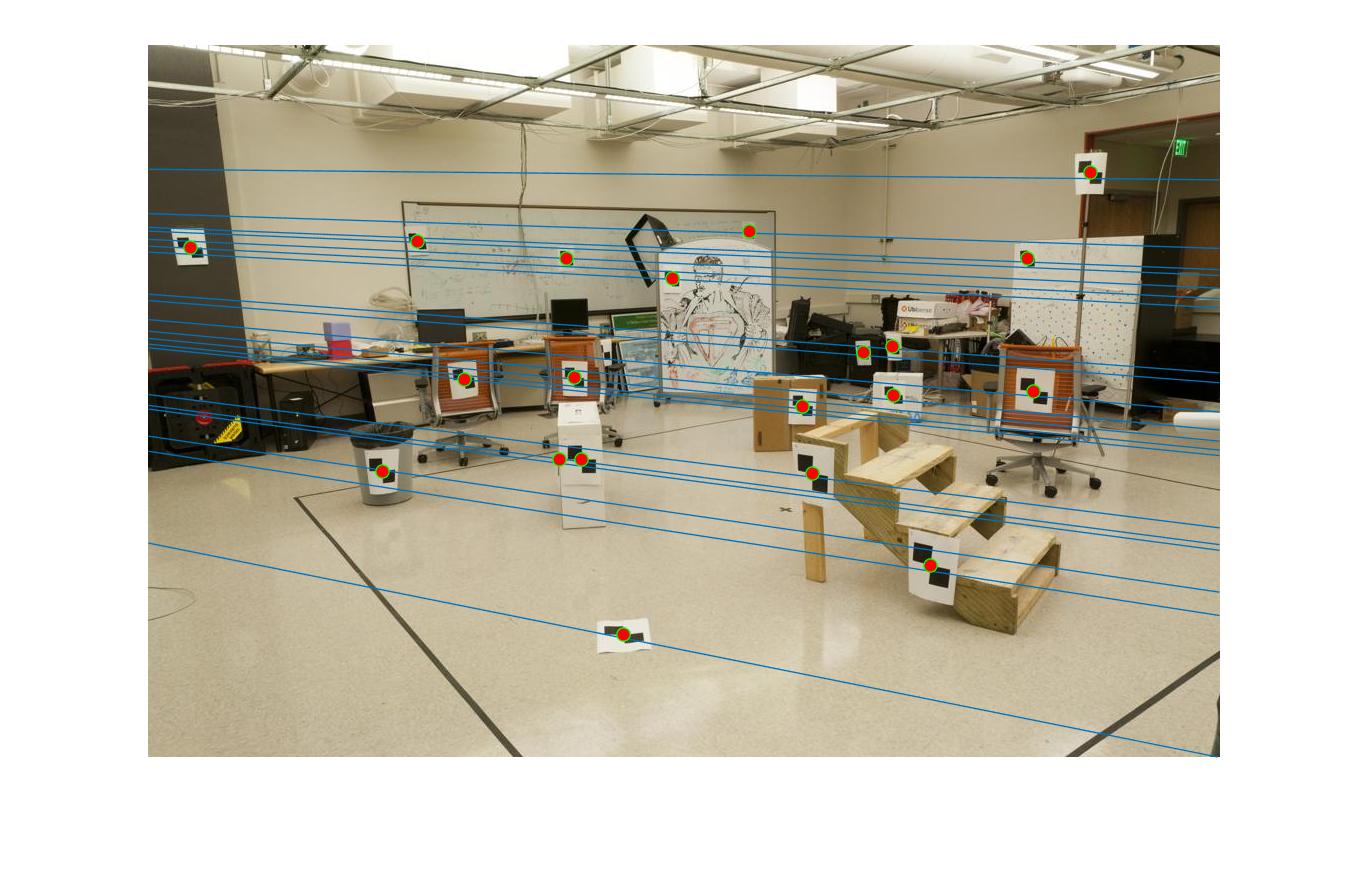
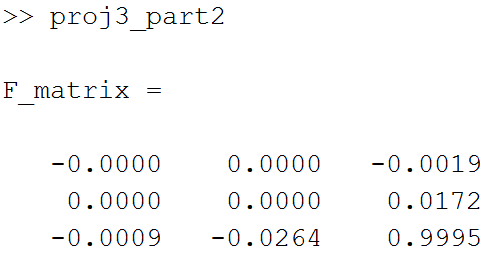
This was the results that i got after estimated the fundamental matrix. In addition to that, I can verify that it's very accurate due to the fact all of the lines pass through the feature points. However, there is a tiny bit of error because there are some cases where the line just barely touches the point, and touches the outside instead of the center.
Part 3: RANSAC
In short, RANSAC stands for Random Sample Consensus. I had a for-loop that sampled for about 8 indices that led to corresponding points in each of the respective images for many iterations. Each iteration, I would estimate the fundamental matrix utilizing the method that I wrote earlier. In addition to that, I would check the error of every point, and specifically see if that error is less than a preset-threshold or delta. If it was, then I would increment a counter, and added the corresponding points to a list of inliers from image a and image b. Finally, after each calculation, I would check against the global maximum of inliers. If it was more than the existing maximum, then i would set the current iteration's values as the new max.
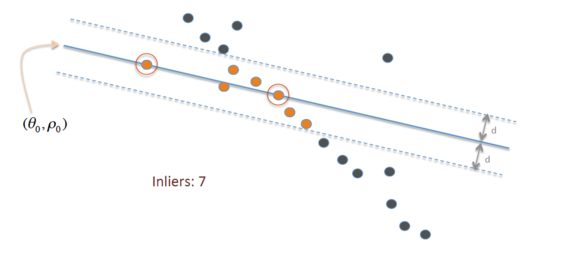
Source: Wikipedia
As seen above, I would have to sample all of the points in each iteration, and check to see if it is within my threshold or 'd' (delta) as noted in above image. If it was, then i would count it as one of my inliers, but otherwise i would ignore it.
threshold = 0.005; %the max delta

for i = 1:3500
    rand_indices = randsample(num_entries, 8); %random indices
    points_a = matches_a(rand_indices,:); %the corresponding values at the random indices
    points_b = matches_b(rand_indices,:);

    F_matrix = estimate_fundamental_matrix(points_a, points_b);
    current_inliers = 0;
    cur_inliers_a = zeros(num_entries,2);
    cur_inliers_b = zeros(num_entries,2);
    for point = 1:num_entries
        error = abs([matches_b(point,:) 1]*F_matrix*[matches_a(point,:) 1]');
        if (error < threshold)
            current_inliers = current_inliers + 1;
            cur_inliers_a(current_inliers,:) = matches_a(point,:);
            cur_inliers_b(current_inliers,:) = matches_b(point,:);
        end
    end
    if (current_inliers > max_inliers)
        max_inliers = current_inliers;
        Best_Fmatrix = F_matrix;
        inliers_a = cur_inliers_a(1:current_inliers,:);
        inliers_b = cur_inliers_b(1:current_inliers,:);
    end
end
There were some decisions that i had to make in order to get the best producing results. The first of which was the threshold, or the delta noted in the diagram above. I ended up choosing 0.005 because it was was small enough to return only good results, but it was large enough to allow for tiny margins of error.
Another decision that i had to make was the choice on the number of iterations to run. I wanted to sample enough points to ensure finding an optimal result each calculation, but i also didn't want to sacrifice a lot of computational time for only a slight increase in accuracy. After fine-tuning the iterations around a bit, i stuck with 3500 iterations since it satisfied both of the criteria i just mentioned.
Finally, I decided it to limit the results to only 30 entries so that i can create an uncluttered visualization of the epipolar lines. I originally decided to take the first 30 as the subset of points for my diagram because I thought that since they all are good candidates due to being lower than the threshold or delta, and thus would yield good results. Thus it wouldn't matter which 30 points to take. However, I realized that these points are usually clustered together, and are not randomly placed throughout the image, and thus most of the matches that we see in the results below are usually around the same region, which is why I ended up randomly sampling for 30 points.
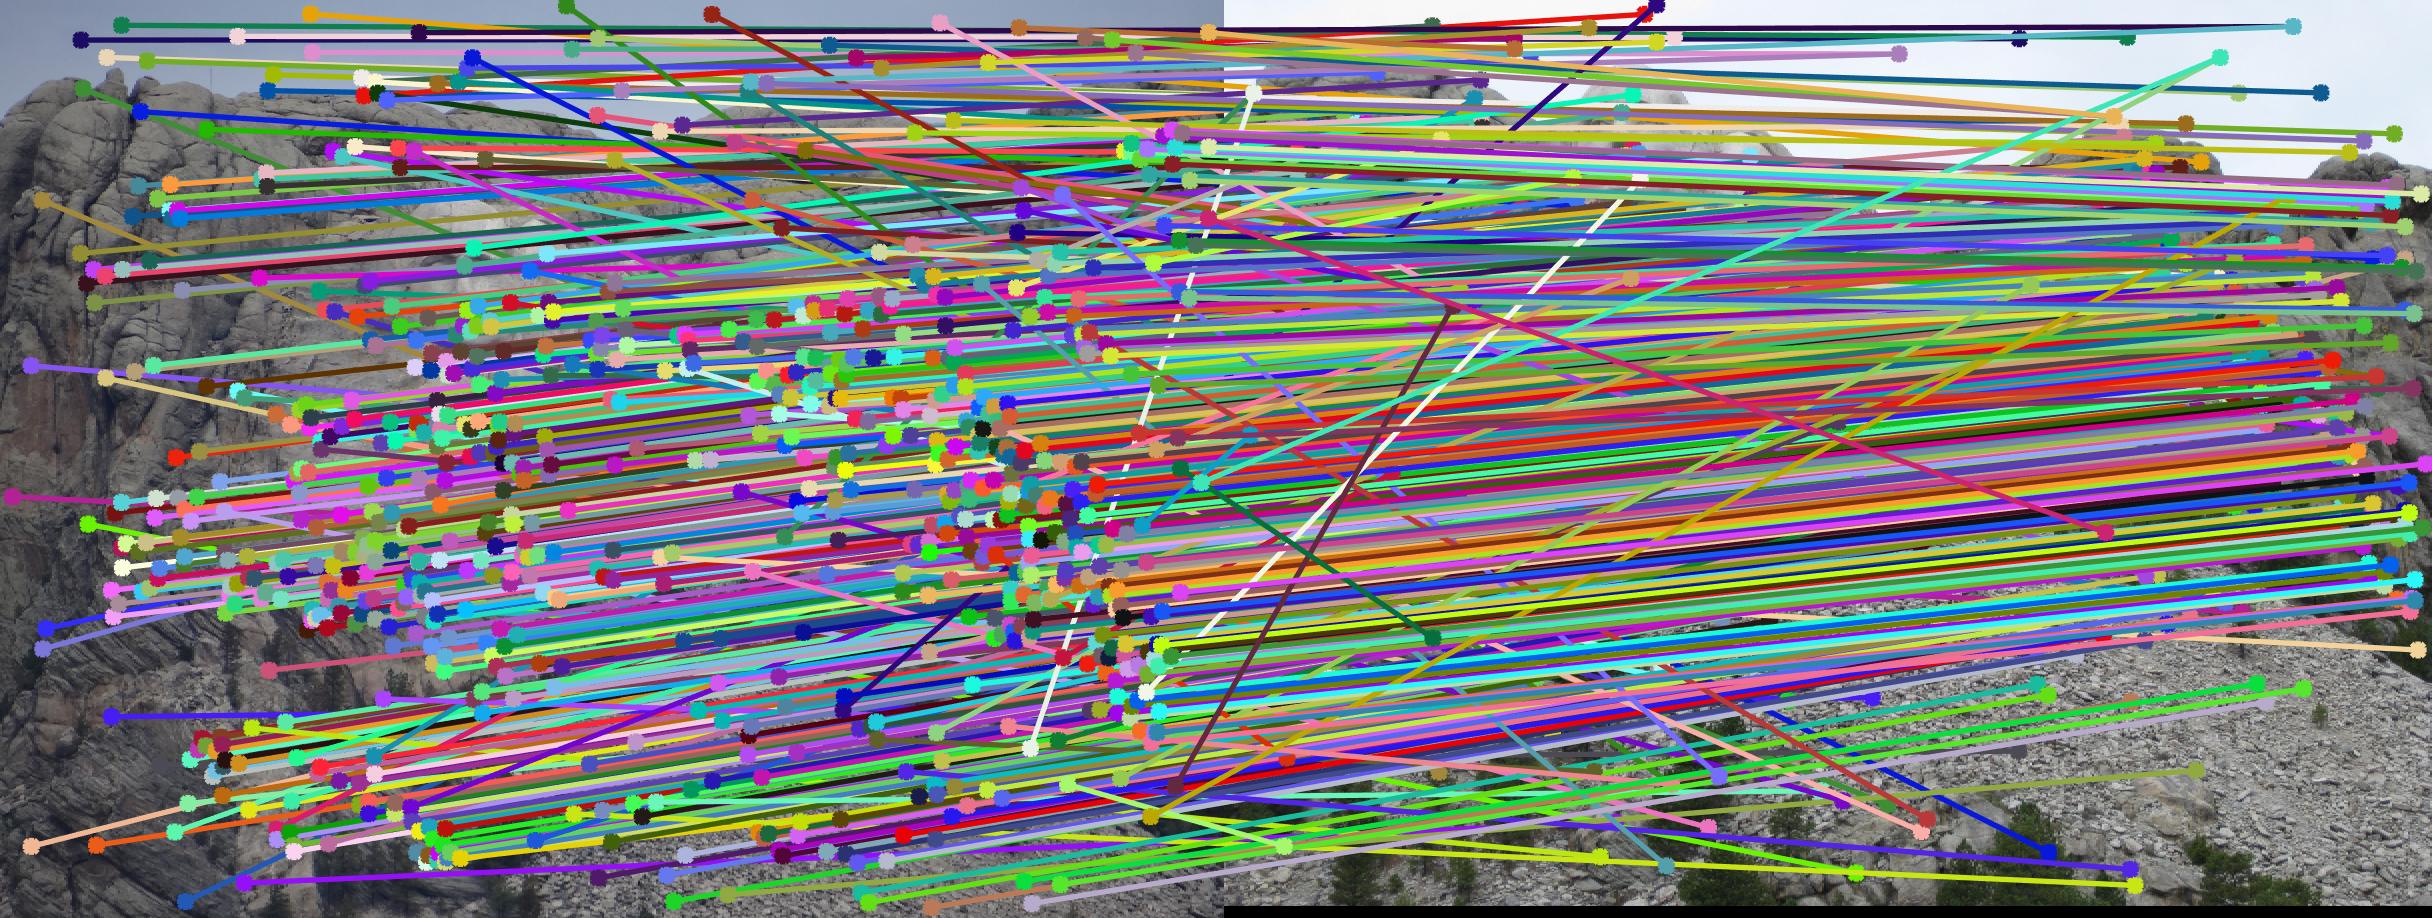
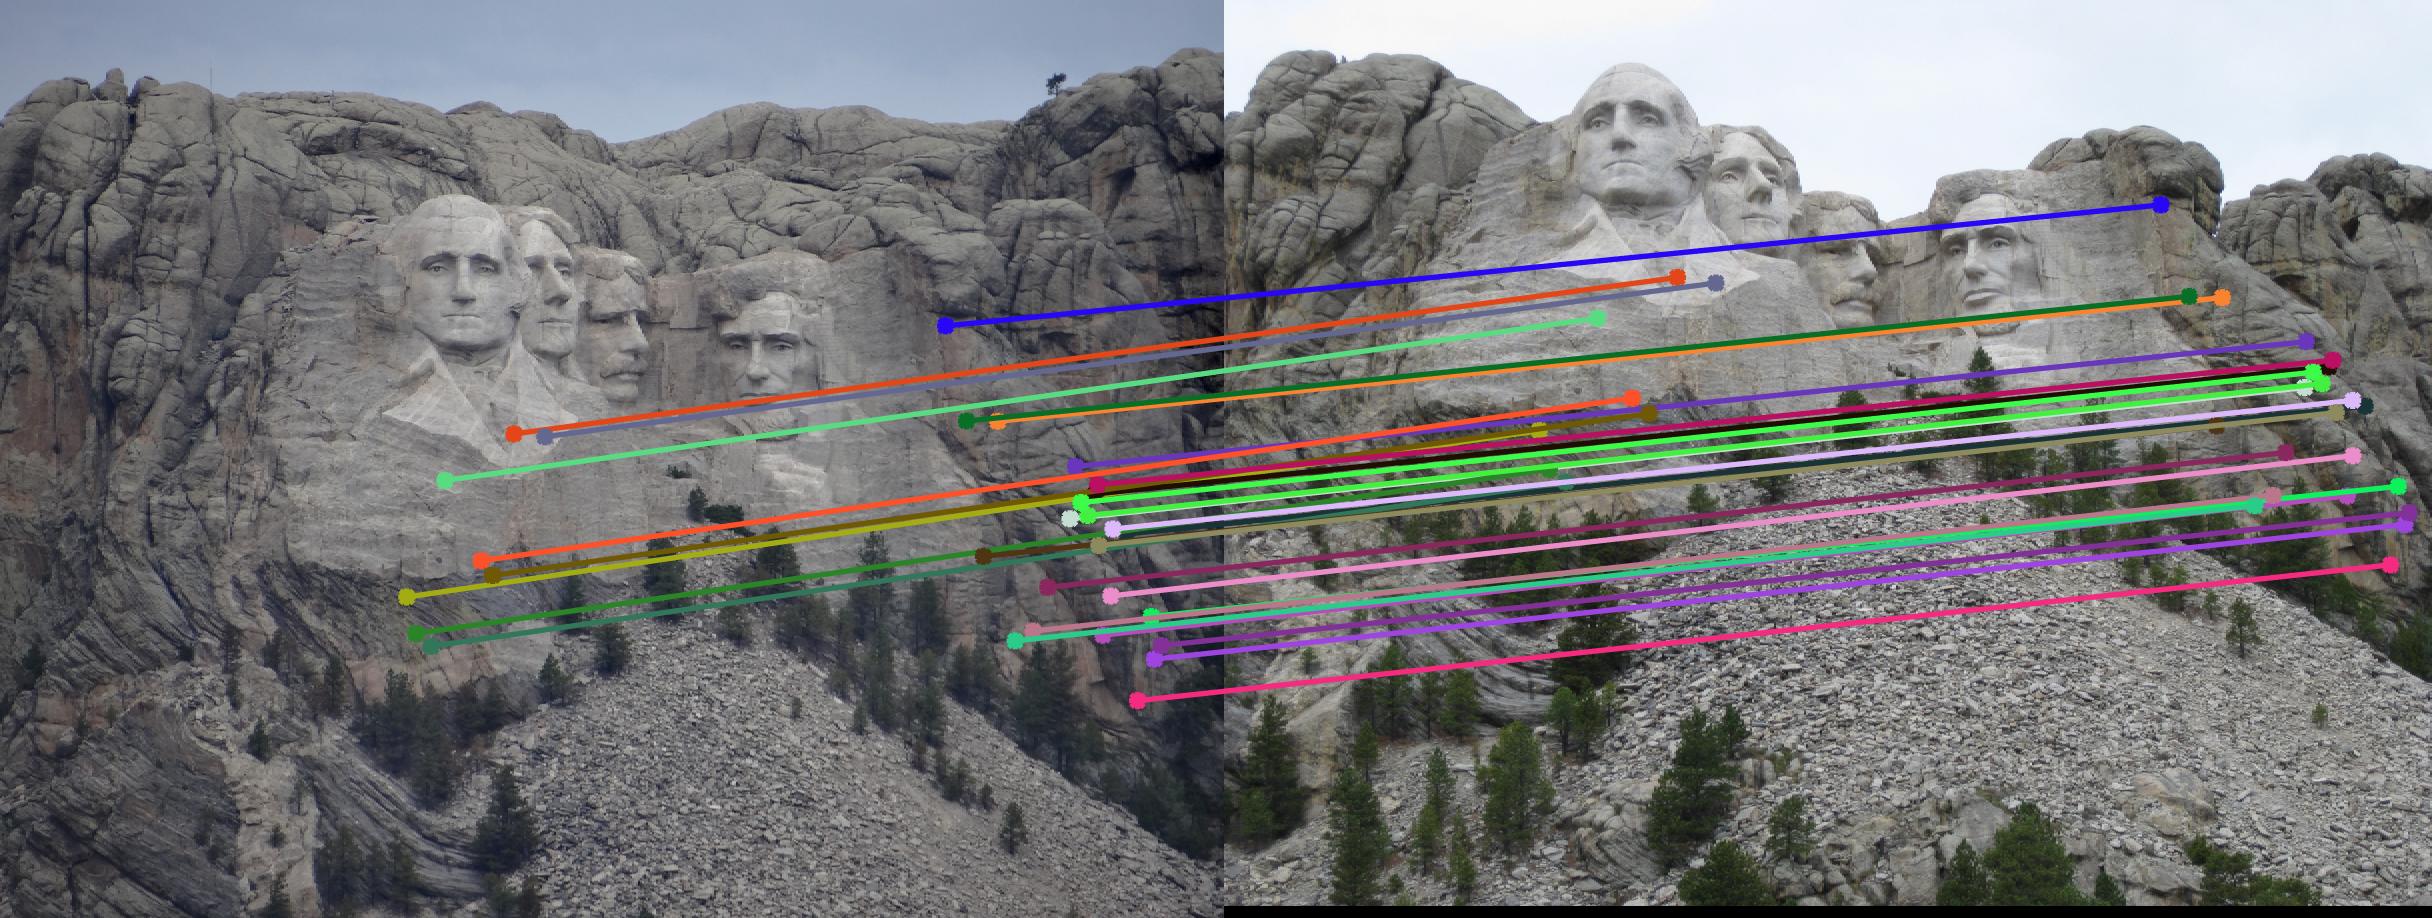
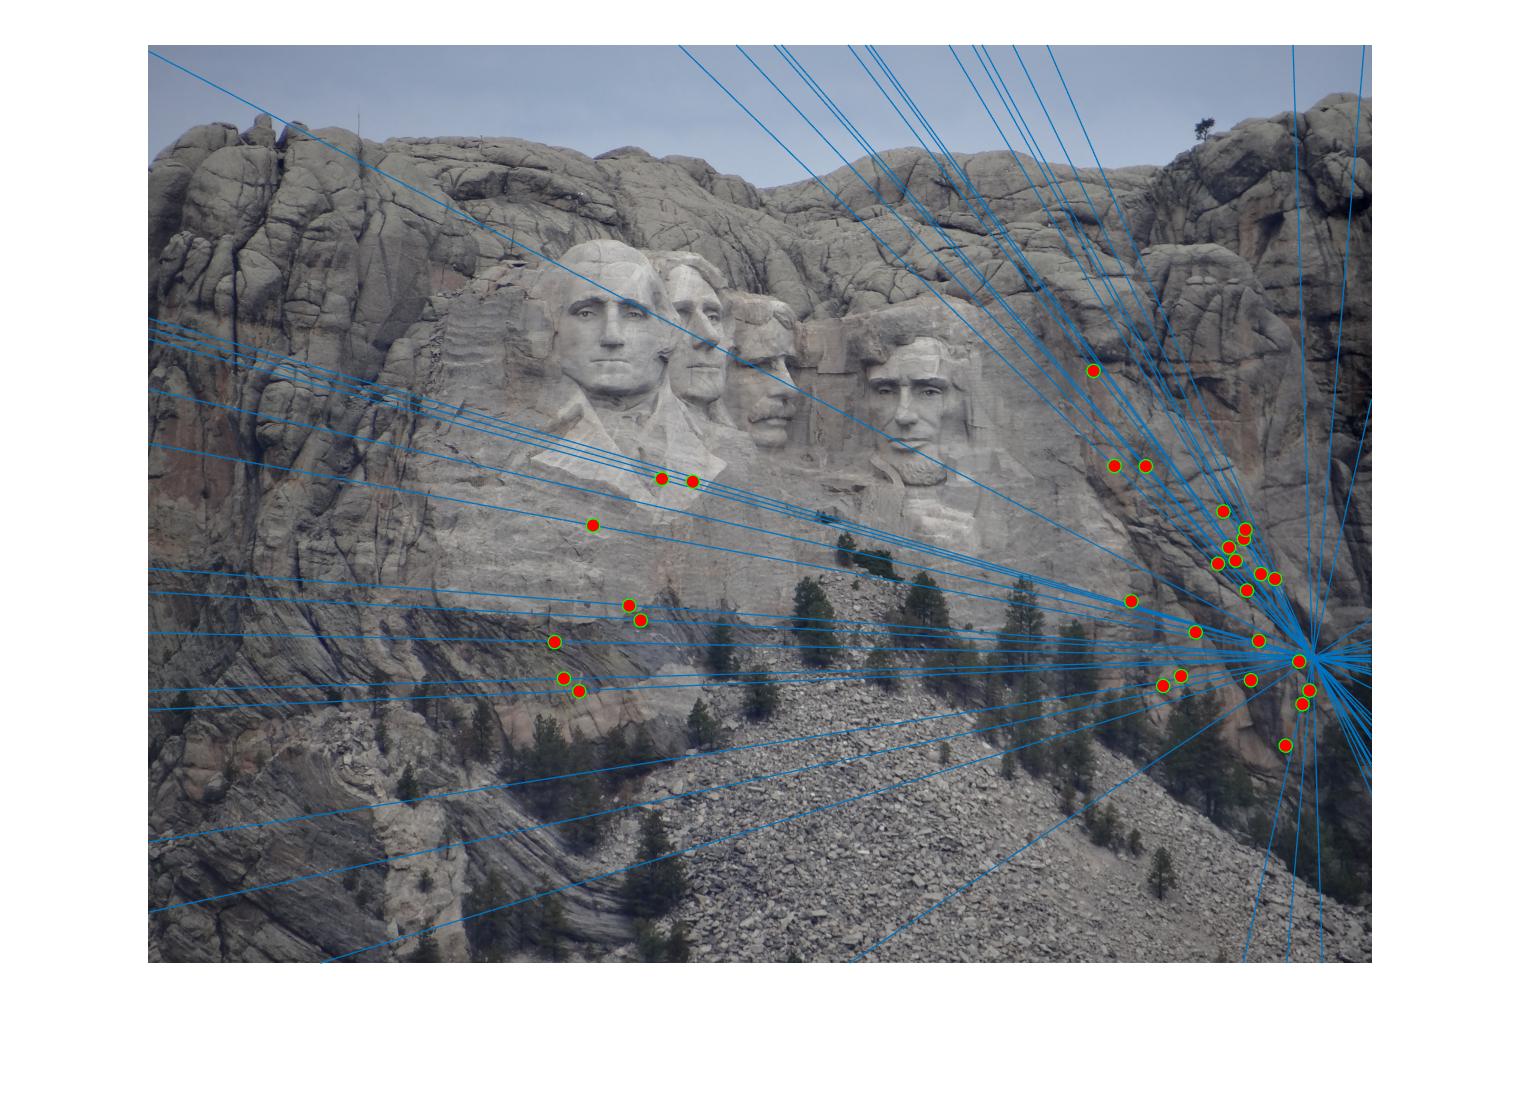
RANSAC on Mount Rushmore
|

|
The top left is the sift results, which is very cluttered, but you can tell that there are very obvious wrong answers due to some lines not being parallel at all with the other majority points. Overall, this image perfomed the best since there seems to be no incorrect matchings, which can be verified by identical feature point locations in both of the epipolar-lined images.
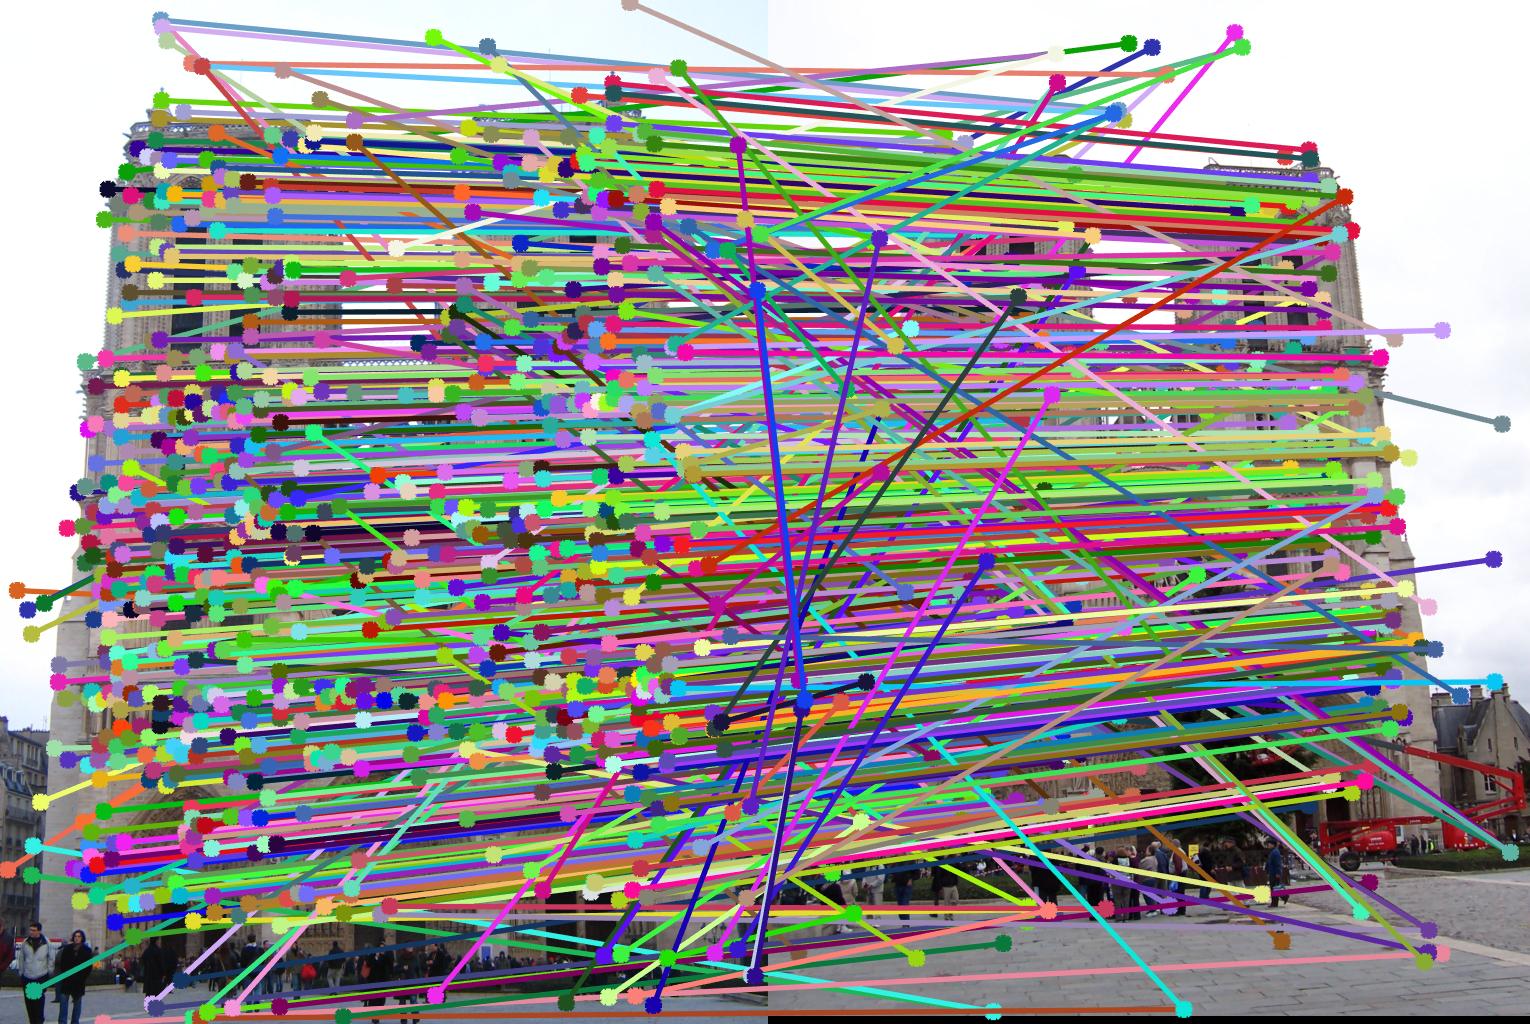
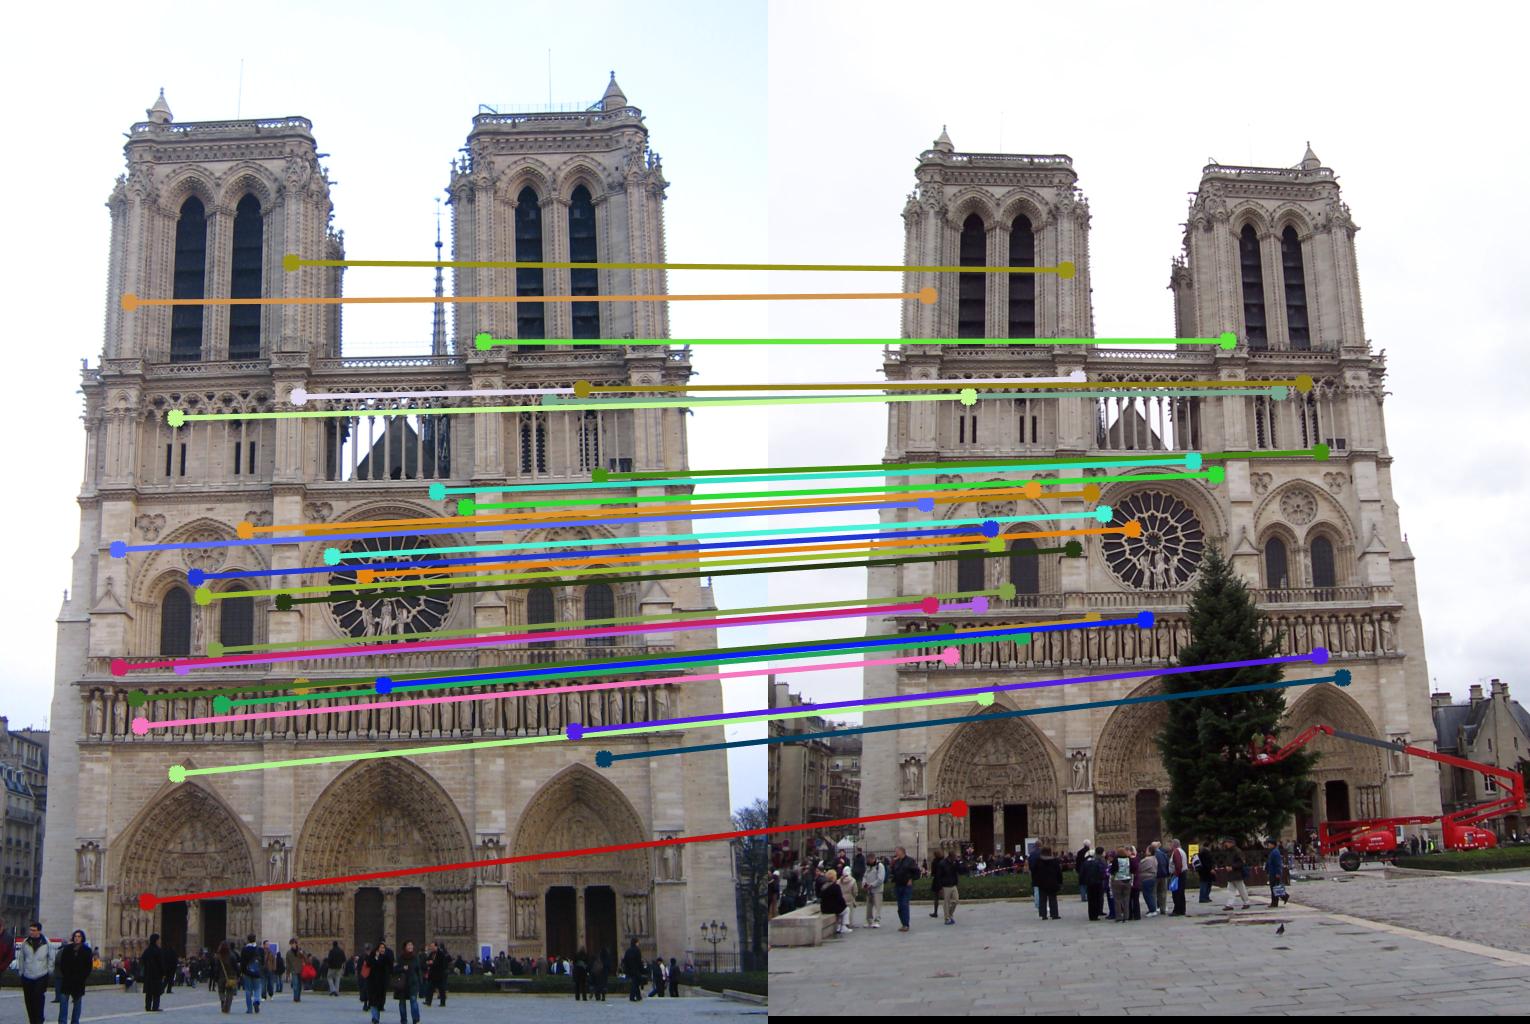
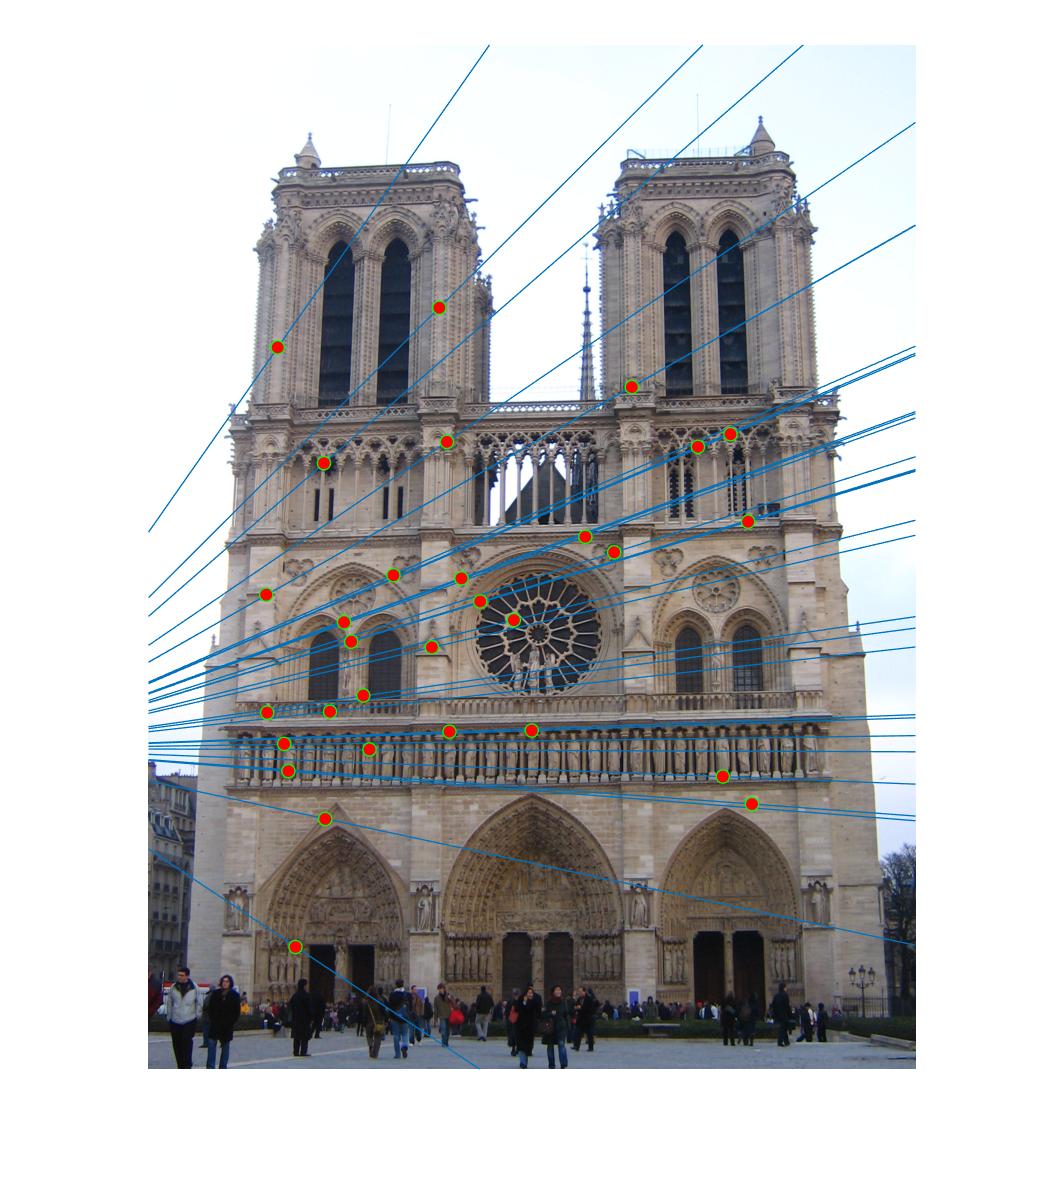
RANSAC on Notre Dame
|
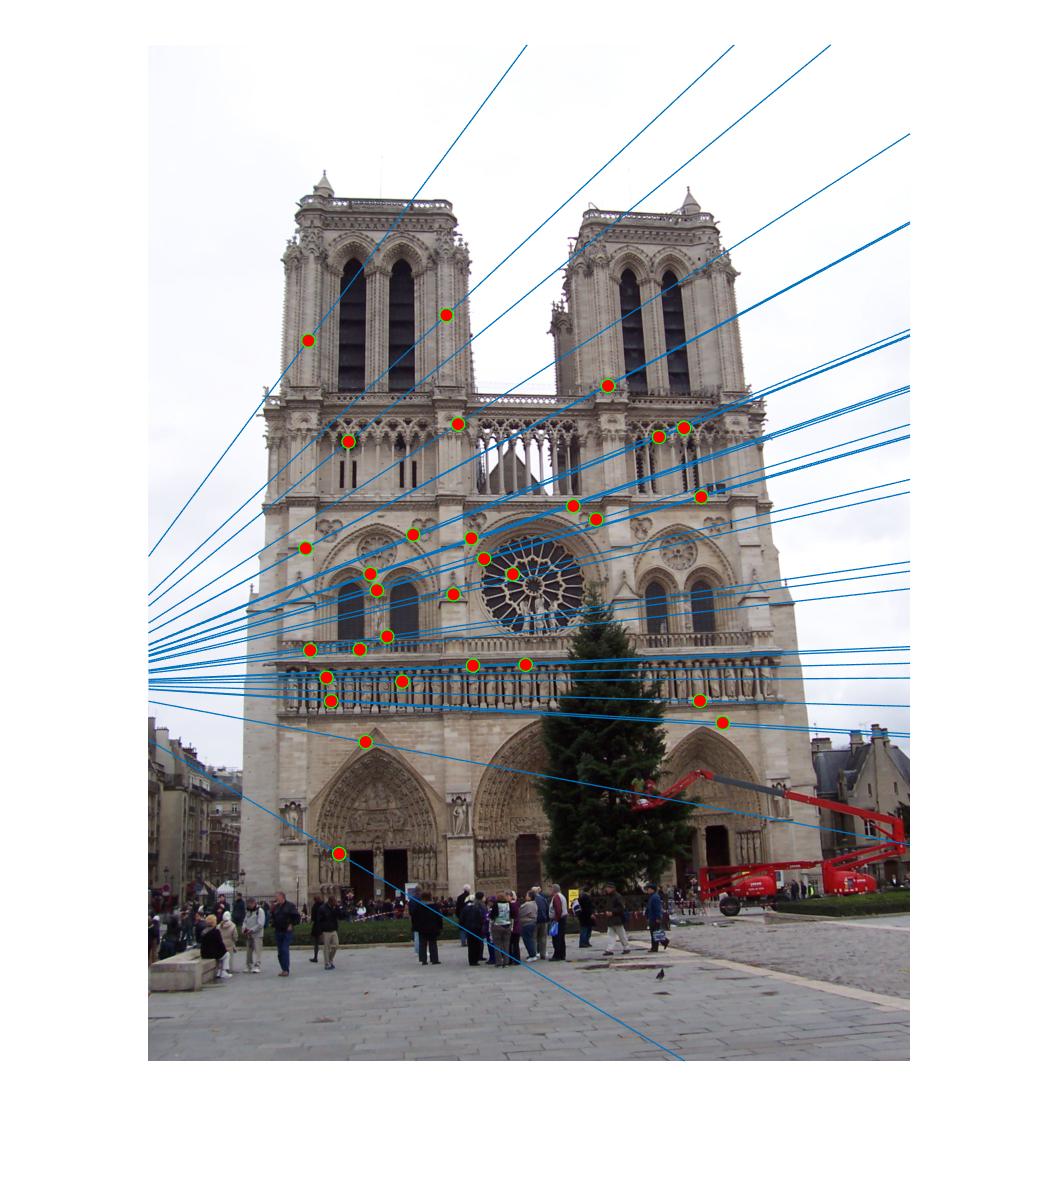
|
This also produces very good results. The reason as to why I think that this produced good results is because the two camera centers are very close and similar to each other. If anything there seems to be a slight angle change, thus making it very easy for RANSAC to do well.
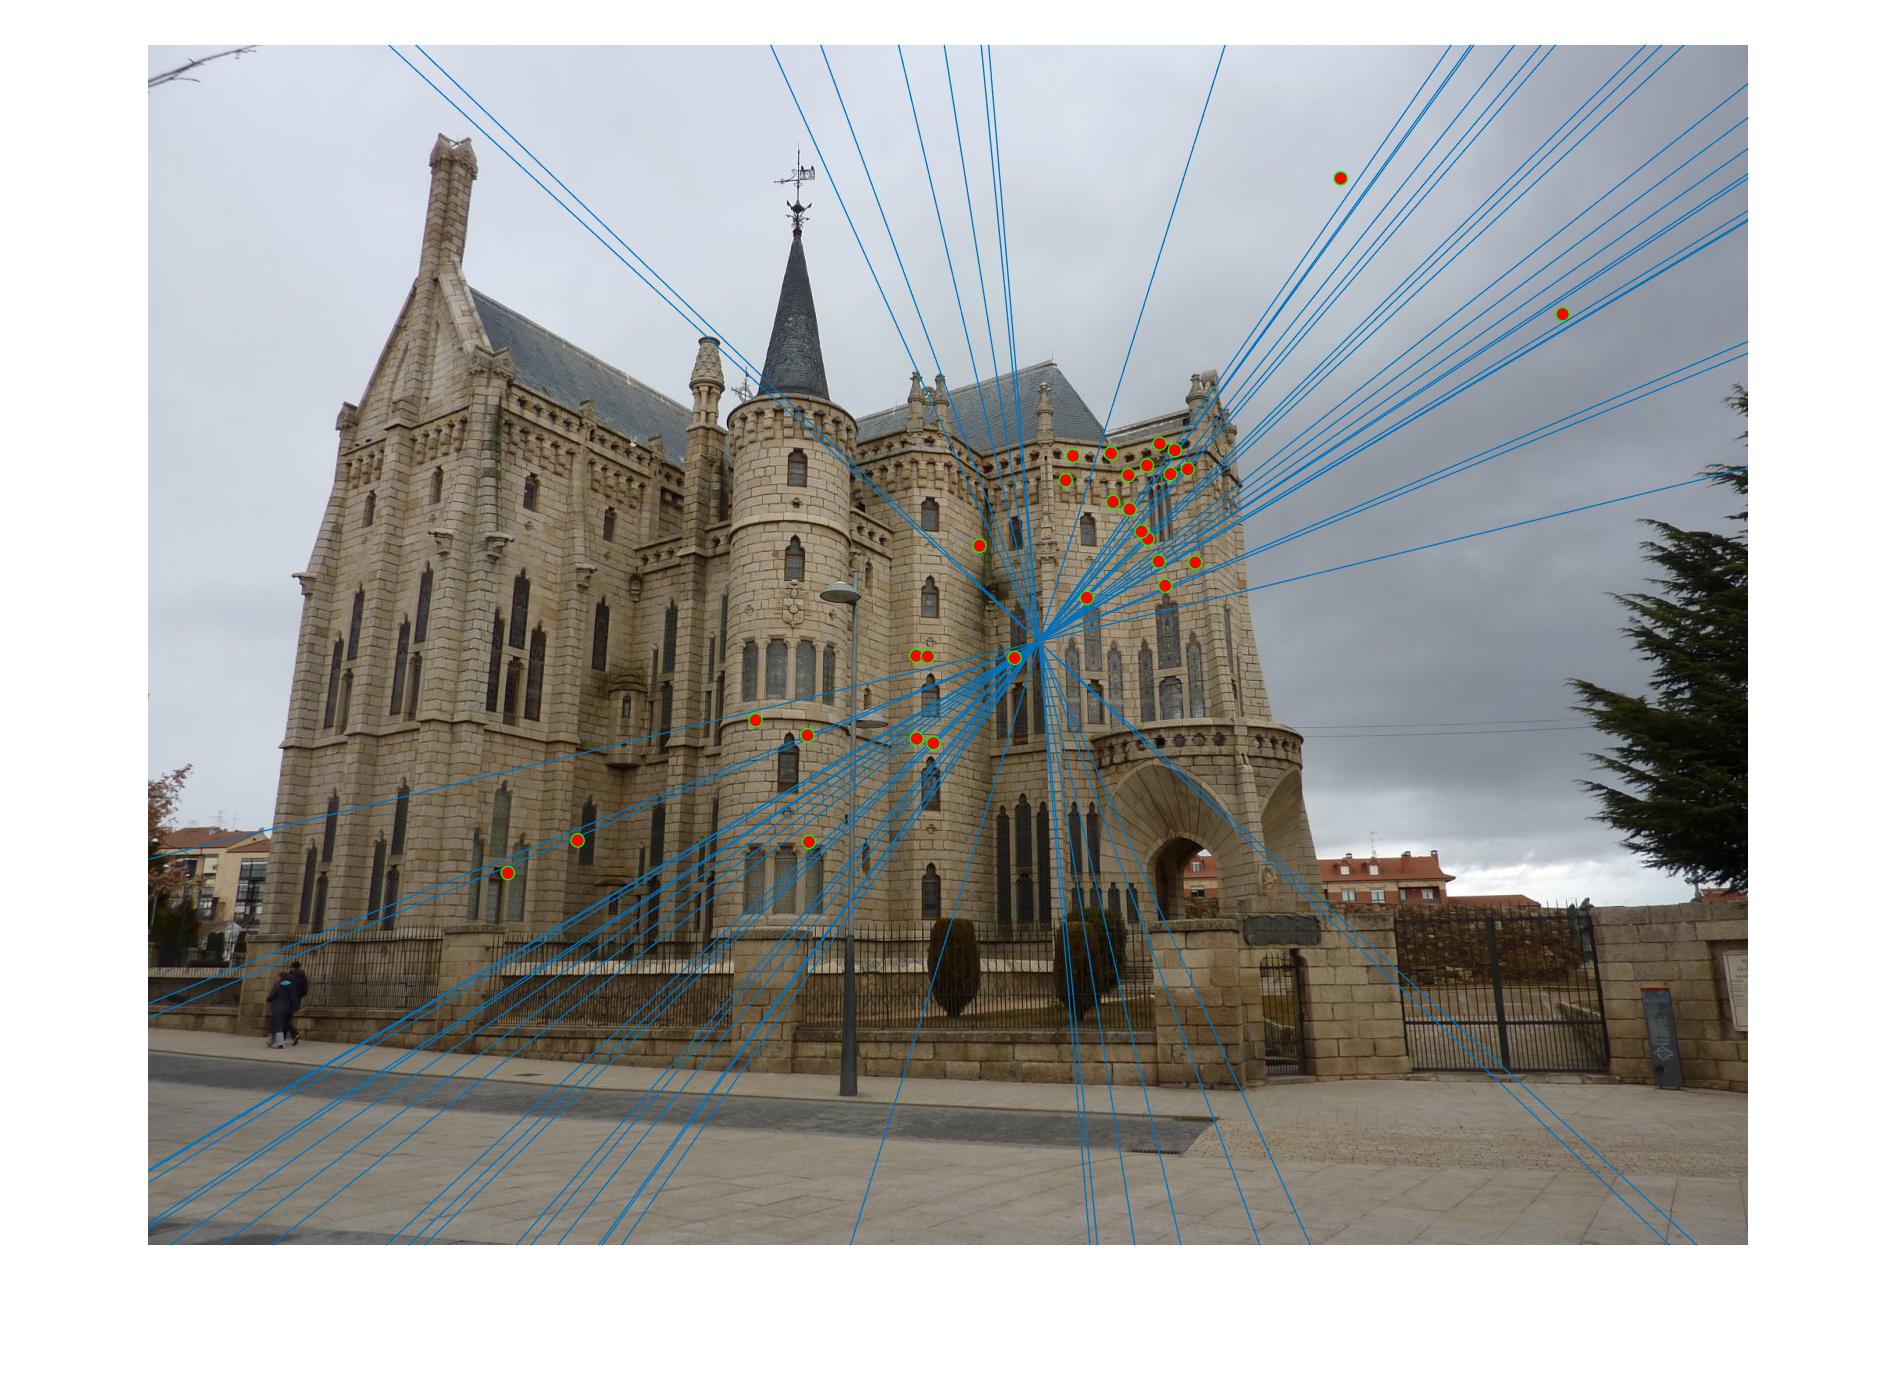
RANSAC on Episcopal Gaudi
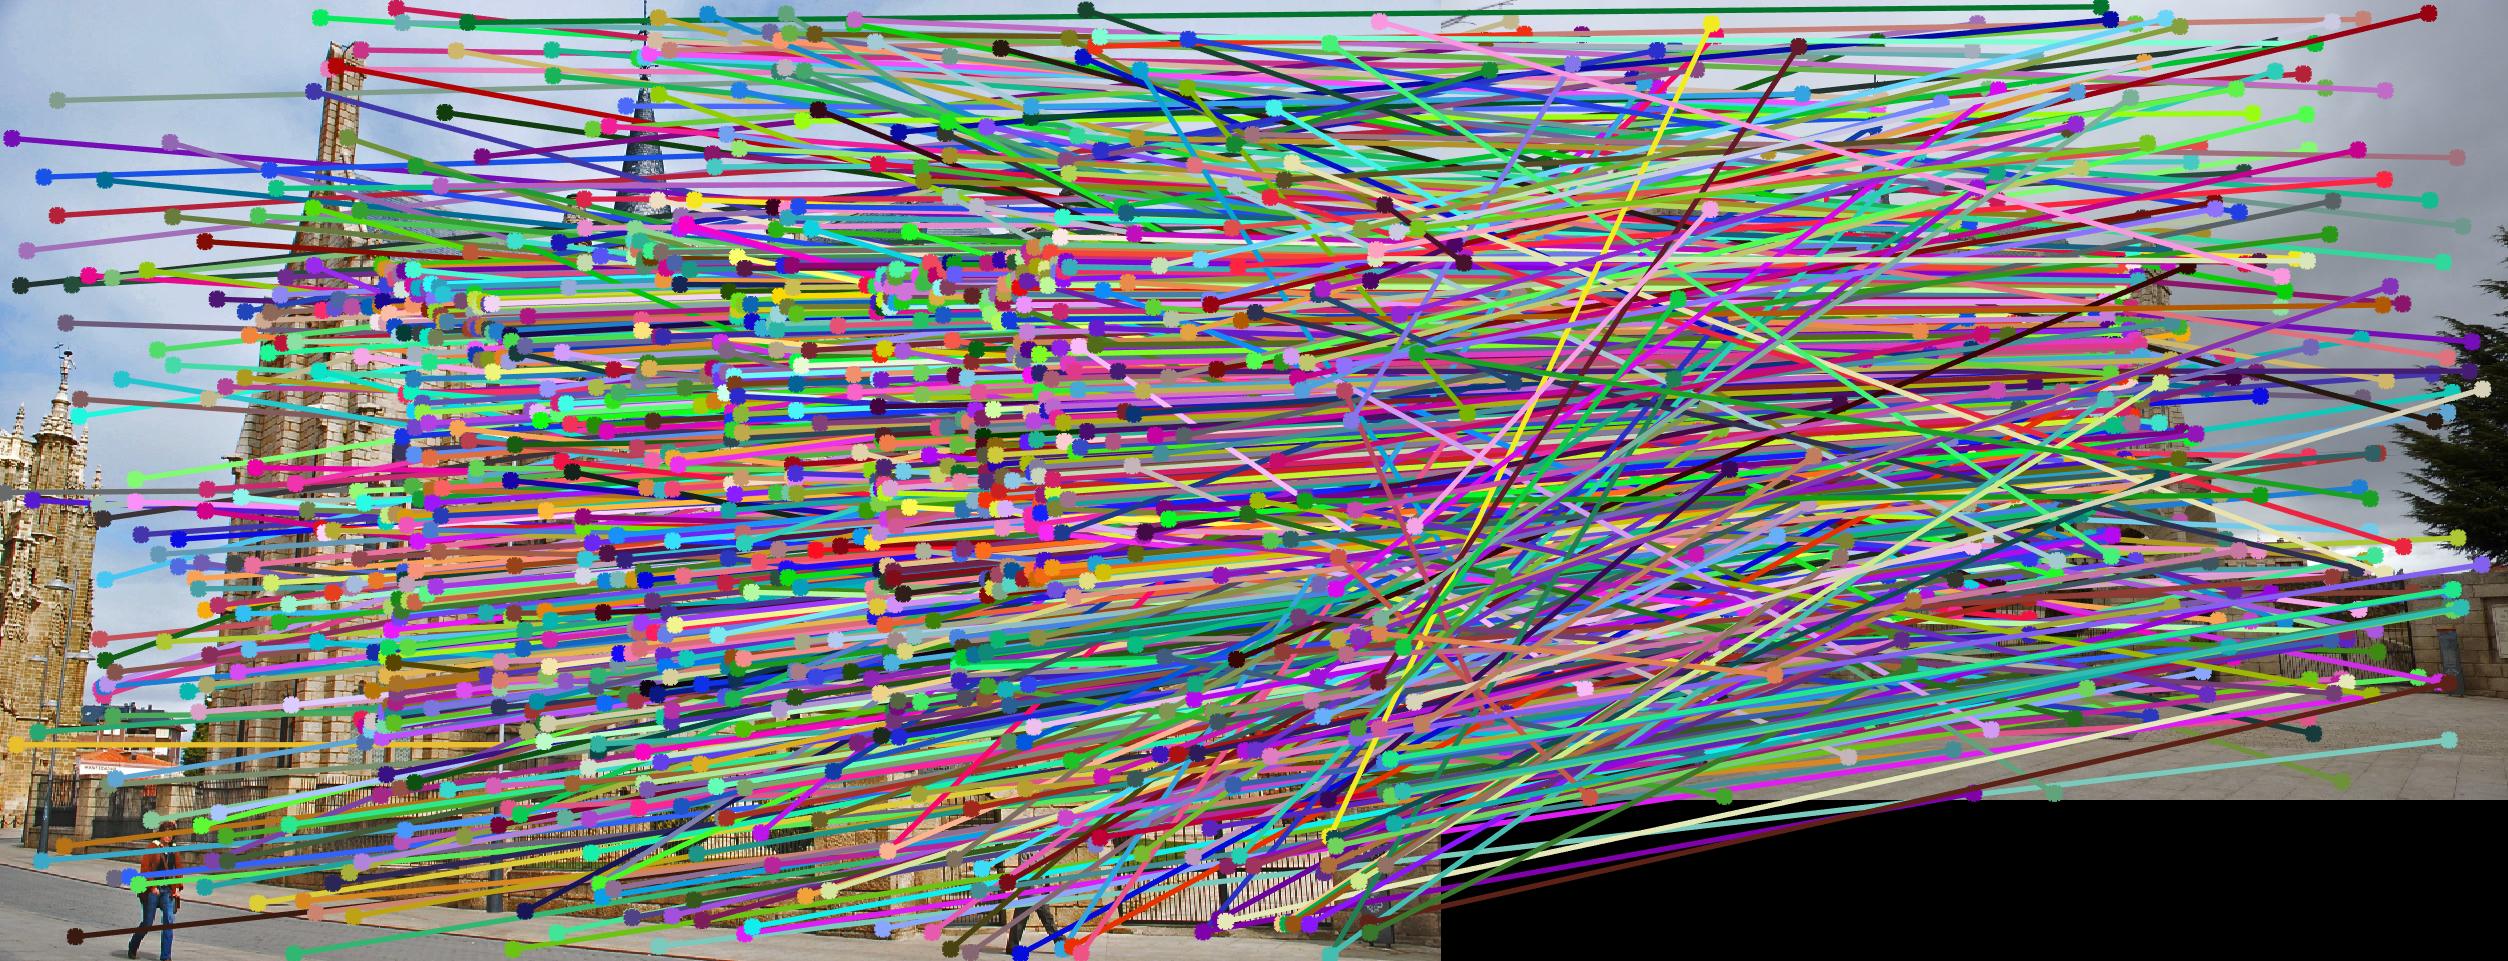
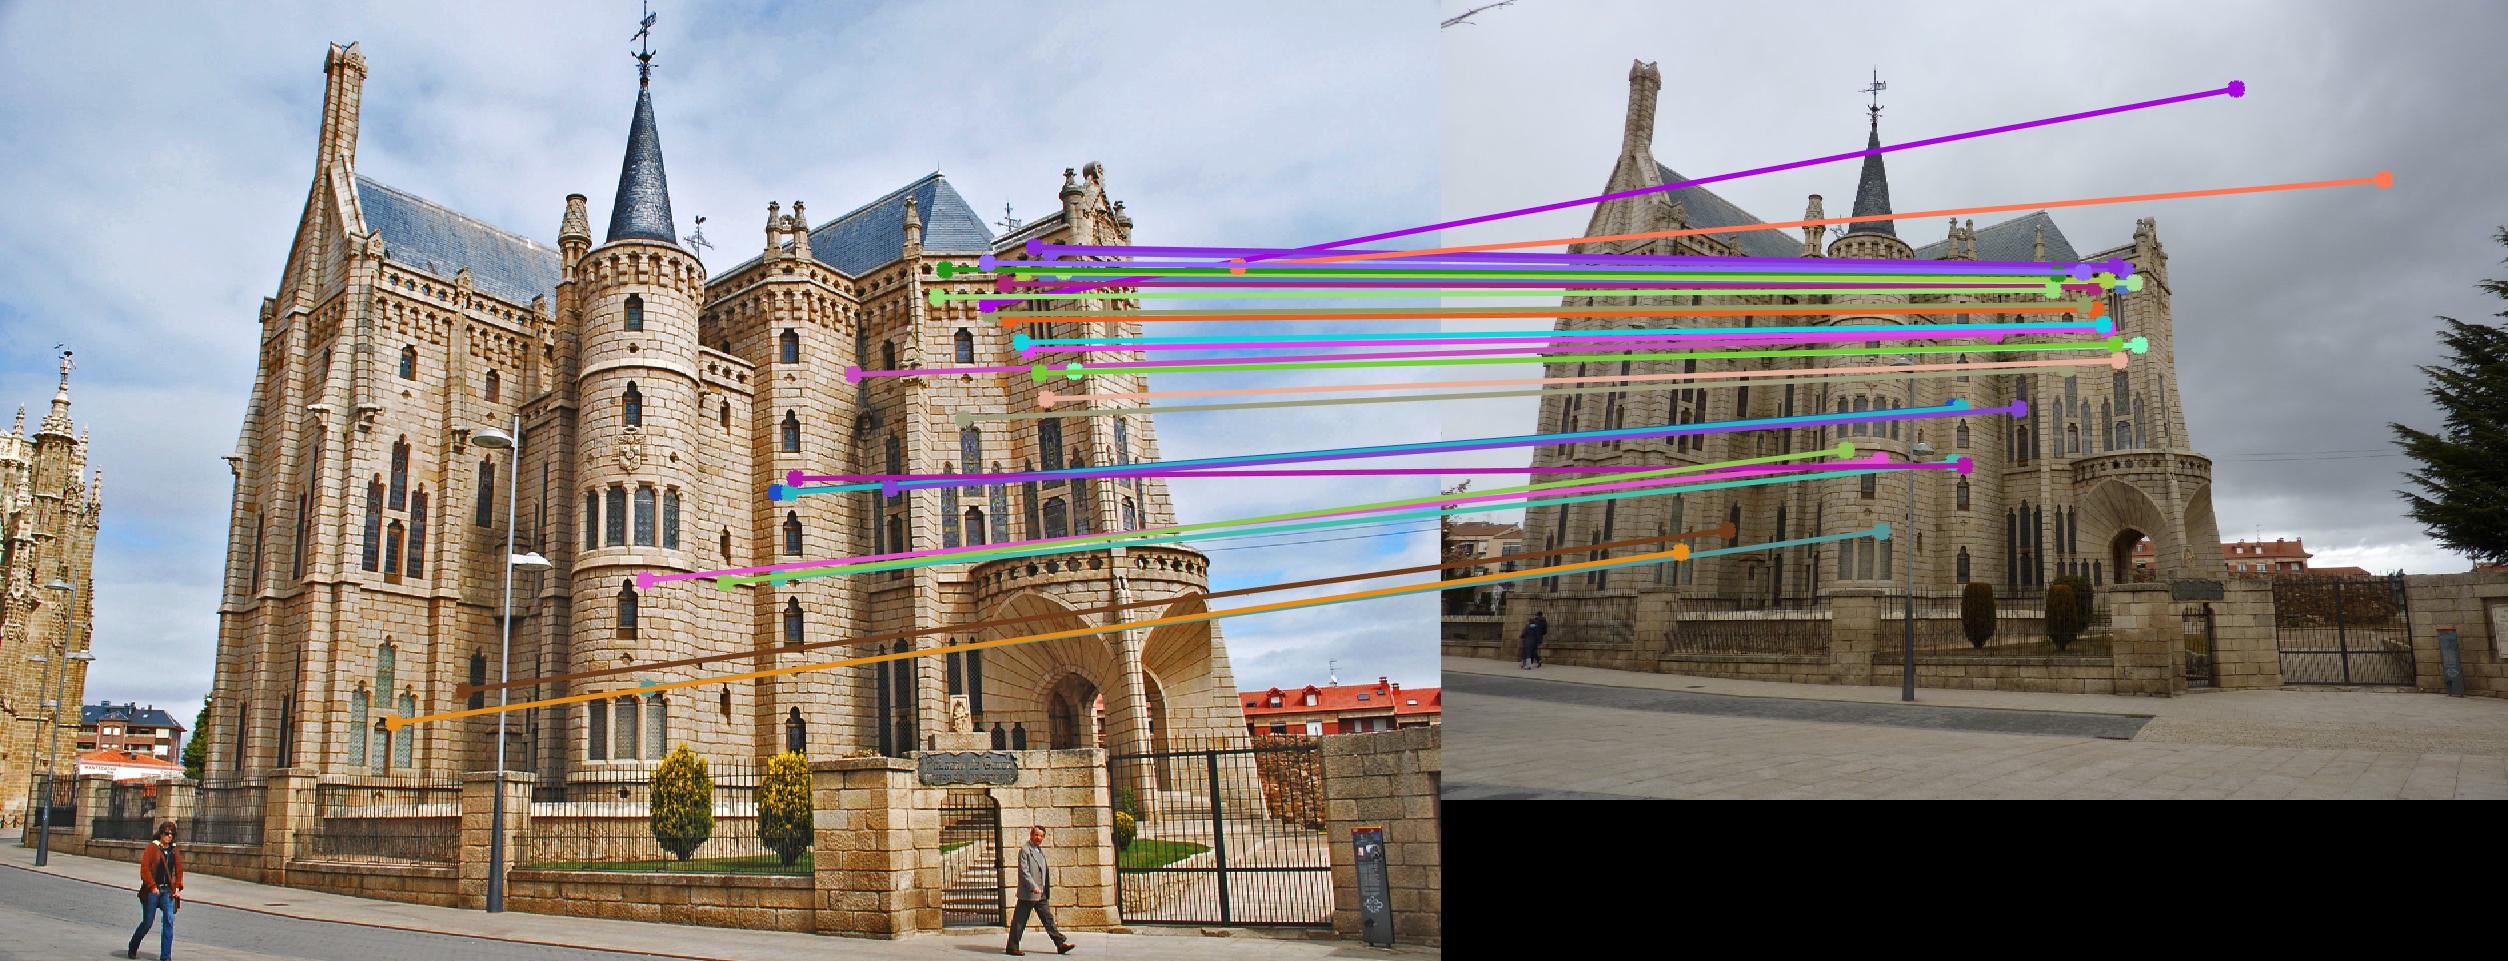
|
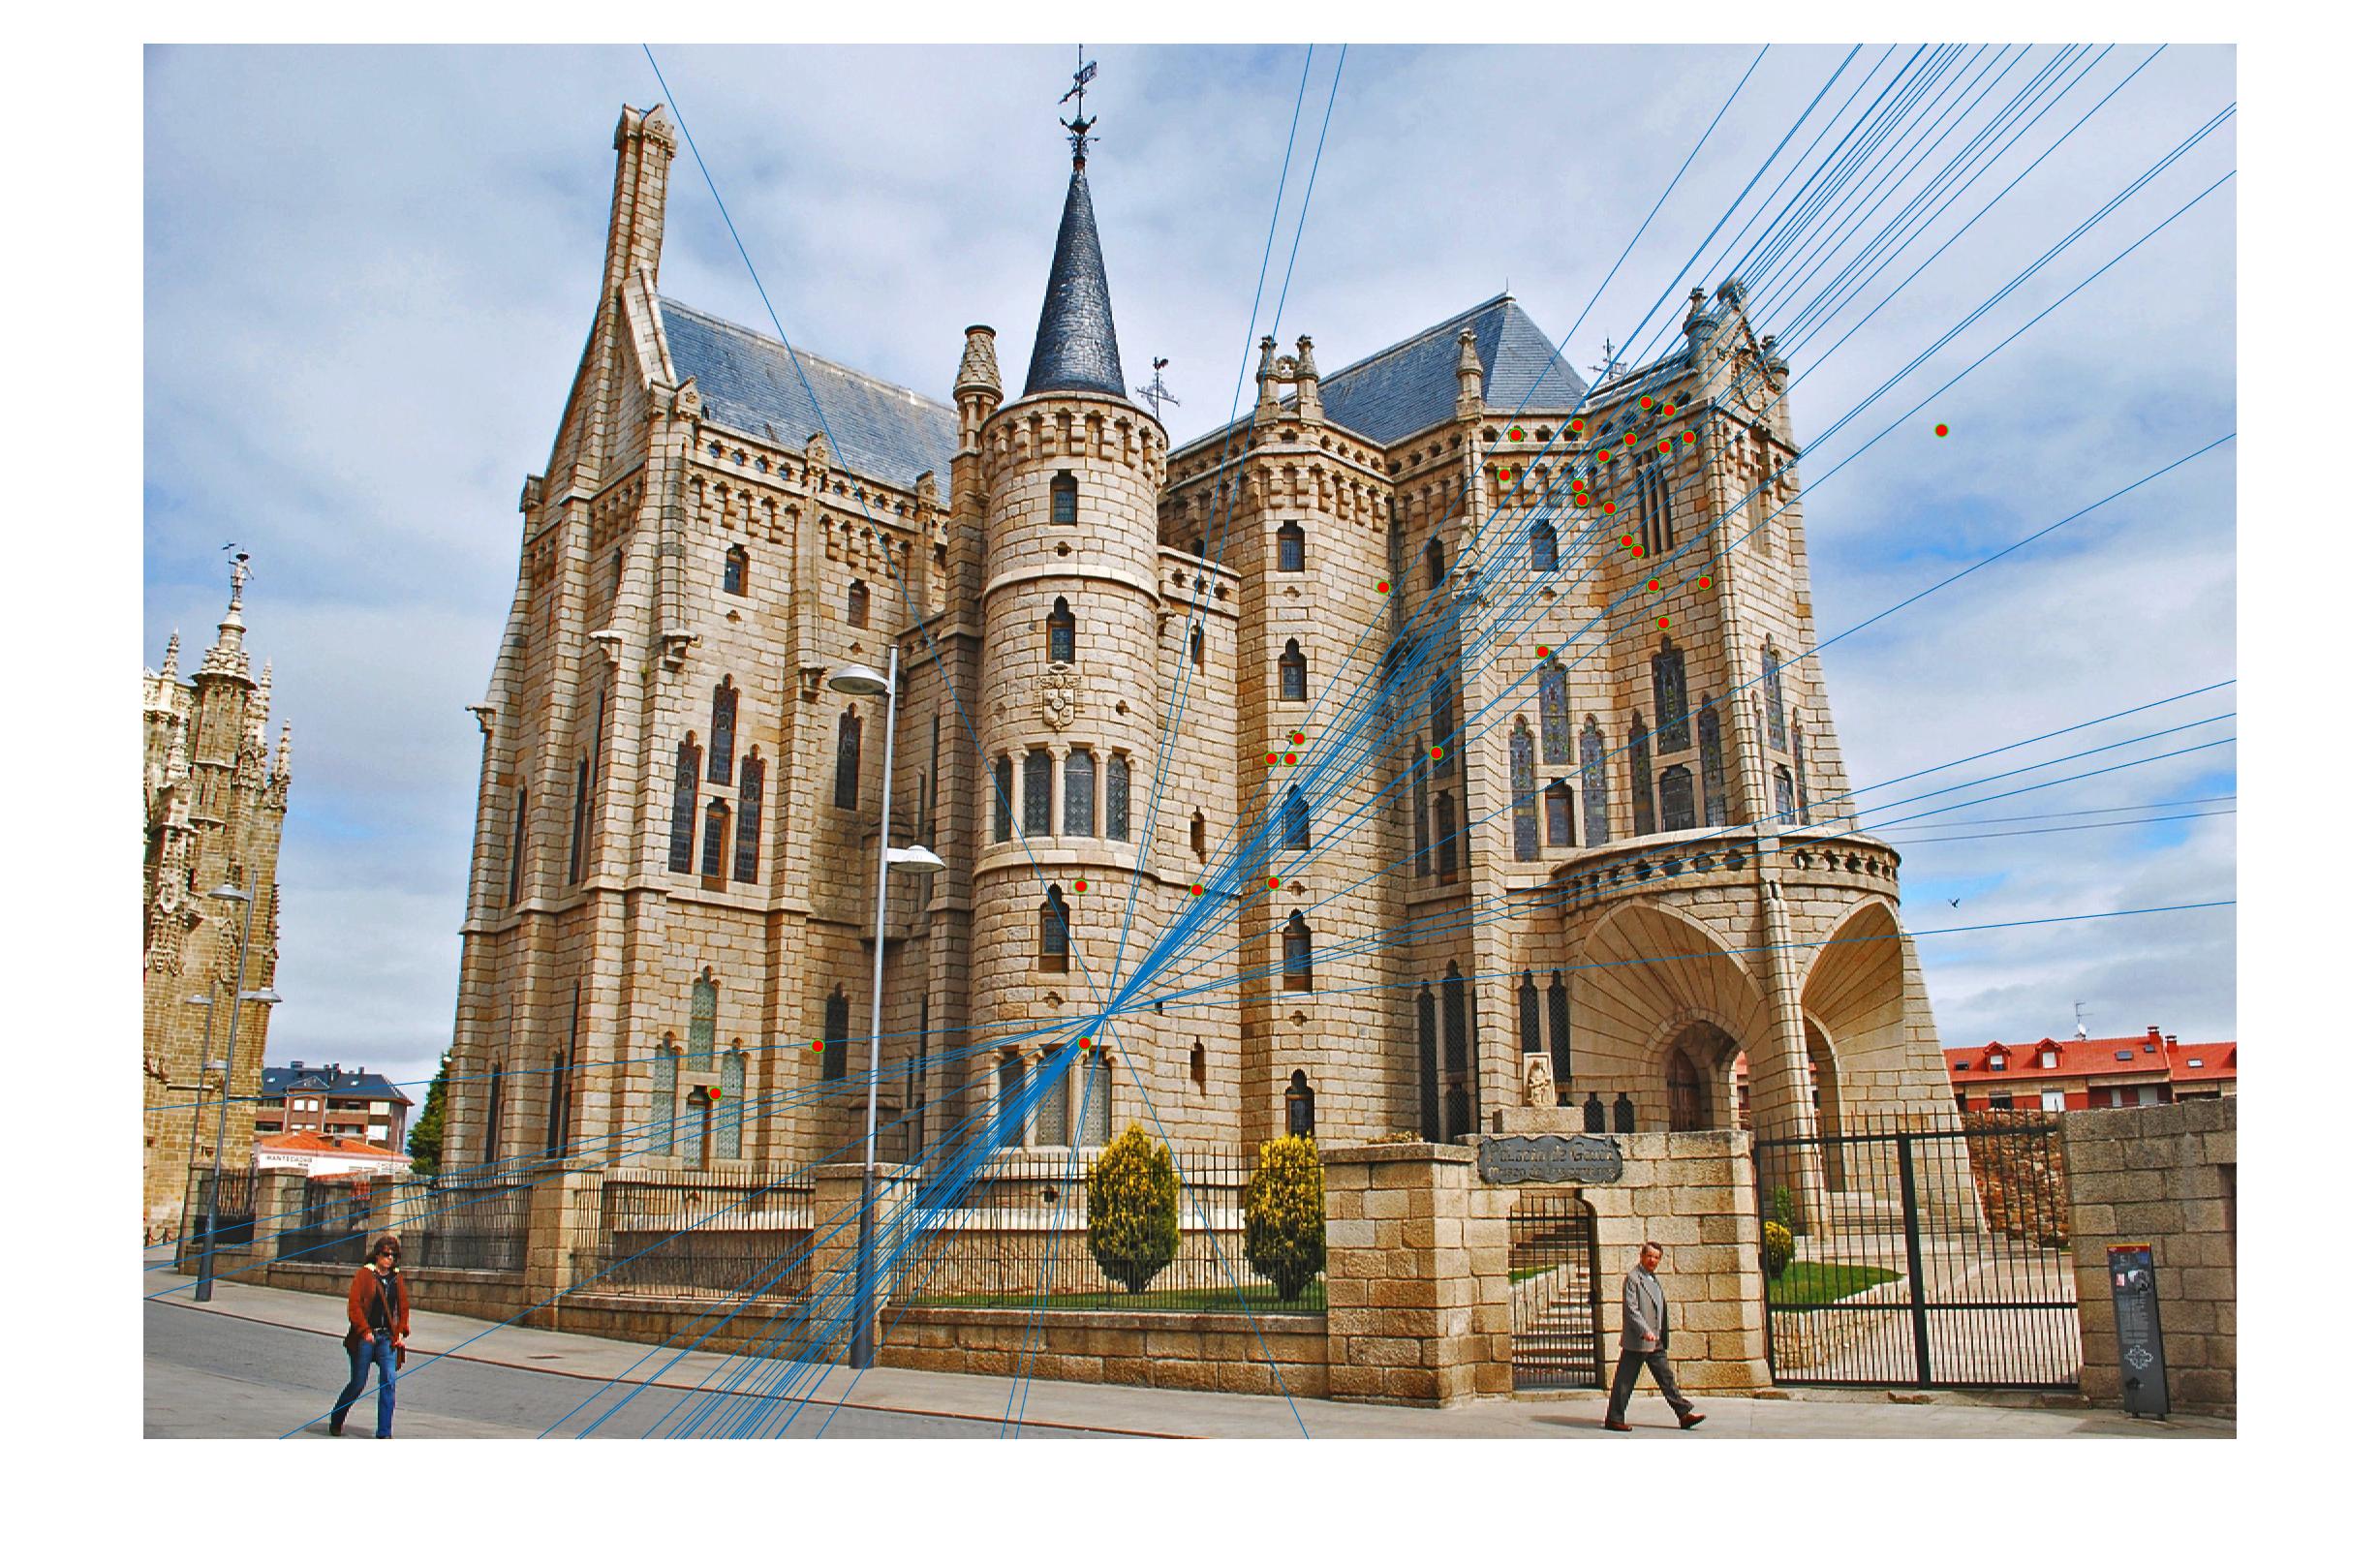
|
This by far, performed the worst out of all of the images. There were some very obvious errors such as some matchings in the sky, but other than that, it got a majority of the matchings correct. This is most likely due to the uneven resolution settings between the two images, which thus makes it very hard for the two images to be accurately matched upon.
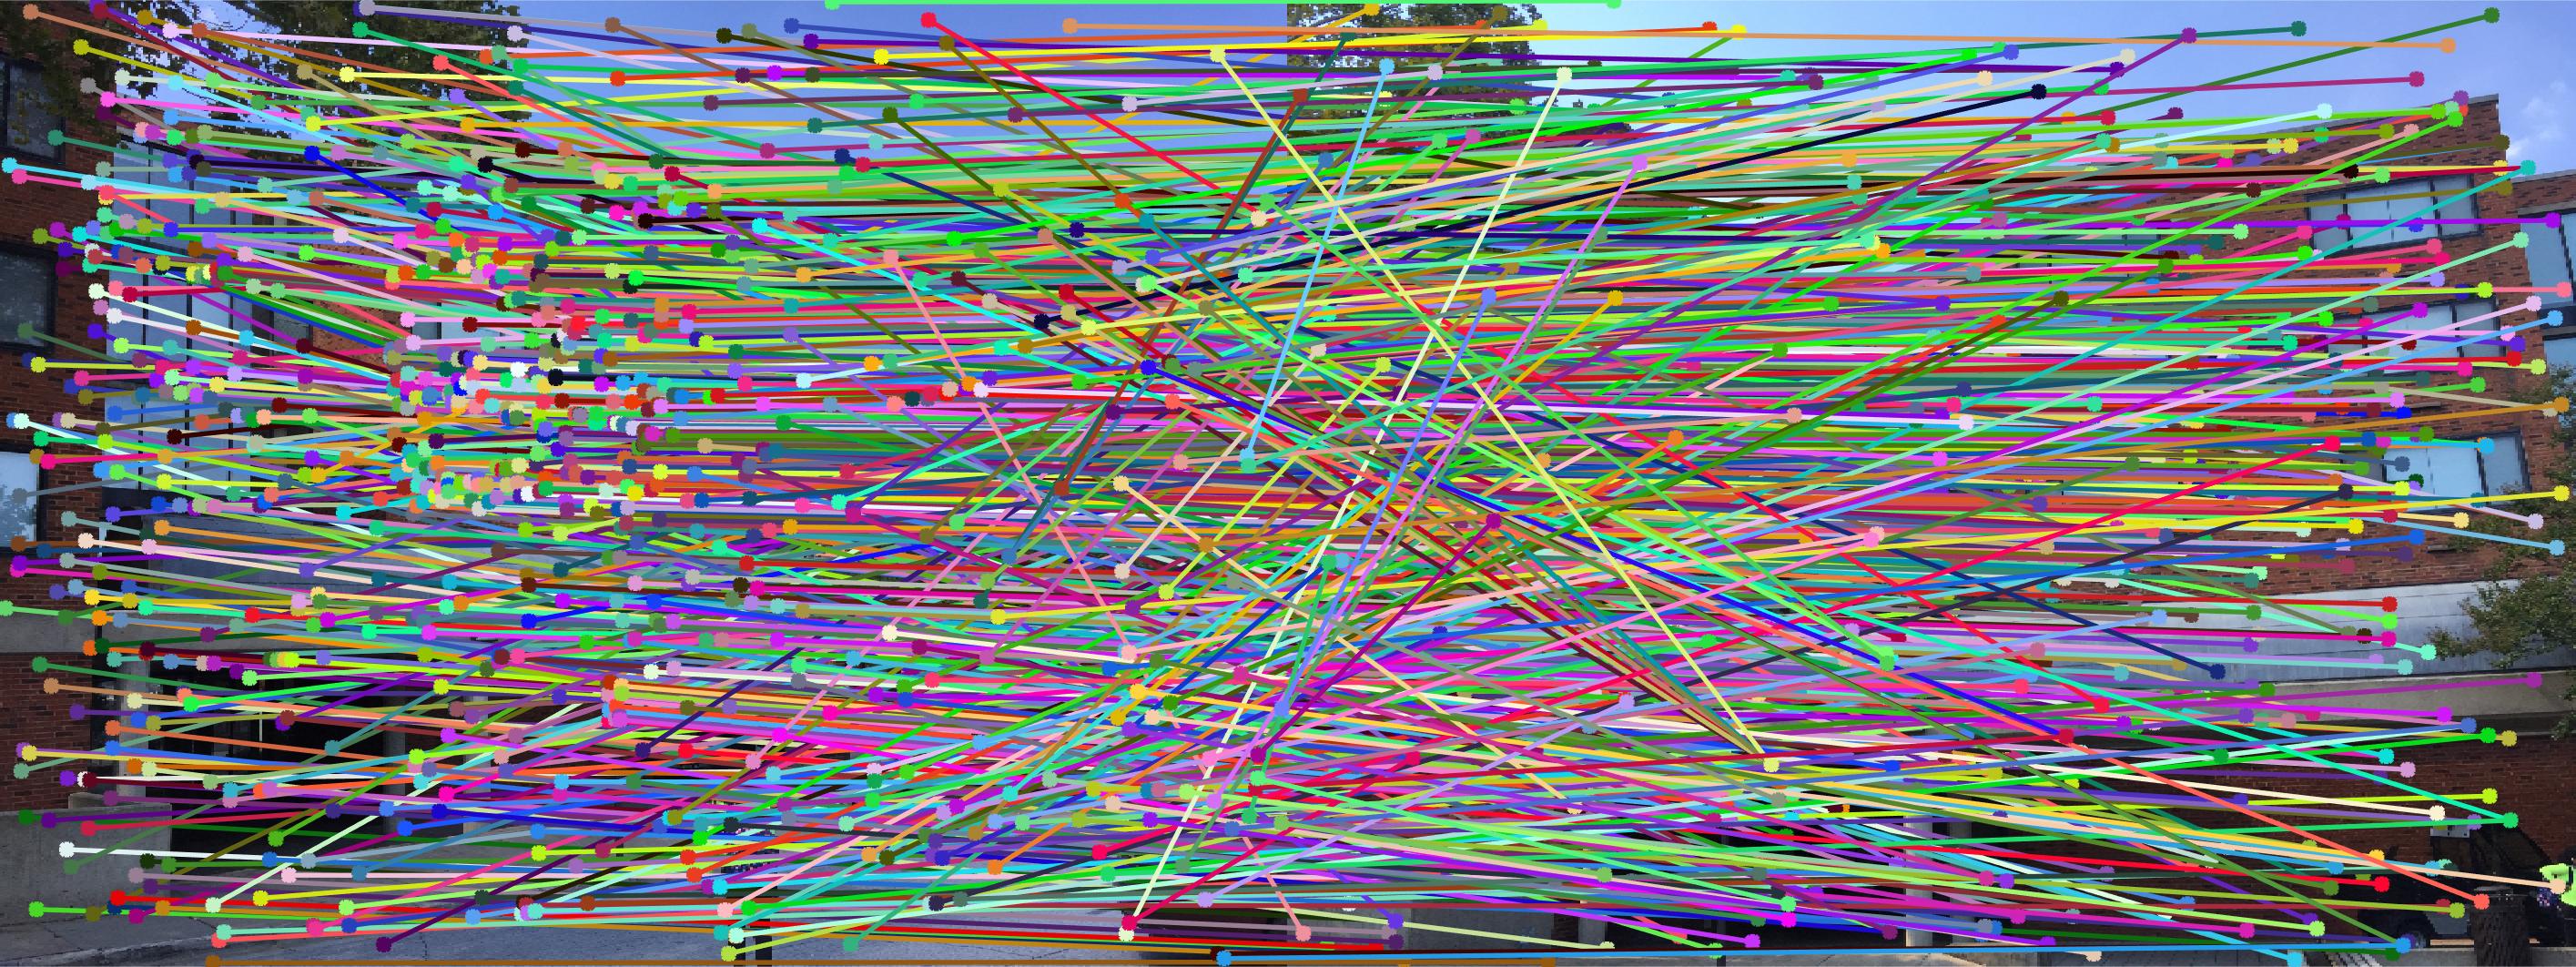
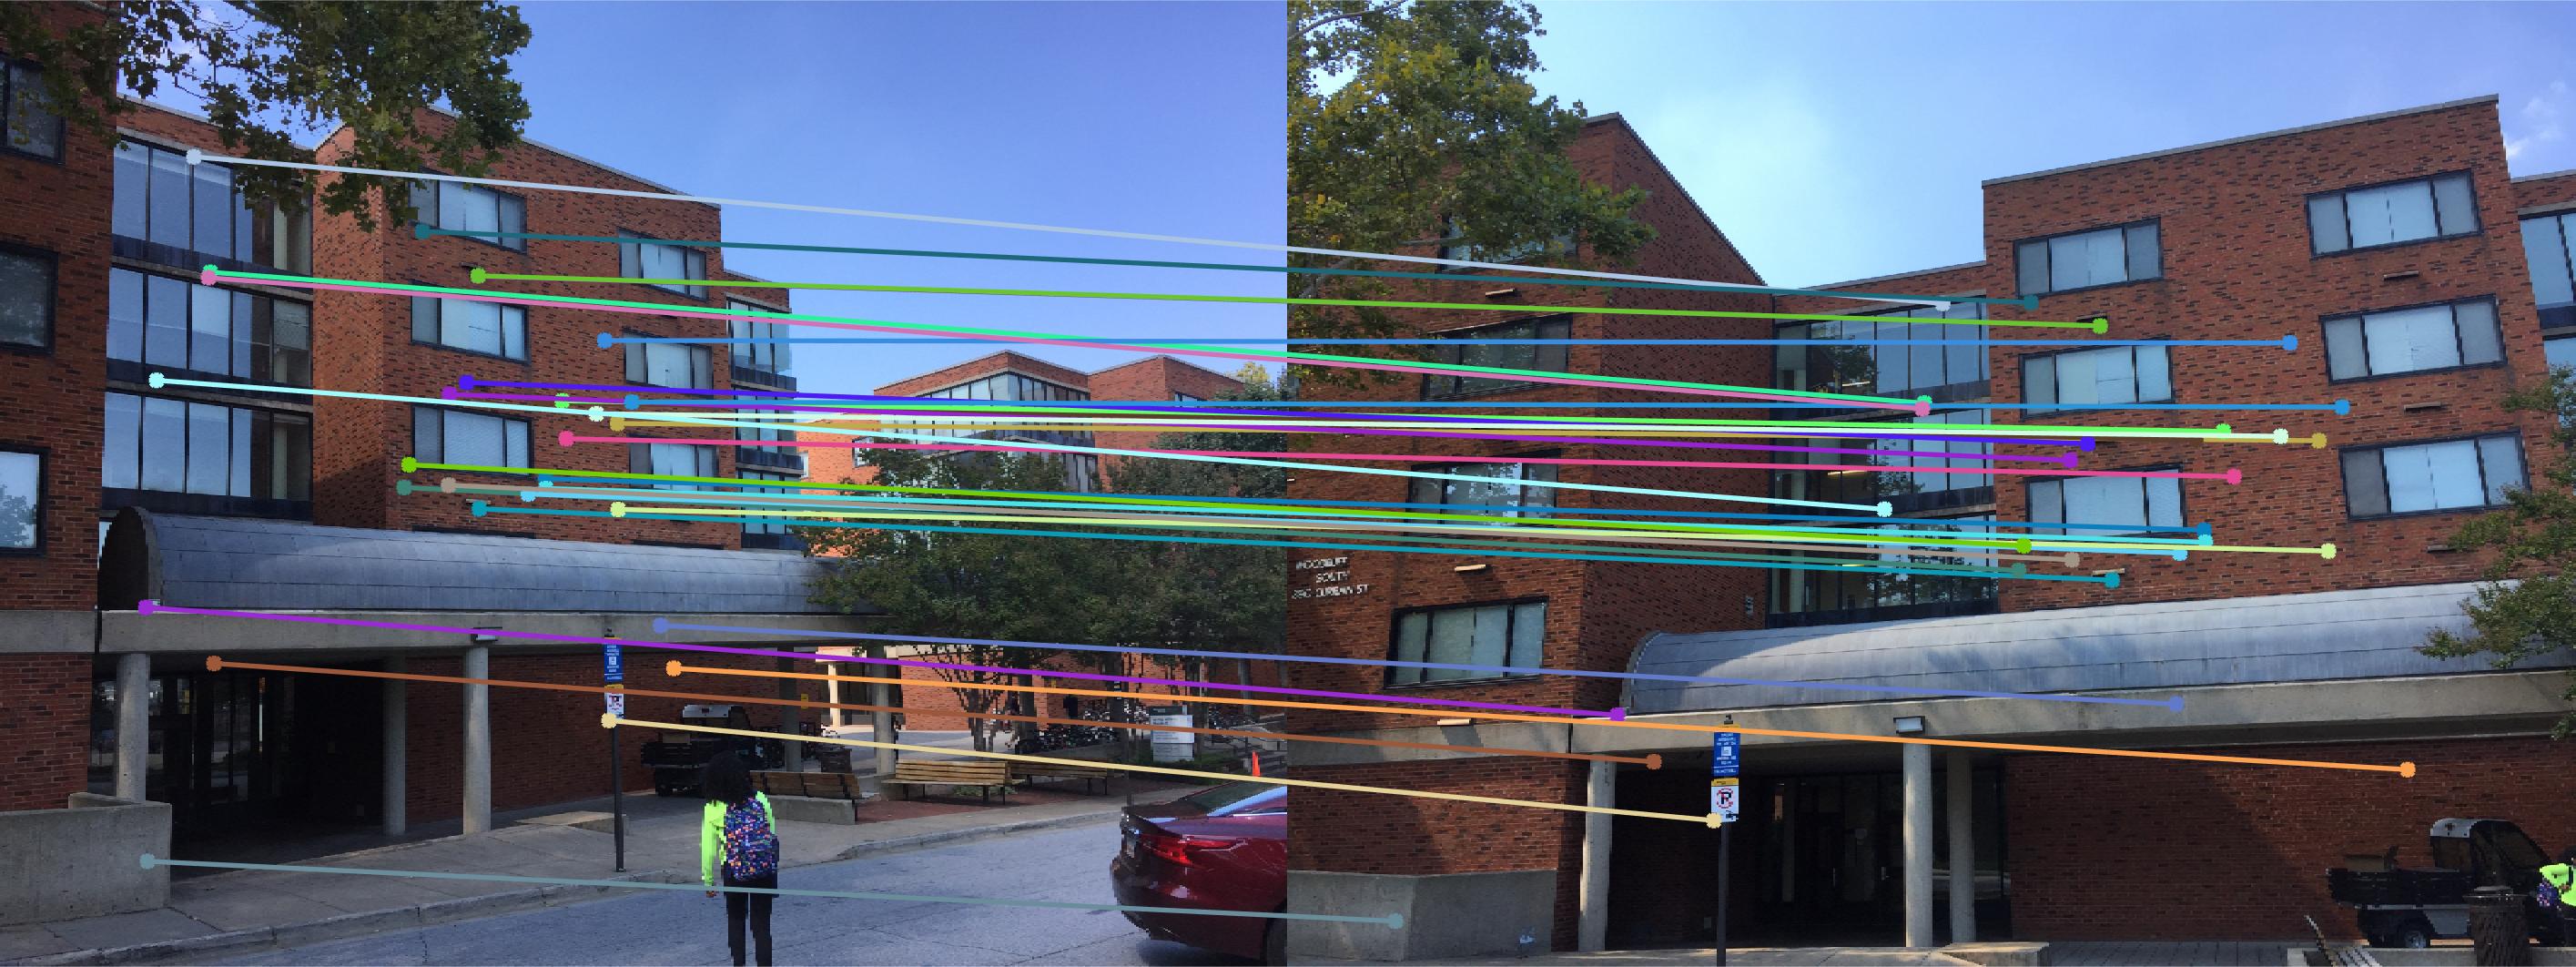
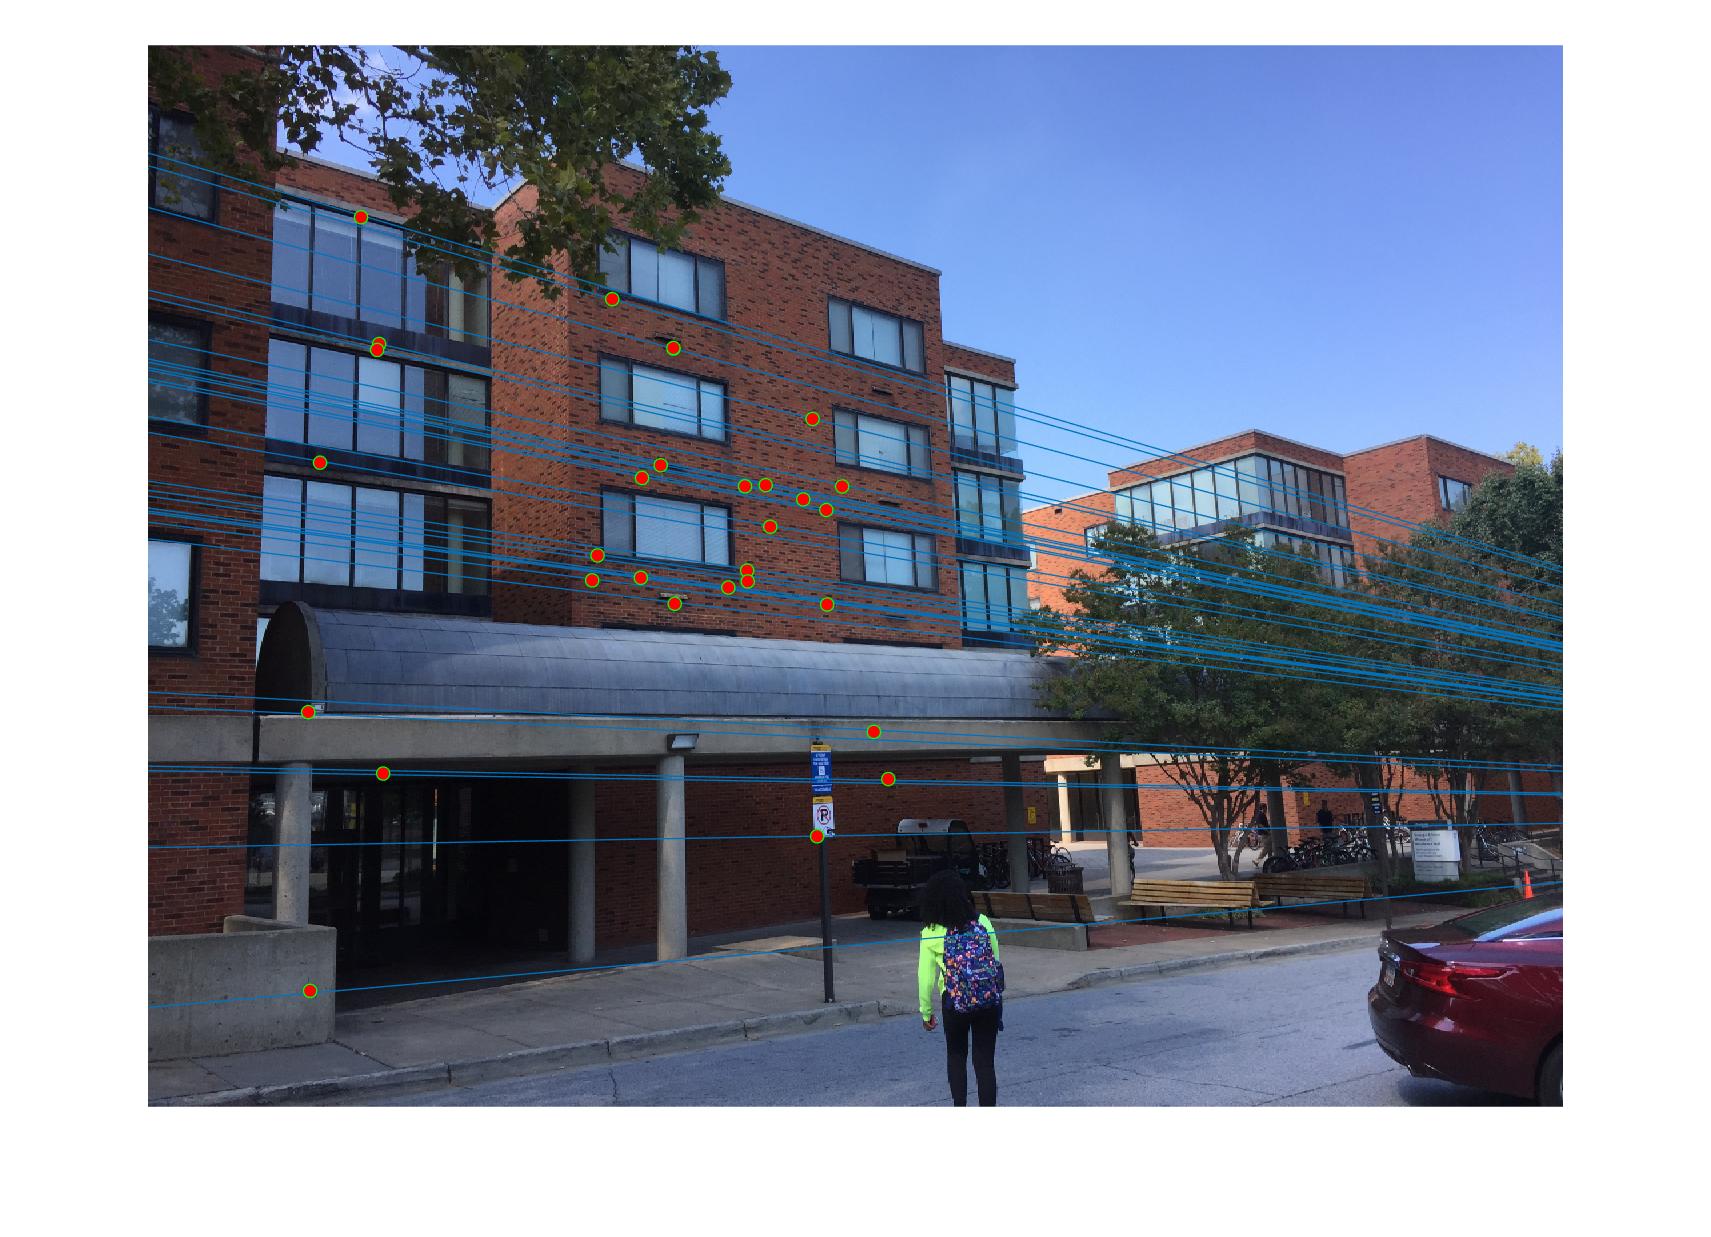
RANSAC on Woodruff Dorm
|
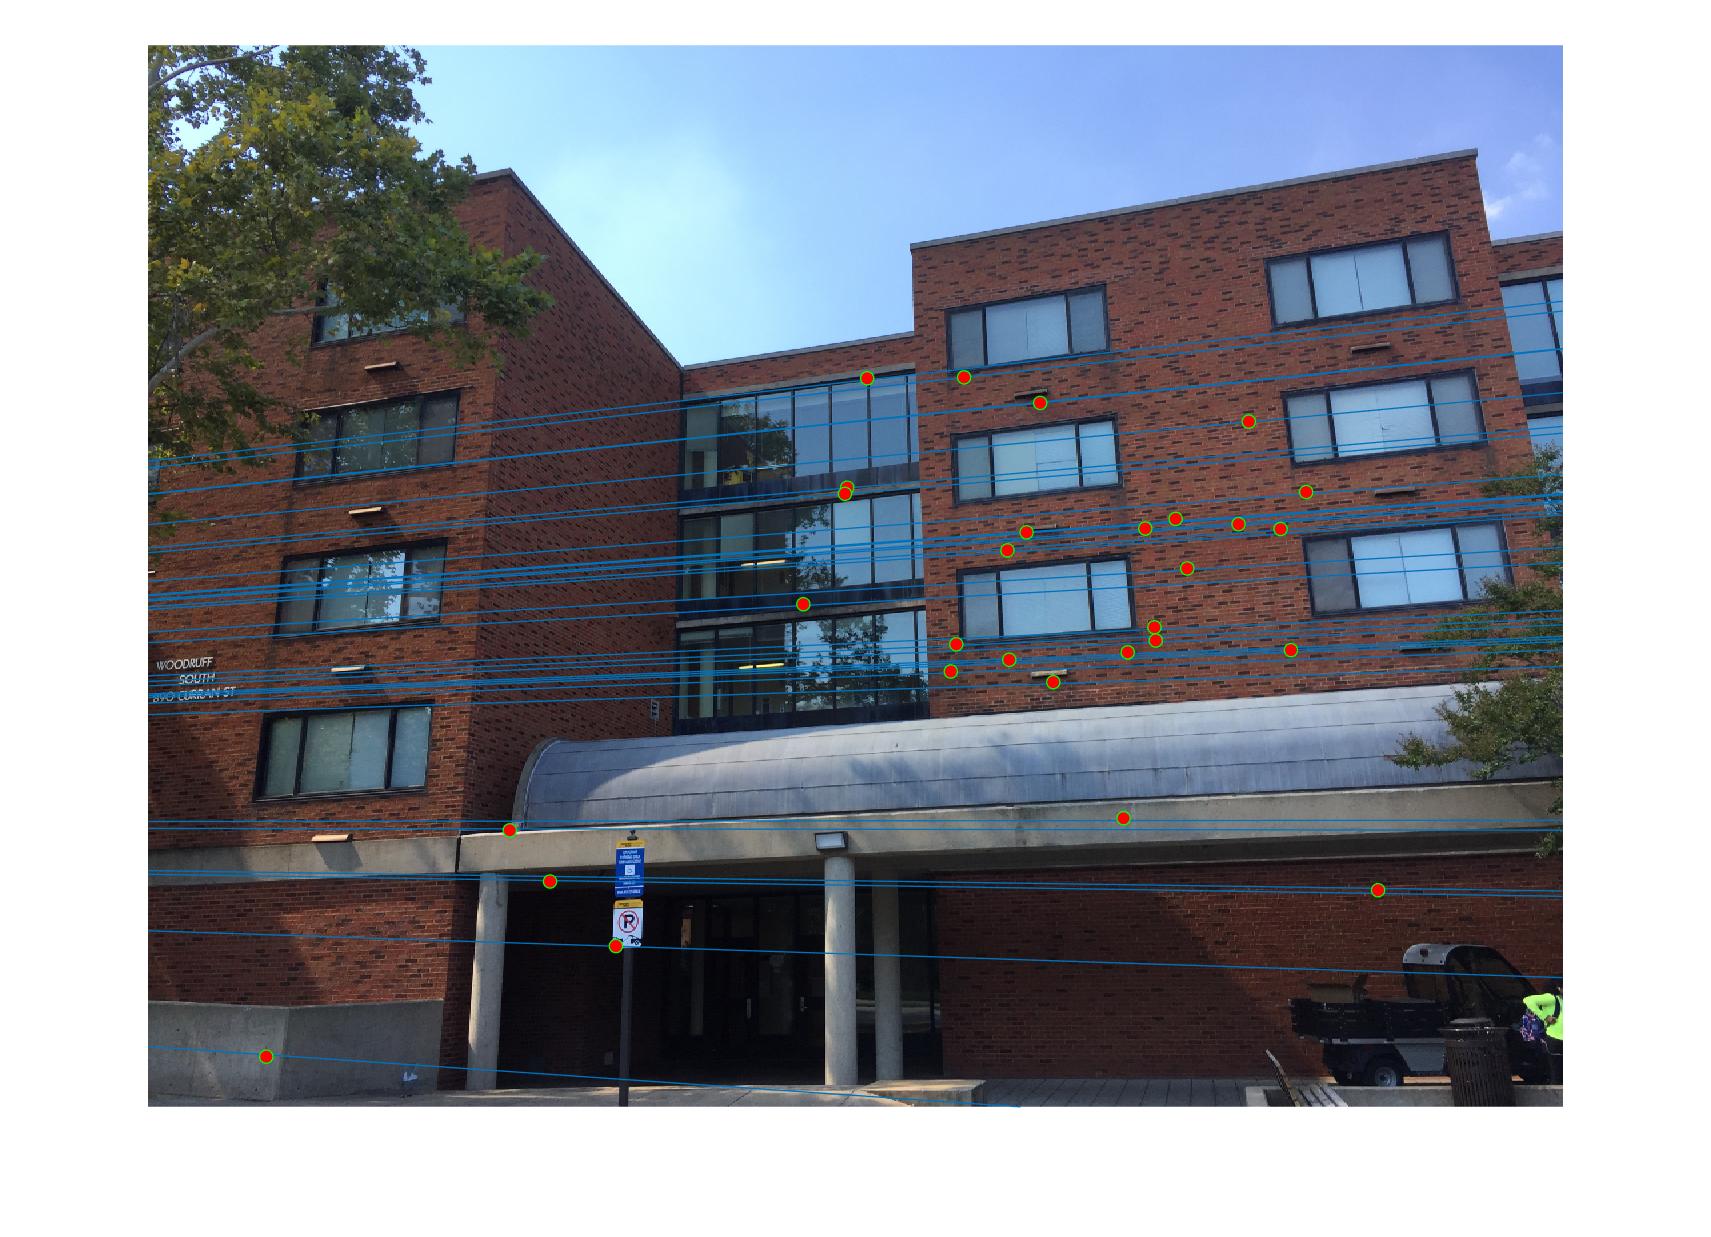
|
Overall, this image did very well as well. As noted before, there seemed to be only a angle change, which makes it very easy for RANSAC to do well.