Project 3 / Camera Calibration and Fundamental Matrix Estimation with RANSAC
The goal of this project was to implement methods of camera calibration and scene geometry to find matching points using epipolar lines. Thus, the objectives of this project could be divded into 3 categories:
- I. Determine the Camera Projection Matrix and the camera center
- II. Estimate the Fundamental Matrix using given calibration points
- III. Estimate the Fundamental Matrix from a pool of unverified matching points with RANSAC
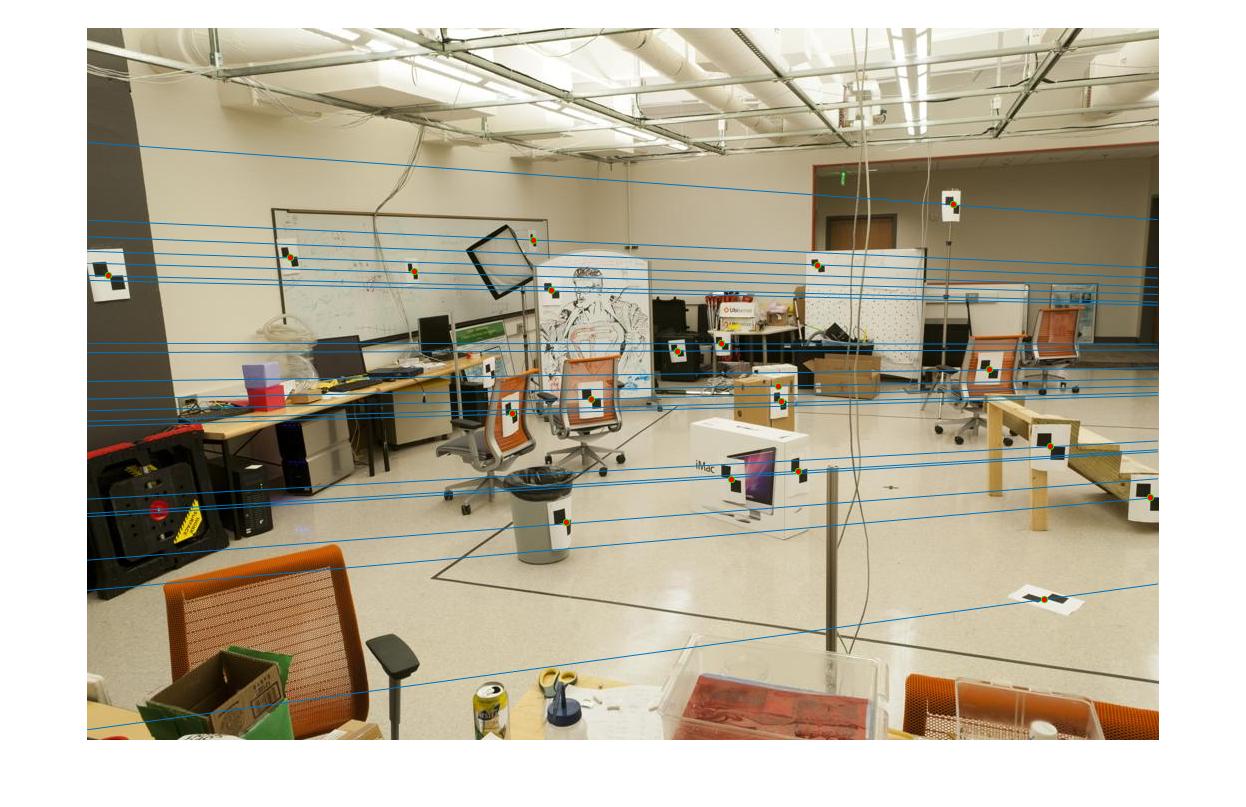
Part I
The projection matrix was found using the known 2d and 3d image coordinates given from the project file using the least squares solution (M = A\Y). The resulting projection matrix was as follows:
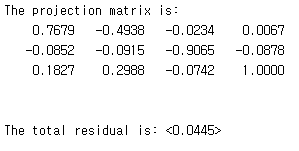
The camera center was found by using separation technique of the projection matrix into K and [R t] matrixes, which the center can be found after skipping some intermediate processes:
Q = M(:,1:3);
Center = -inv(Q)*M(:,4);
The resulting camera center was:

Part II
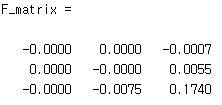
The fundamental matrix was found by using the relation:
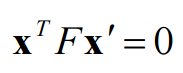
and rearranging to the system of equation Af = 0. Then, solving for f using the svd() function and reshaping the last column of the V matrix would give the fundamental matrix. The resulting fundamental matrix and the corresponding epipolar lines are shown below:
Graduate Credit
In addition to just finding the fundamental matrix, in order to improve numerical conditioning, the data was rescaled using the mean distance of points to the origin at the center and the variance. Then, the fundamental matrix was scales back to the original coordinate scale by using the same transformation. The results are shown with data from part 3.
Part III
The last assigment was to determine the epipolar geometries for a given pair of images and the SIFT tool to determine the matching pairs. The algorithm applied was:
- I. Randomly sample number of points to fit the model: in this case, the number was 8.
- II. Solve for model parameters using samples: in this case, it was the resulting distance from the XT * F * X' = 0 equation.
- III. Score the fraction of inliers within the preset threshold.
The iteration was repeated until the iteration count reached 5000. The threshold used was 0.01. The sampson distance was used to evaluate the inlier/outlier division. The results are shown in the table below. For reference, the normalized fundamental matrices were used for all except for the last pair in the graduate credit section.
Results in a table
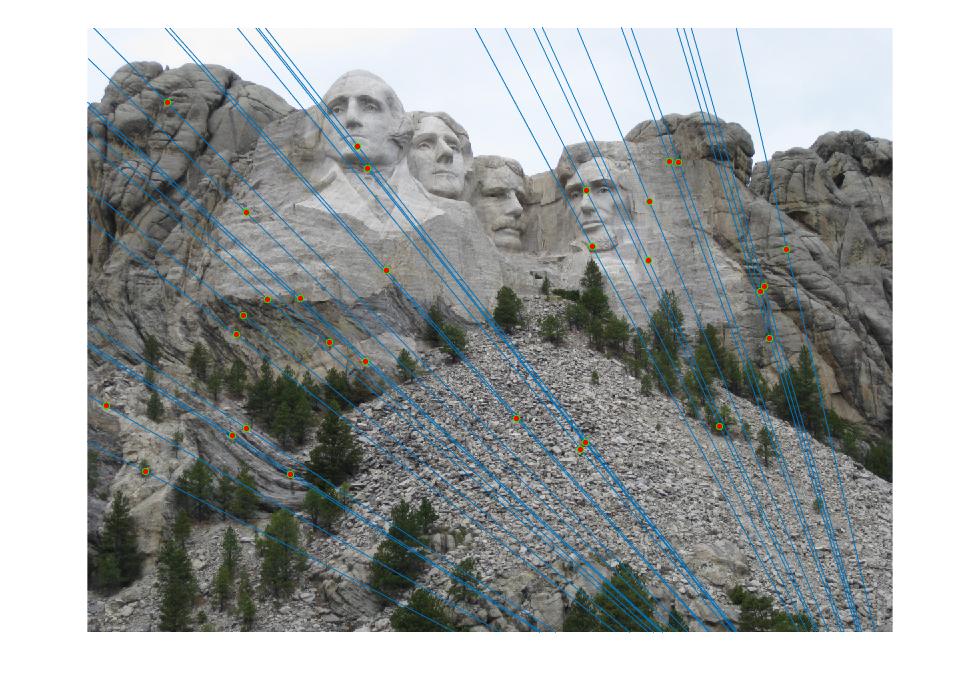
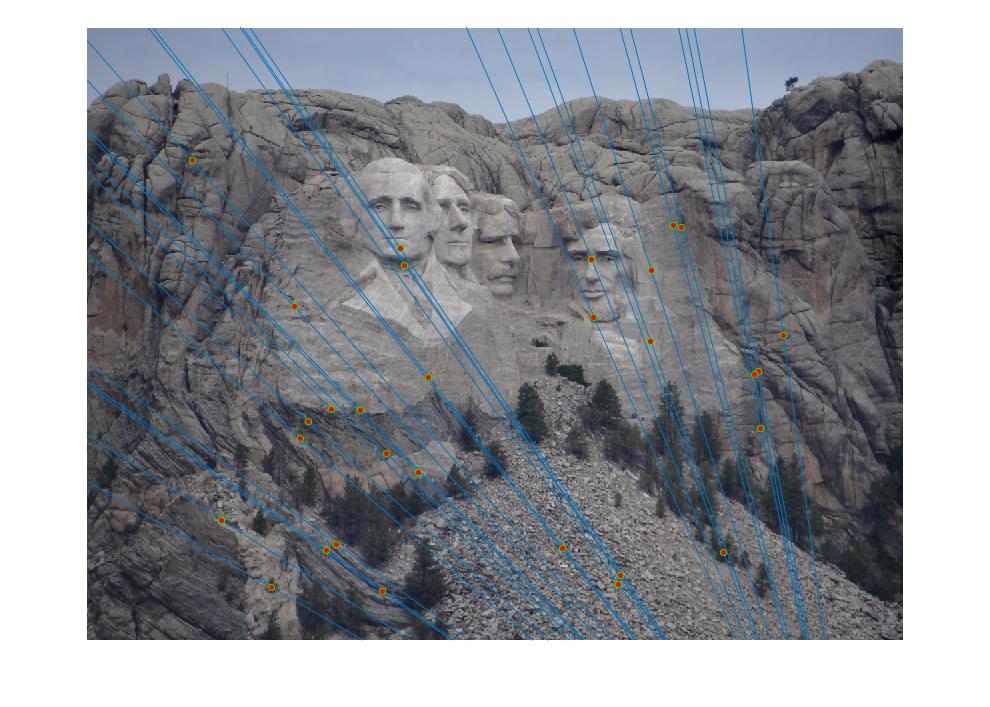
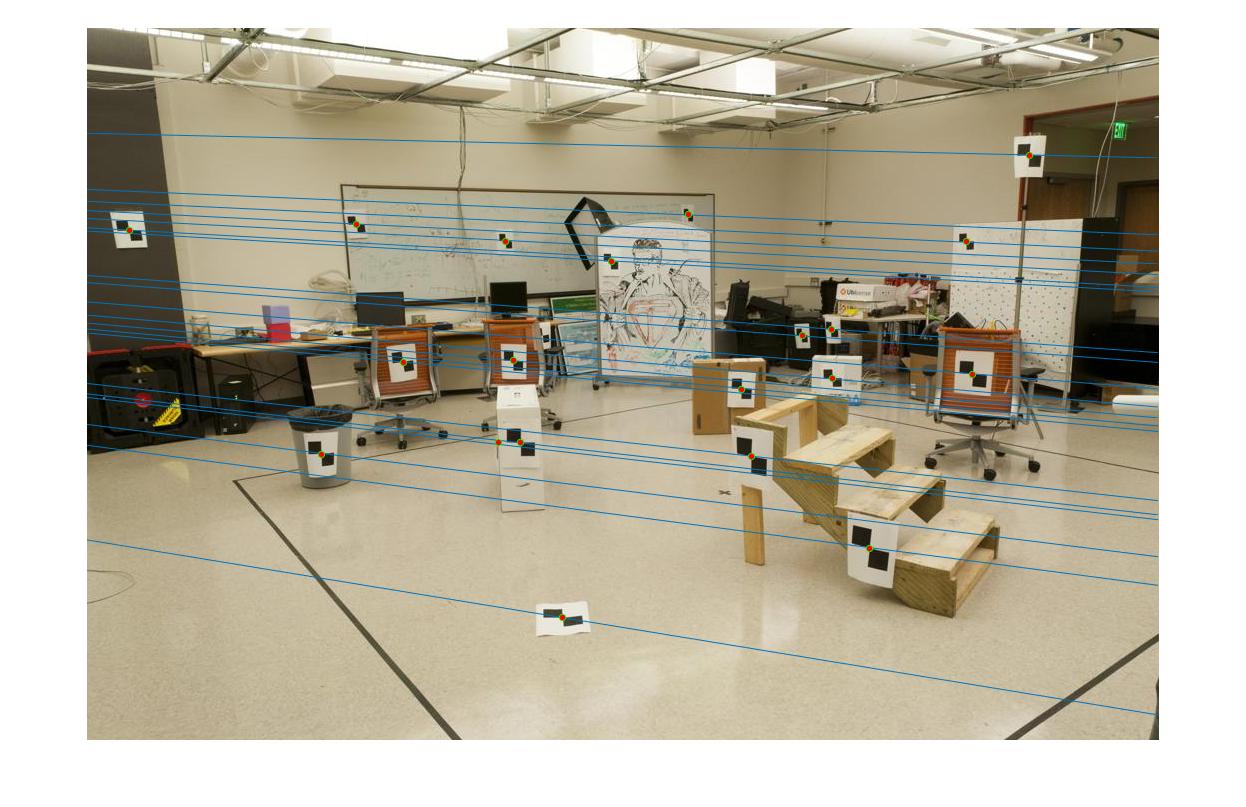
Mount Rushmore pair. The epipolar lines and matching points correspond very well. 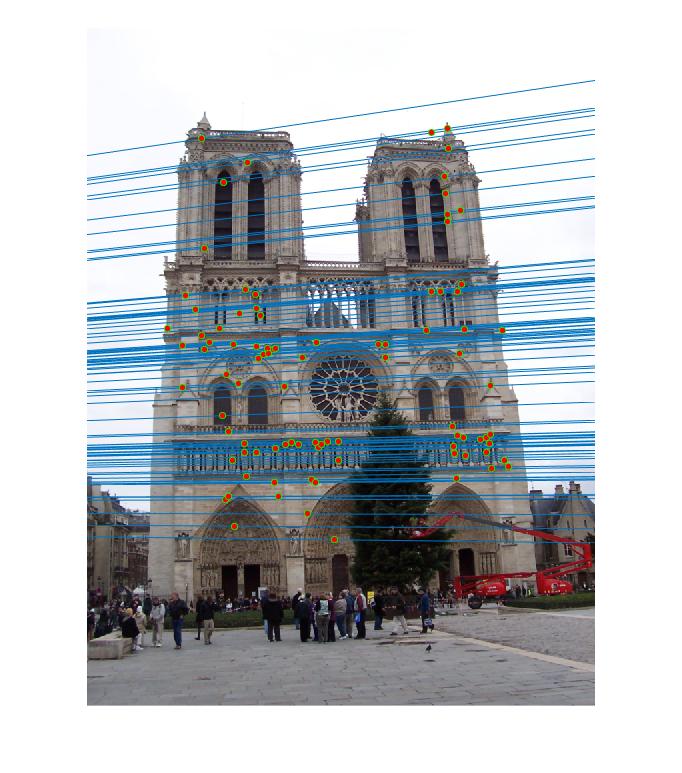
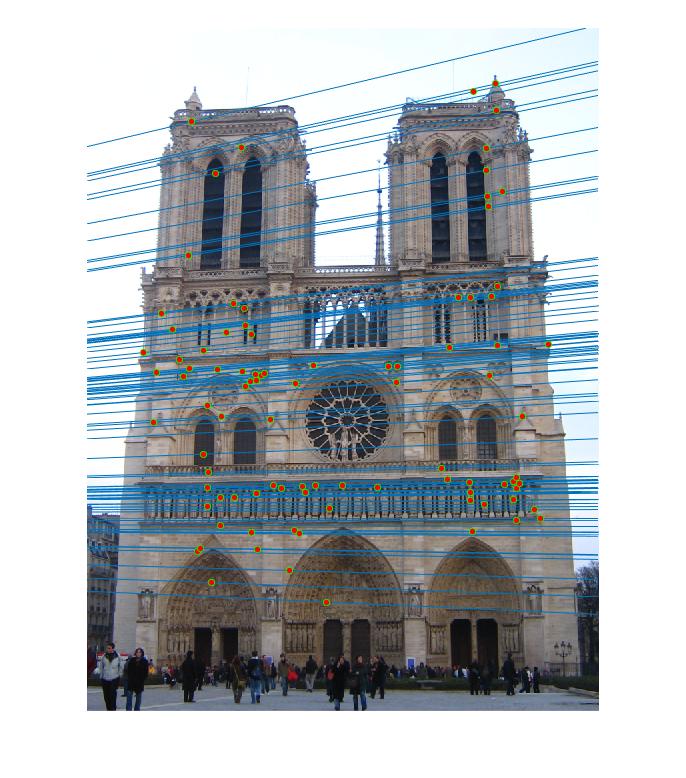
Notre Dame pair. The epipolar lines and matching points correspond very well in this pair too. 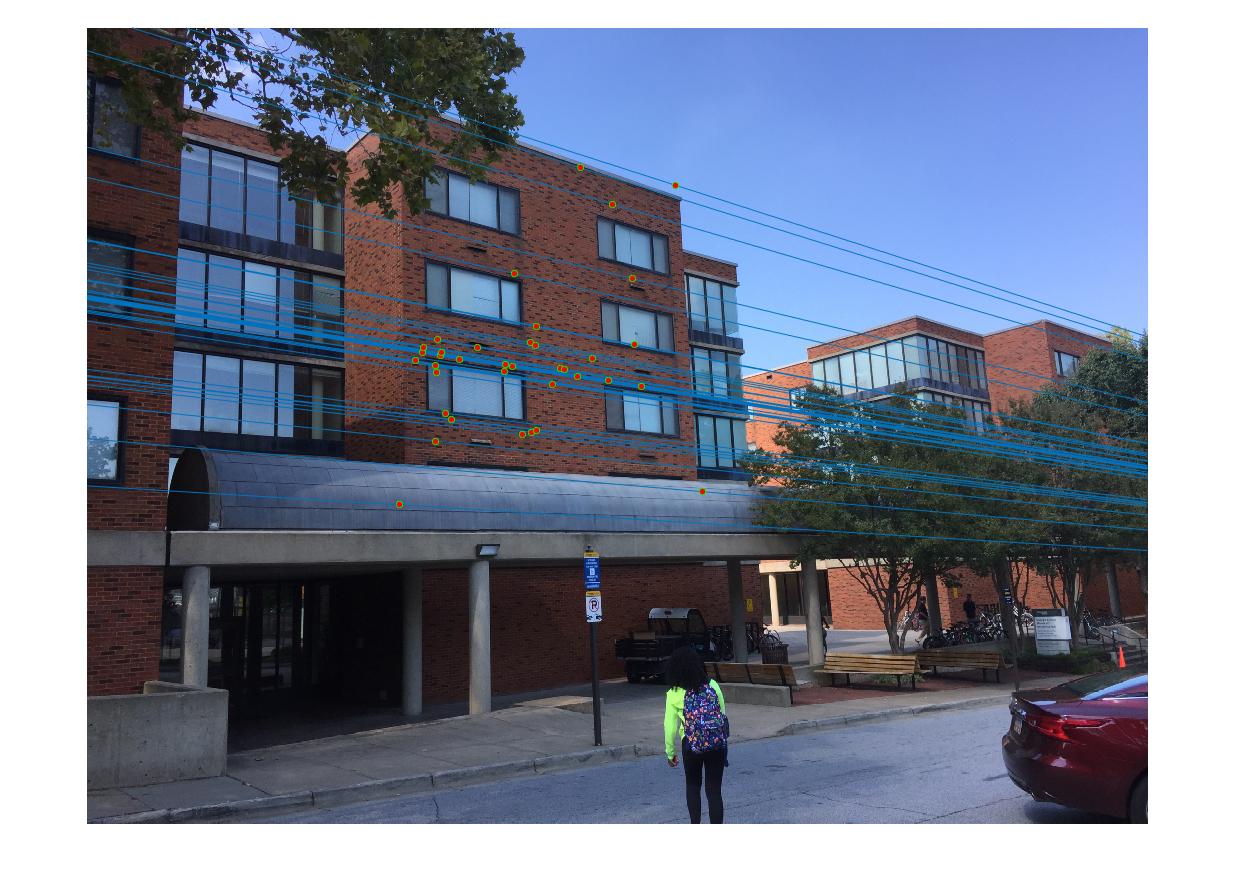
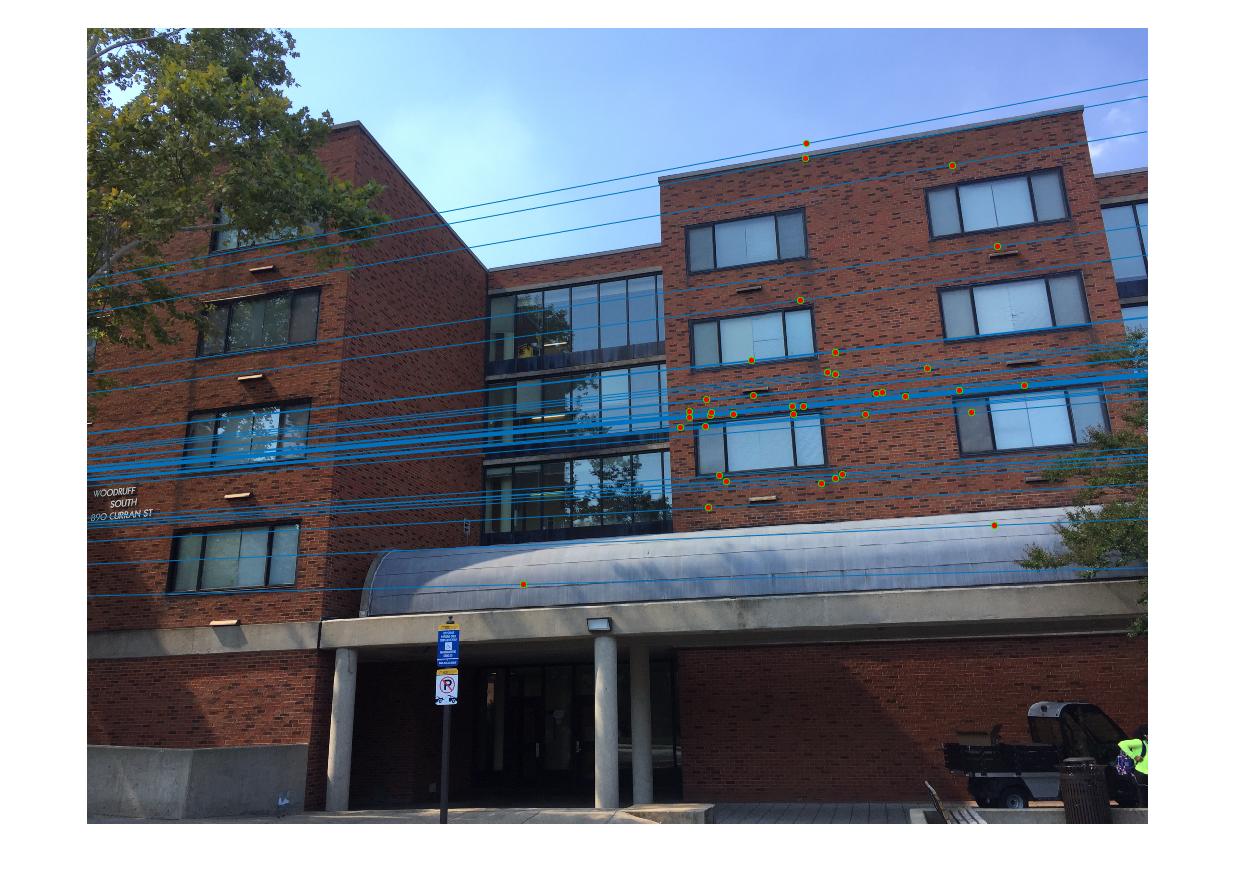
Pair of photos taken at Woodruff. The epipolar lines and matching points correspond very well in this pair too. |
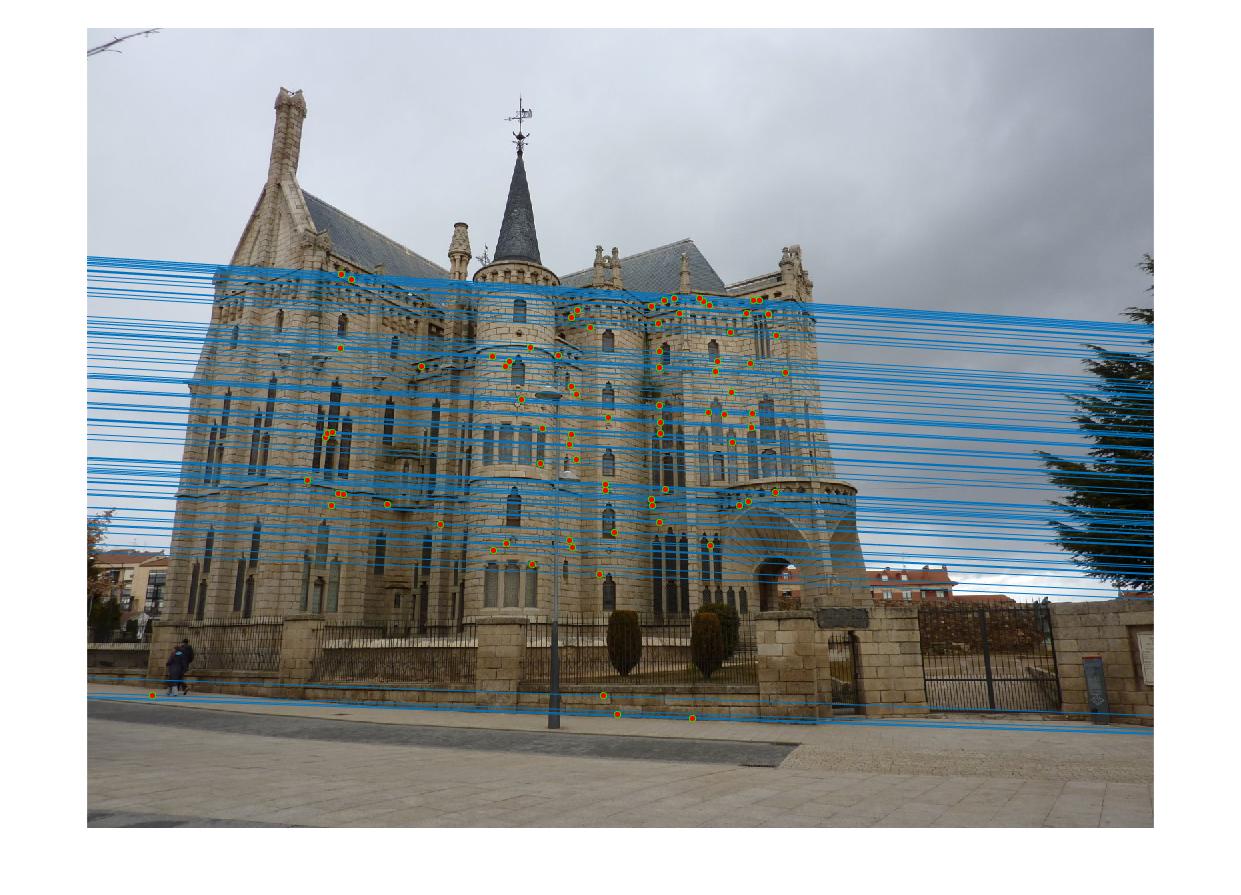
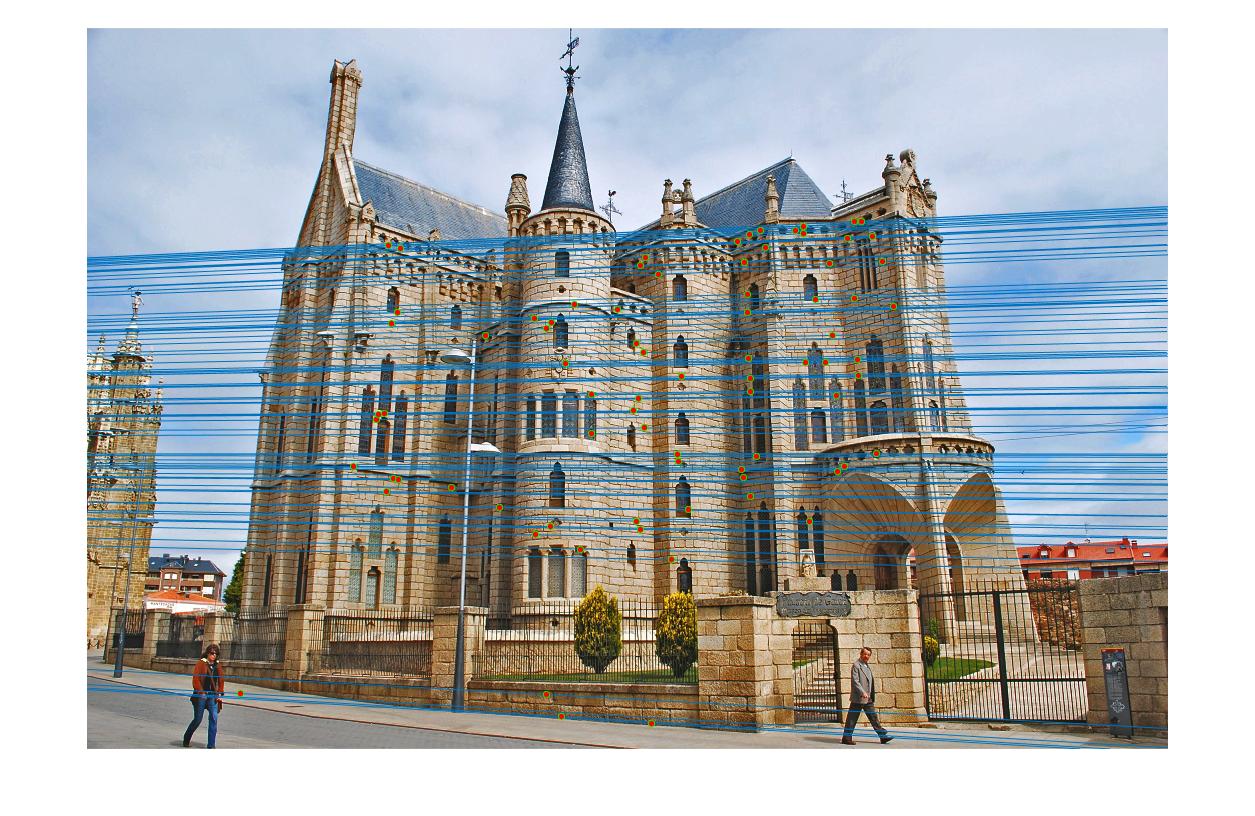
Gaudi pair with normalized fundamental matrix. The epipolar geometries show great correspondance, and the epipolar lines are distinct. 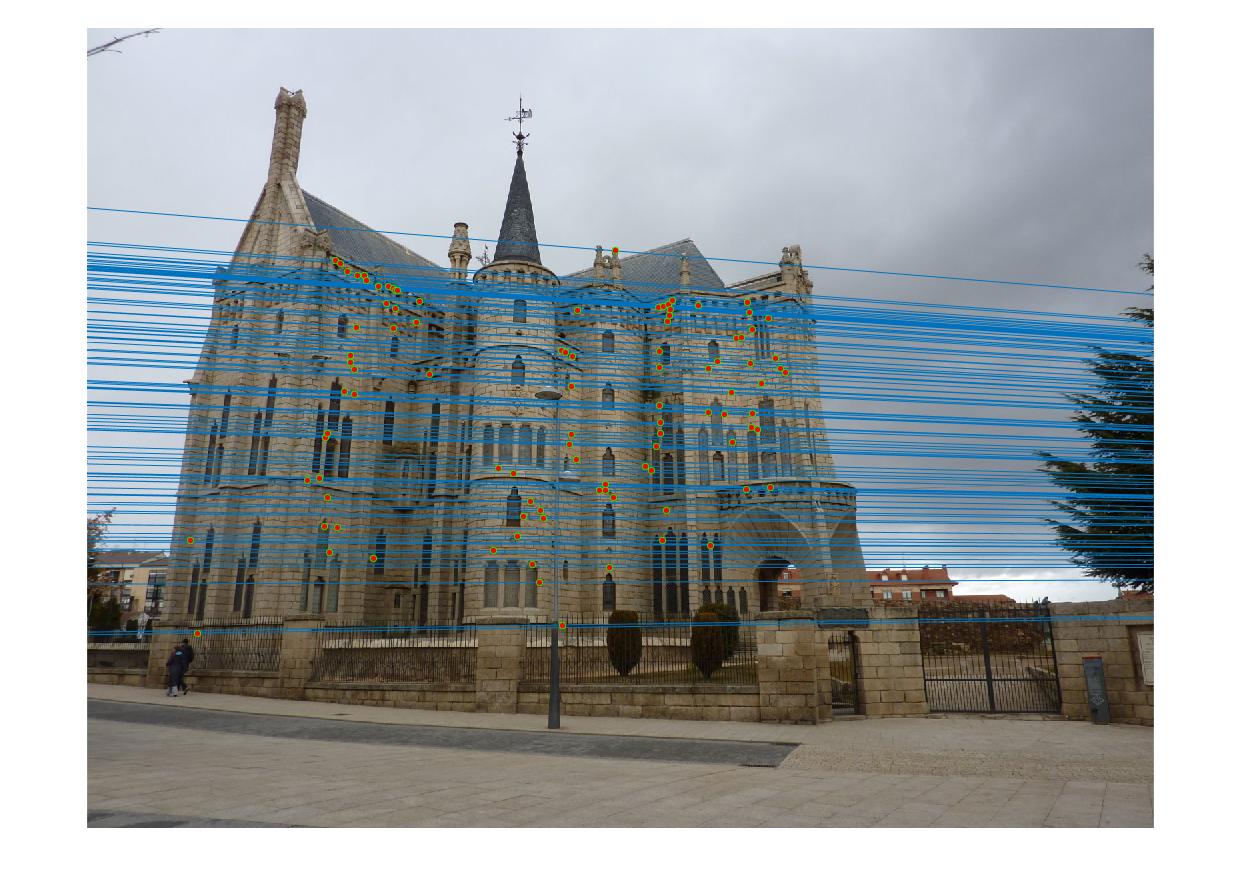
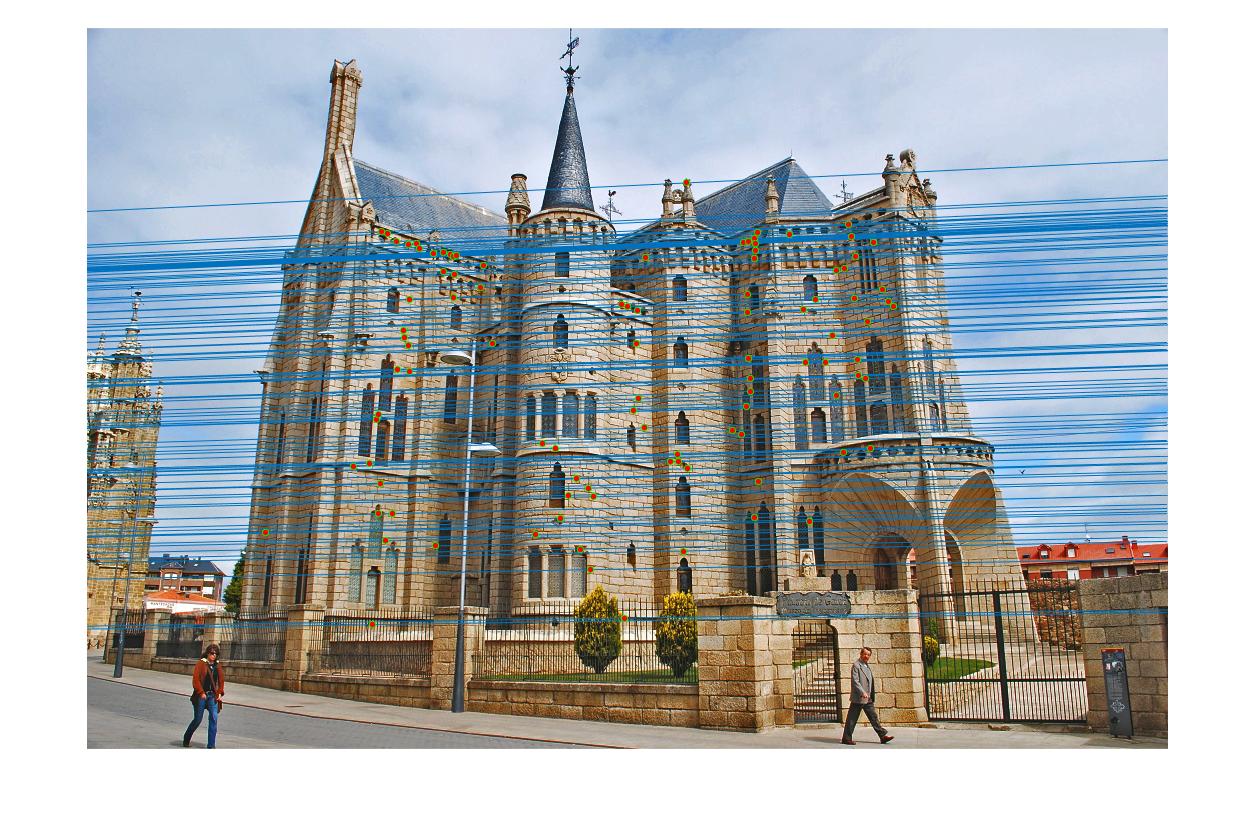
Gaudi pair without normalization. The epipolar geometries show good correspondance, but some lines are not as accurate as the previous pair, shows some mismatched pairs, and some of the epipolar lines are inseparable. |