Project 3: Camera Calibration and Fundamental Matrix Estimation with RANSAC
For this project, I implemented the following:
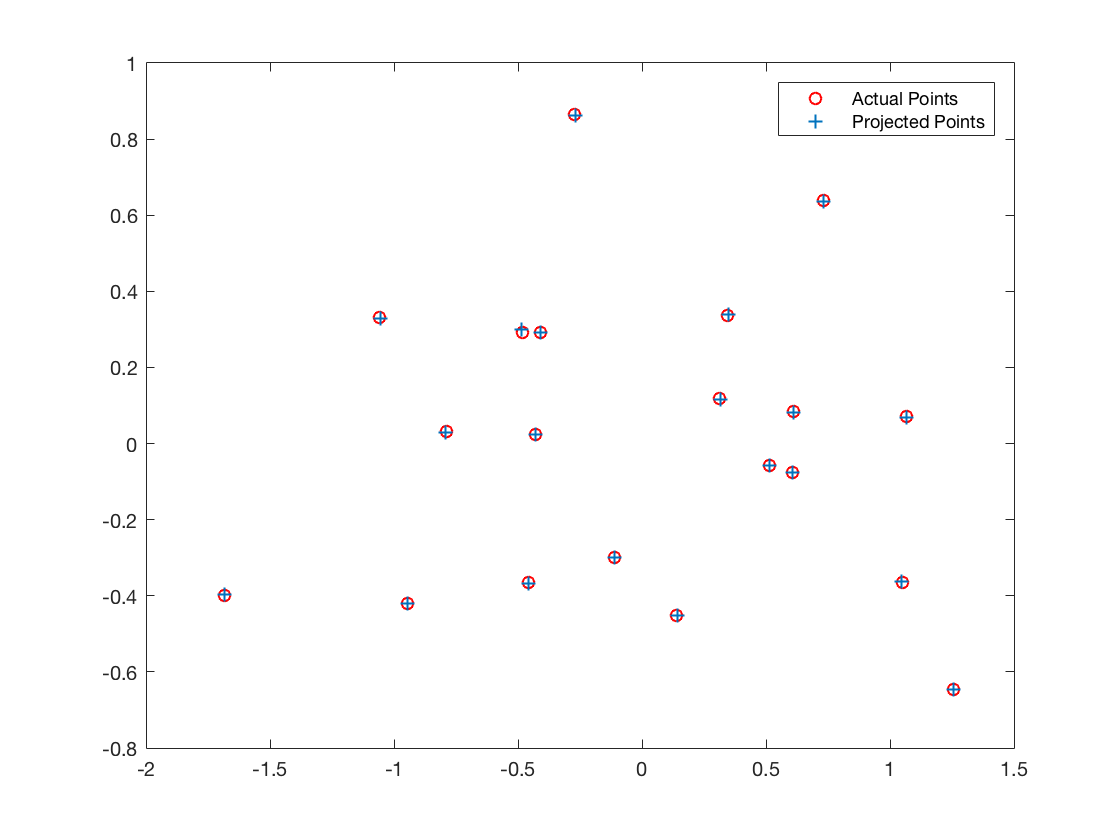
Part 1: Camera Projection Matrix
My code determines the projection matrix M to map the 3D world coordinates to 2D image coordinates. I used simple linear regression and then fixed the scale by setting the last element of the matrix to 0. I also tried SVD but it did not provide clear benifits. To find the center of the camera C, I used the fact that M can be represented as (Q|m) where Q is a 3x3 matrix and m is the fourth column such that C = -Q^(-1)*m For testing it, I used the provided set of normalized points. For the test set, I got the following results:The projection matrix is: 0.7679 -0.4938 -0.0234 0.0067 -0.0852 -0.0915 -0.9065 -0.0878 0.1827 0.2988 -0.0742 1.0000 The total residual is: 0.0445 The estimated location of camera is: -1.5126, -2.3517, 0.2827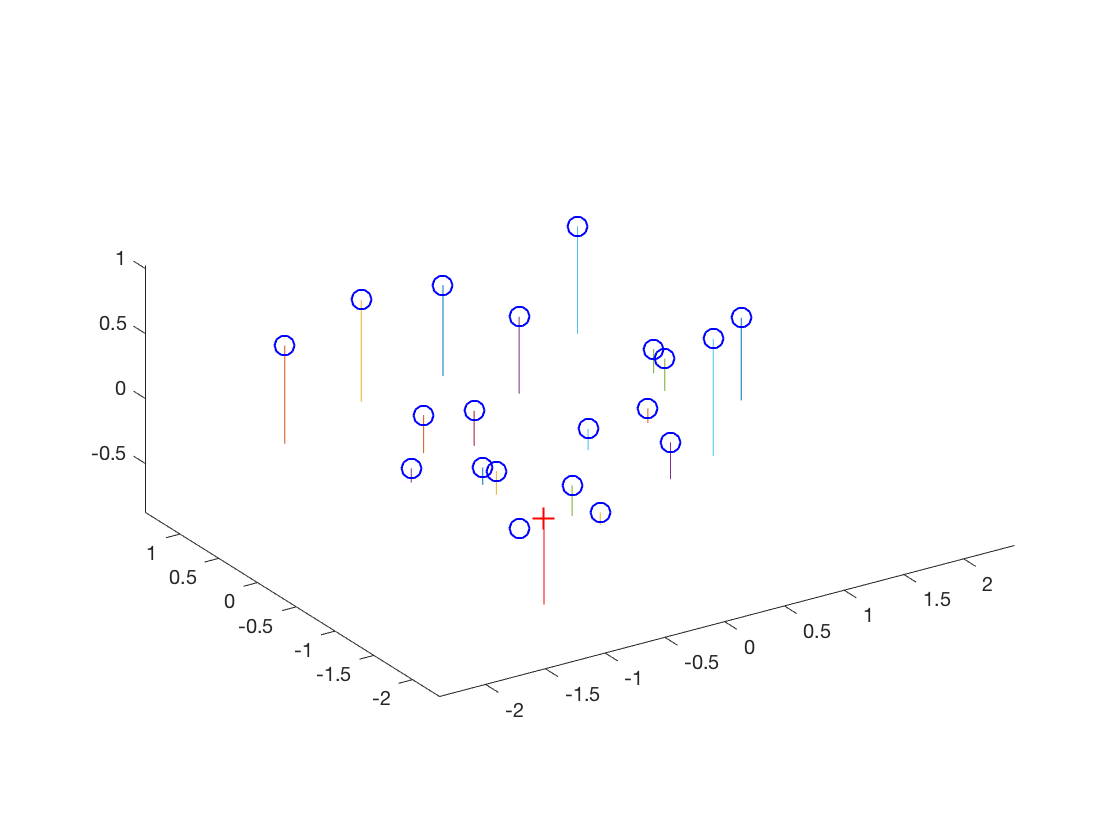
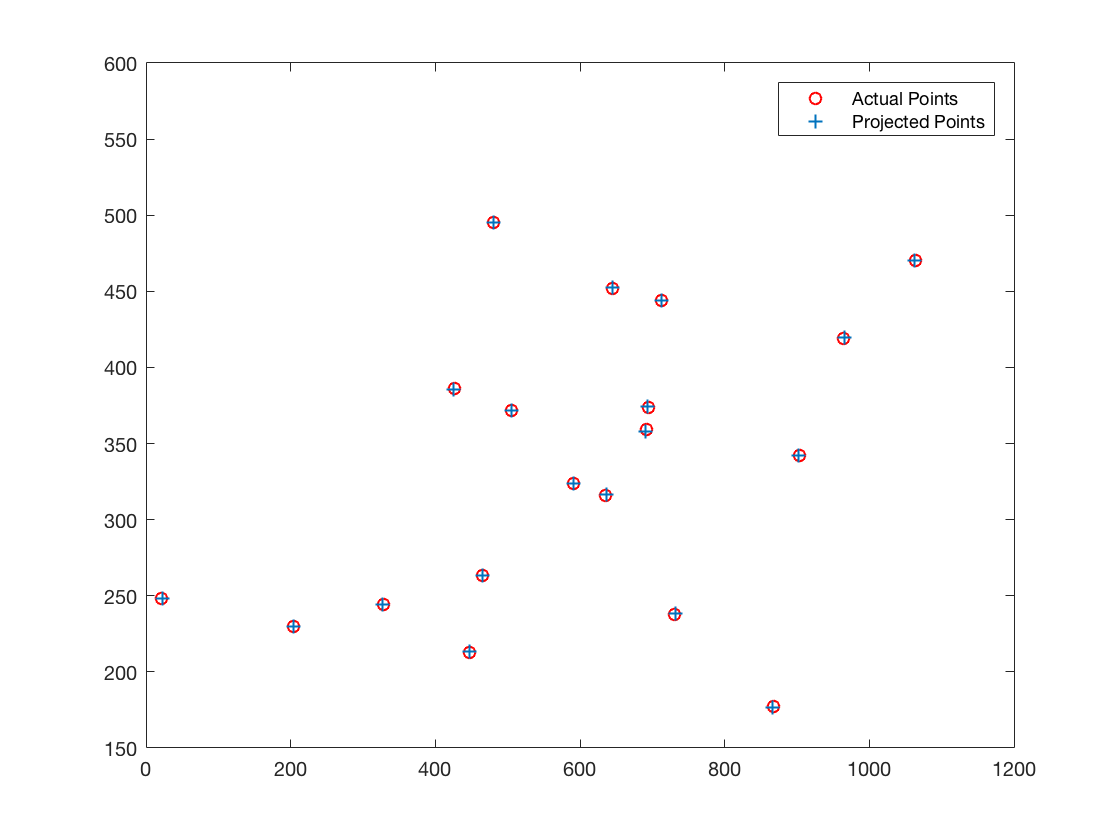
I got a much higher residual. However, the points projected points align very well with the real points as you can see in the plots below.The projection matrix is: -2.0466 1.1874 0.3889 243.7330 -0.4569 -0.3020 2.1472 165.9325 -0.0022 -0.0011 0.0006 1.0000 The total residual is: 15.6217 The estimated location of camera is: 303.0967, 307.1842, 30.4223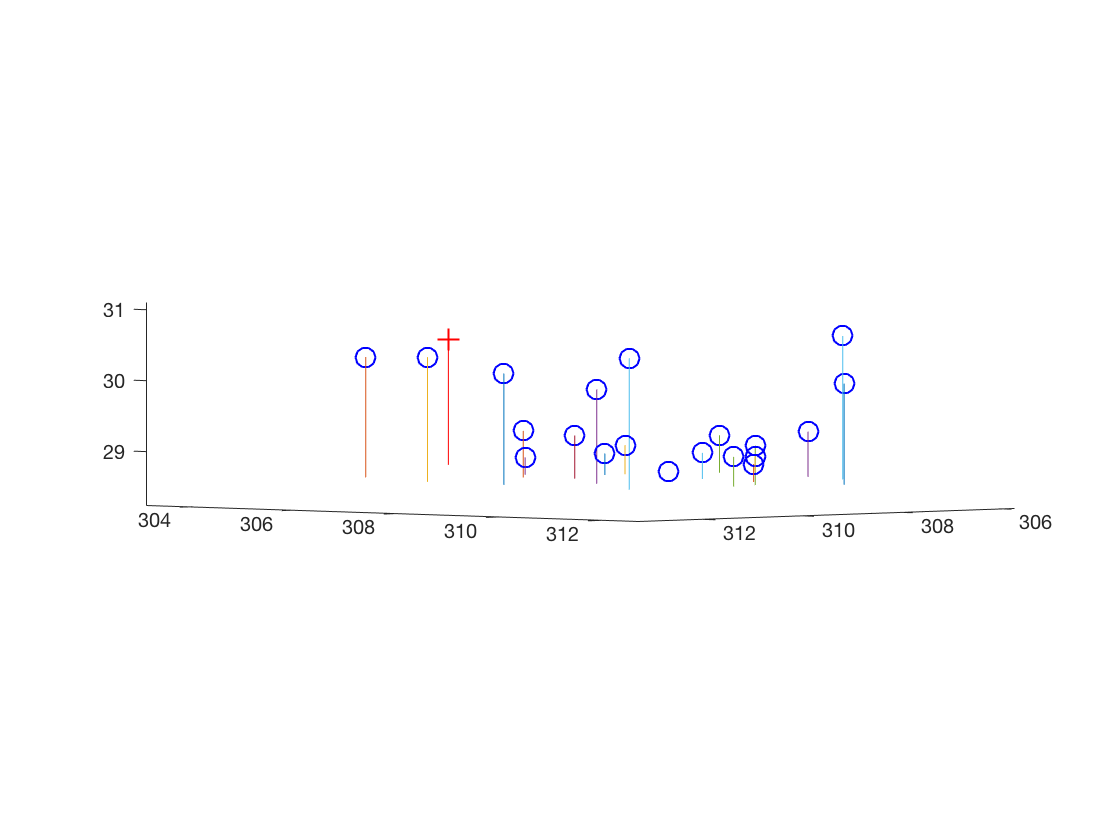
Part 2: Fundamental Matrix Estimation
For this part, I used similar techniques as in part 1 to estimate the fundamental matrix. A fundamental matrix maps points in one image to lines in another. I used SVD (such that F = U S V') and set the smallest singular value in S to 0 to form a rank 2 matrix. Here are the results from the test images: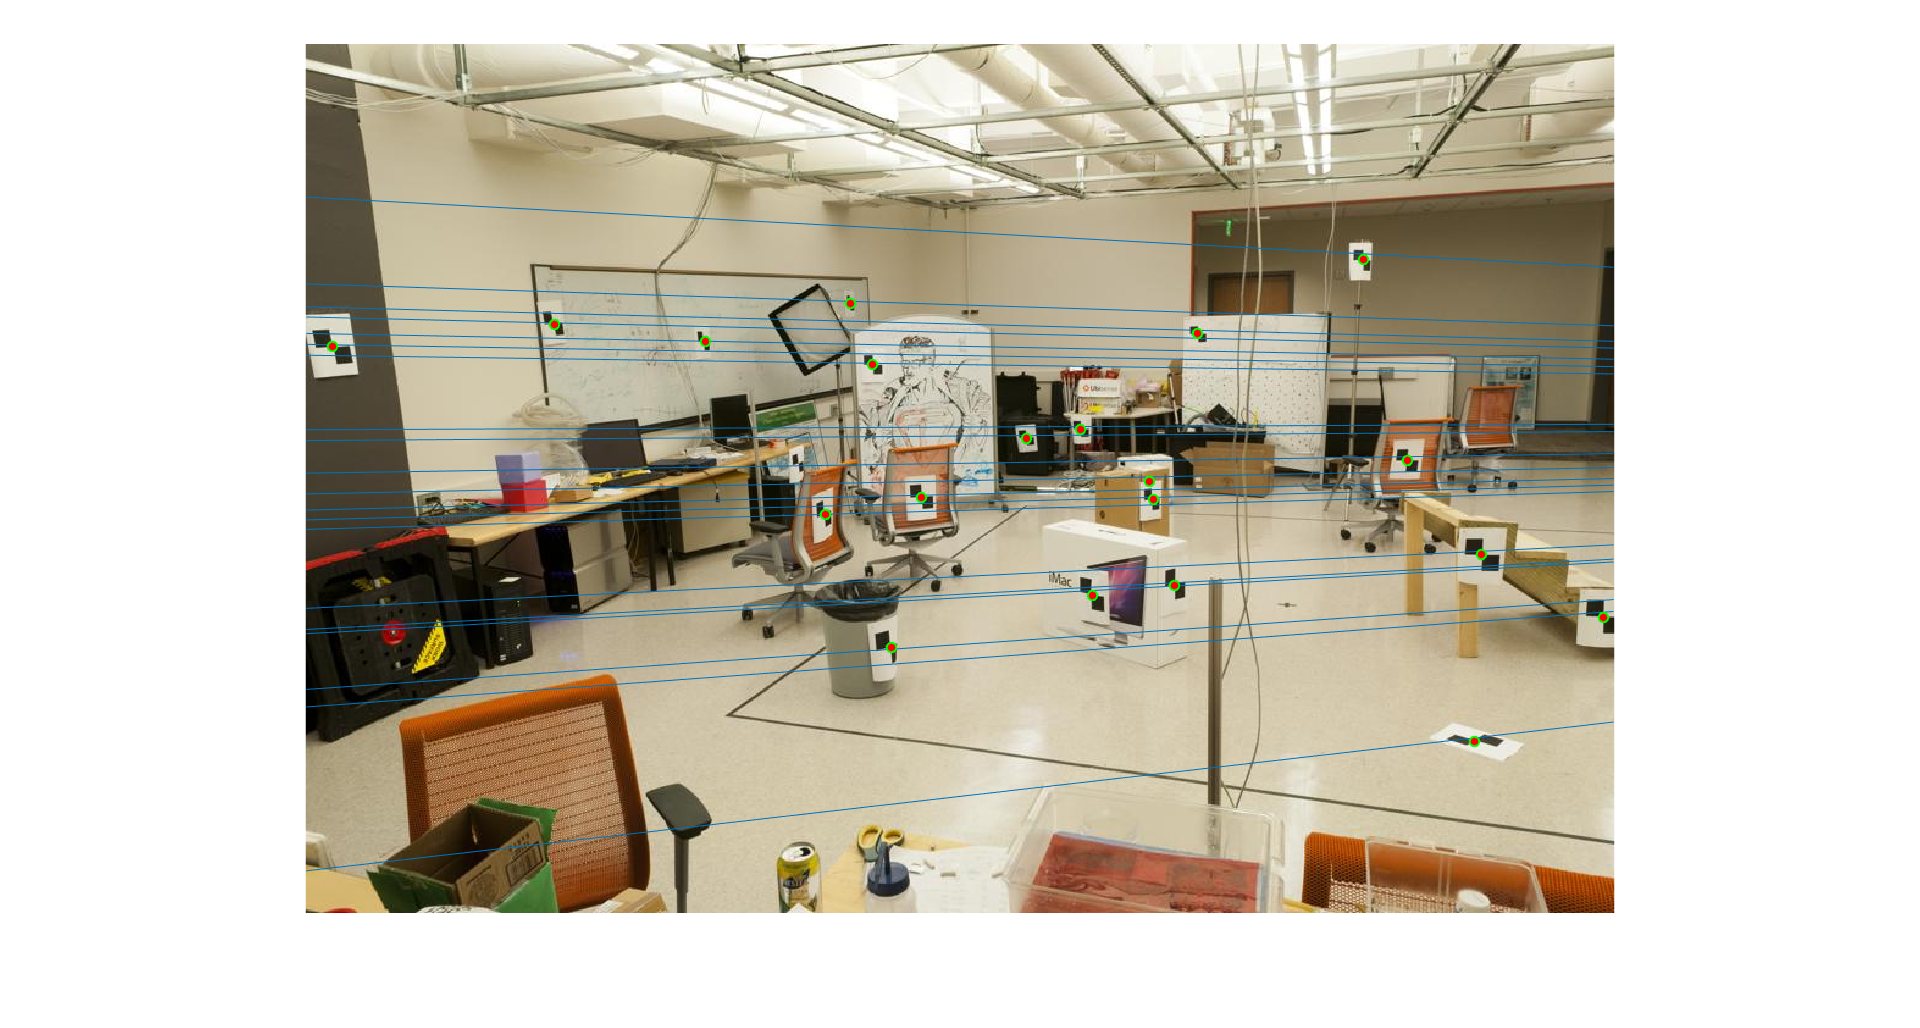
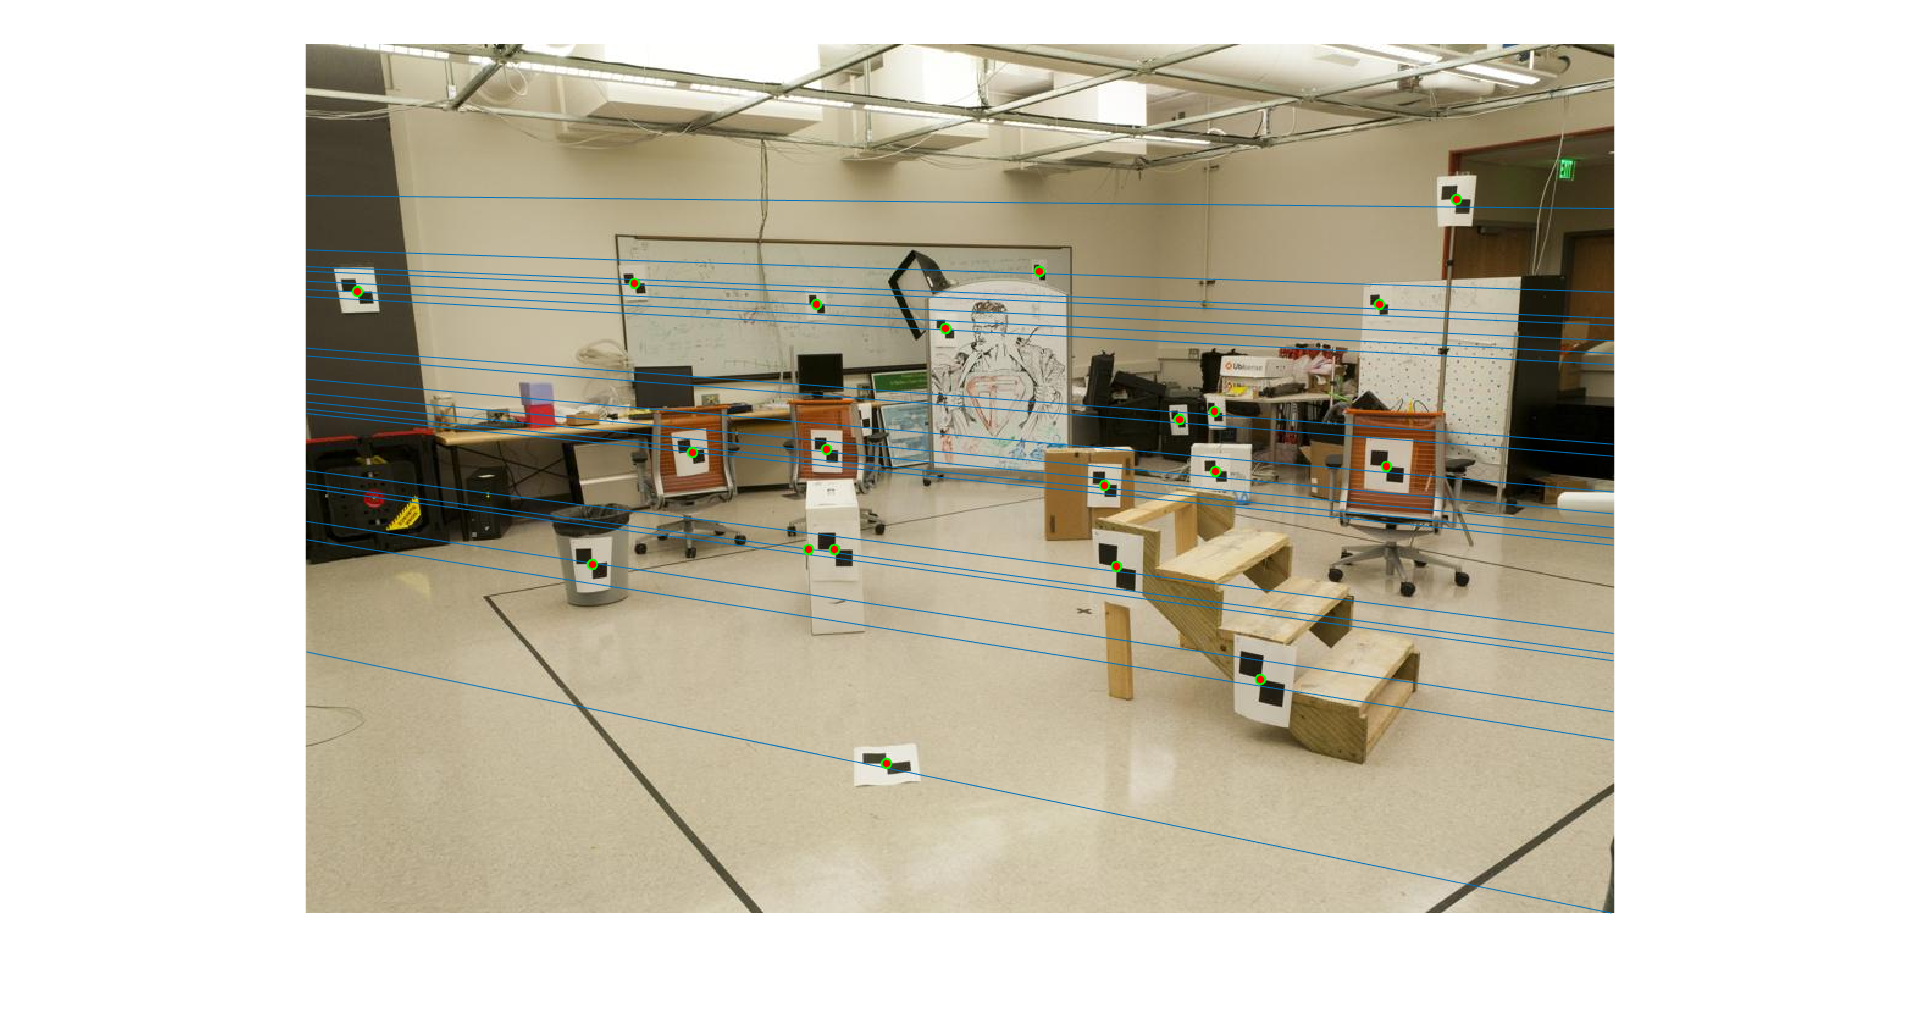

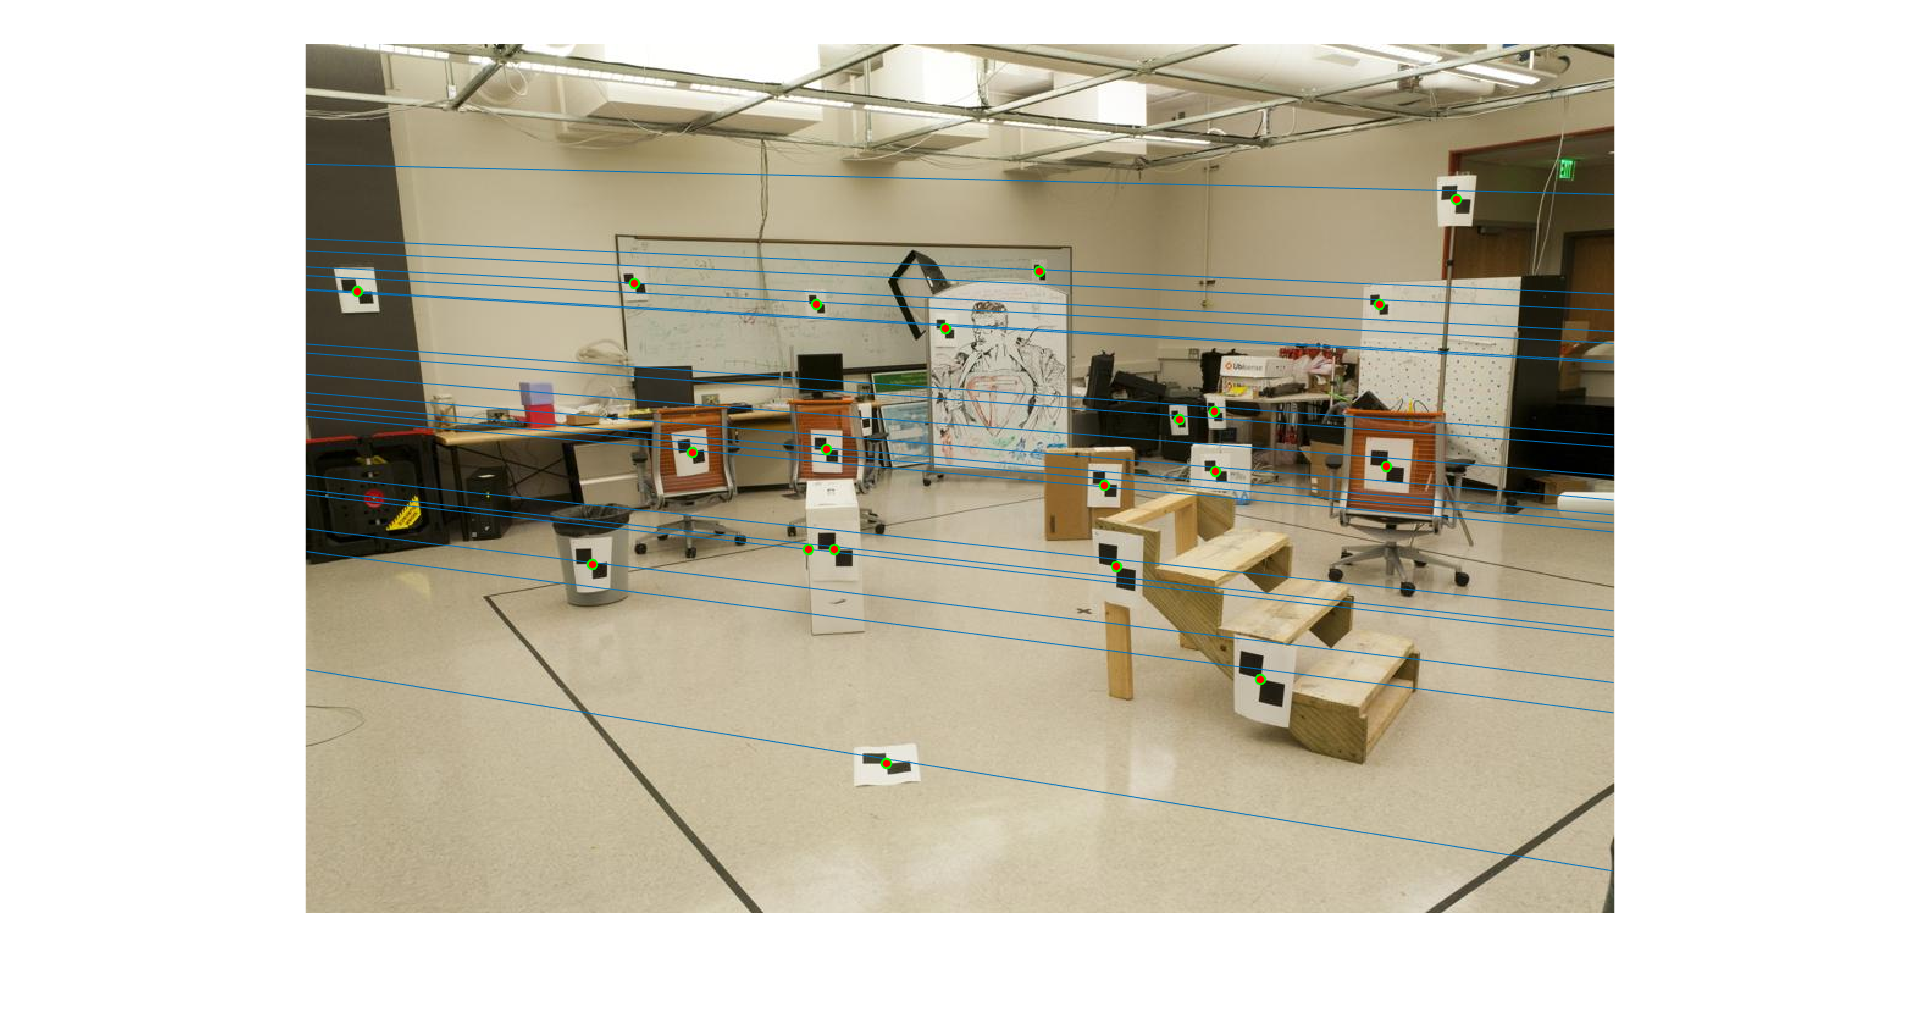
Part 3: RANSAC:
Finally, I implemented a rather simple version of the RANSAC algorithm. The basic algorithm is summarized here: Overview of the RANSAC Algorithm by Konstantinos G. Derpanis. My RANSAC algorithm has 3 parameters that can be specified by the user. They are:- Threshold: The threshold of error to decide whether a point is an inlier or outlier.
- Ratio of inliers: The min ratio required between the number of inliers and the total number of points.
- Maximum iterations: The max iterations RANSAC will run for if it does not find a set of points with the required ratio.
Results
Go to this result page to view the the result of the above program on different sets of images.
Go to this Directory to view all the images organized into folders by name.
Plots
You can check some of the plots I created by varying the threshold and proportion while running RANSAC on the Rushmore set here. I could not finish analysing them on time. You can create your own plots using the exec.m script. I will look into them in the future.