Project 3: Camera Calibration and Fundamental Matrix Estimation with RANSAC
RANSAC refers to Random Sample Consensus. It is an an iterative method to estimate parameters of a mathematical model from a set of observed data that contains outliers, when outliers are to be accorded no influence on the values of the estimates. Therefore, it also can be interpreted as an outlier detection method. It is a non-deterministic algorithm in the sense that it produces a reasonable result only with a certain probability, with this probability increasing as more iterations are allowed.2
RANSAC works in the following way. It works on a given sample of points.
- Pick a random set of points from the given sample
- Estimate parameter values from the chosen points
- Test all other points against the parameter values and determine how many of them are inliers (also called the consensus set)
- Iterate sufficiently to account for local maxima and pick the best model generated
In this project, we will find the fundamental matrix of a pair of images and use that to draw the epipolar lines on the two images. We will then try to find correspondances along the epipolar lines. We thus find local corresponding features with more accuracy than in the last project. We use VLFeat's SIFT implementation to find the local features. We will also implement normalization.
We use the RANSAC algorithm to find an approximation of the fundamental matrix. As we will see, the approximation turns out to be very good.
- In part 1, we estimate the camera projection matrix and the camera center.
- In part 2, we estimate the fundamental matrix.
- In part 3, we use RANSAC to estimate the fundamental matrix from a given set of points.
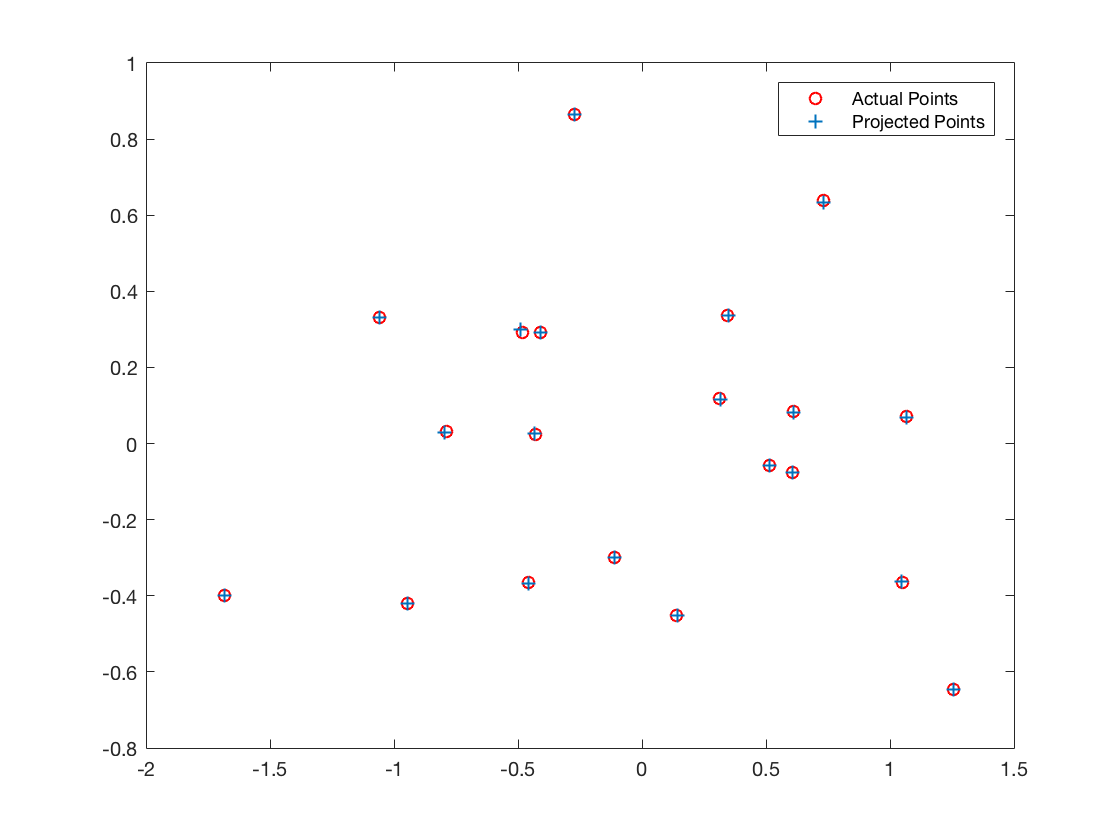
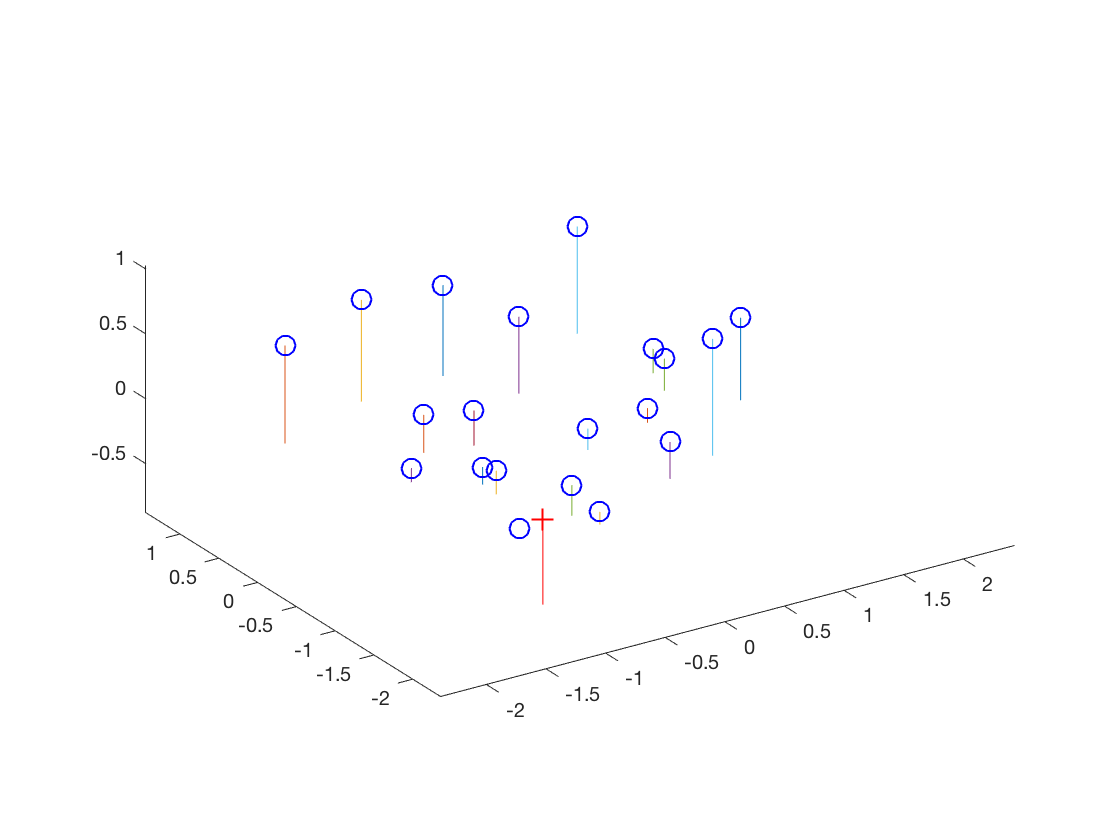
Projection Matrix and Camera Center
The projection matrix is:
-0.4583 0.2956 0.0100 -0.0043
0.0508 0.0539 0.5421 0.0525
-0.1093 -0.1773 0.0406 -0.5962
The total residual is: 0.0534
The estimated location of camera is: (-1.5246, -2.3588, 0.2808)
Fundamental Matrix
The fundamental matrix F is a 3X3 matrix which relates corresponding points in stereo images. In epipolar geometry, with homogeneous image coordinates, x and x', of corresponding points in a stereo image pair, Fx describes a line (an epipolar line) on which the corresponding point x' on the other image must lie. That means, for all pairs of corresponding points holds x'TFx = 0.
We estimate the fundamental matrix using the 8 point algorithm. We use singular value decomposition of the co-efficients of 8 example points to find the fundamental matrix. However, F is supposed to have rank=2 (even though it is 3X3). Therefore we must ensure that our fundamental matrix has a rank of 2 too. Therefore, we zero out the element at position (3,3) of the singular value matrix returned by the SVD.
Estimate for base image pair.
F_matrix =
-0.0000 0.0000 -0.0007
0.0000 -0.0000 0.0055
-0.0000 -0.0075 0.1740
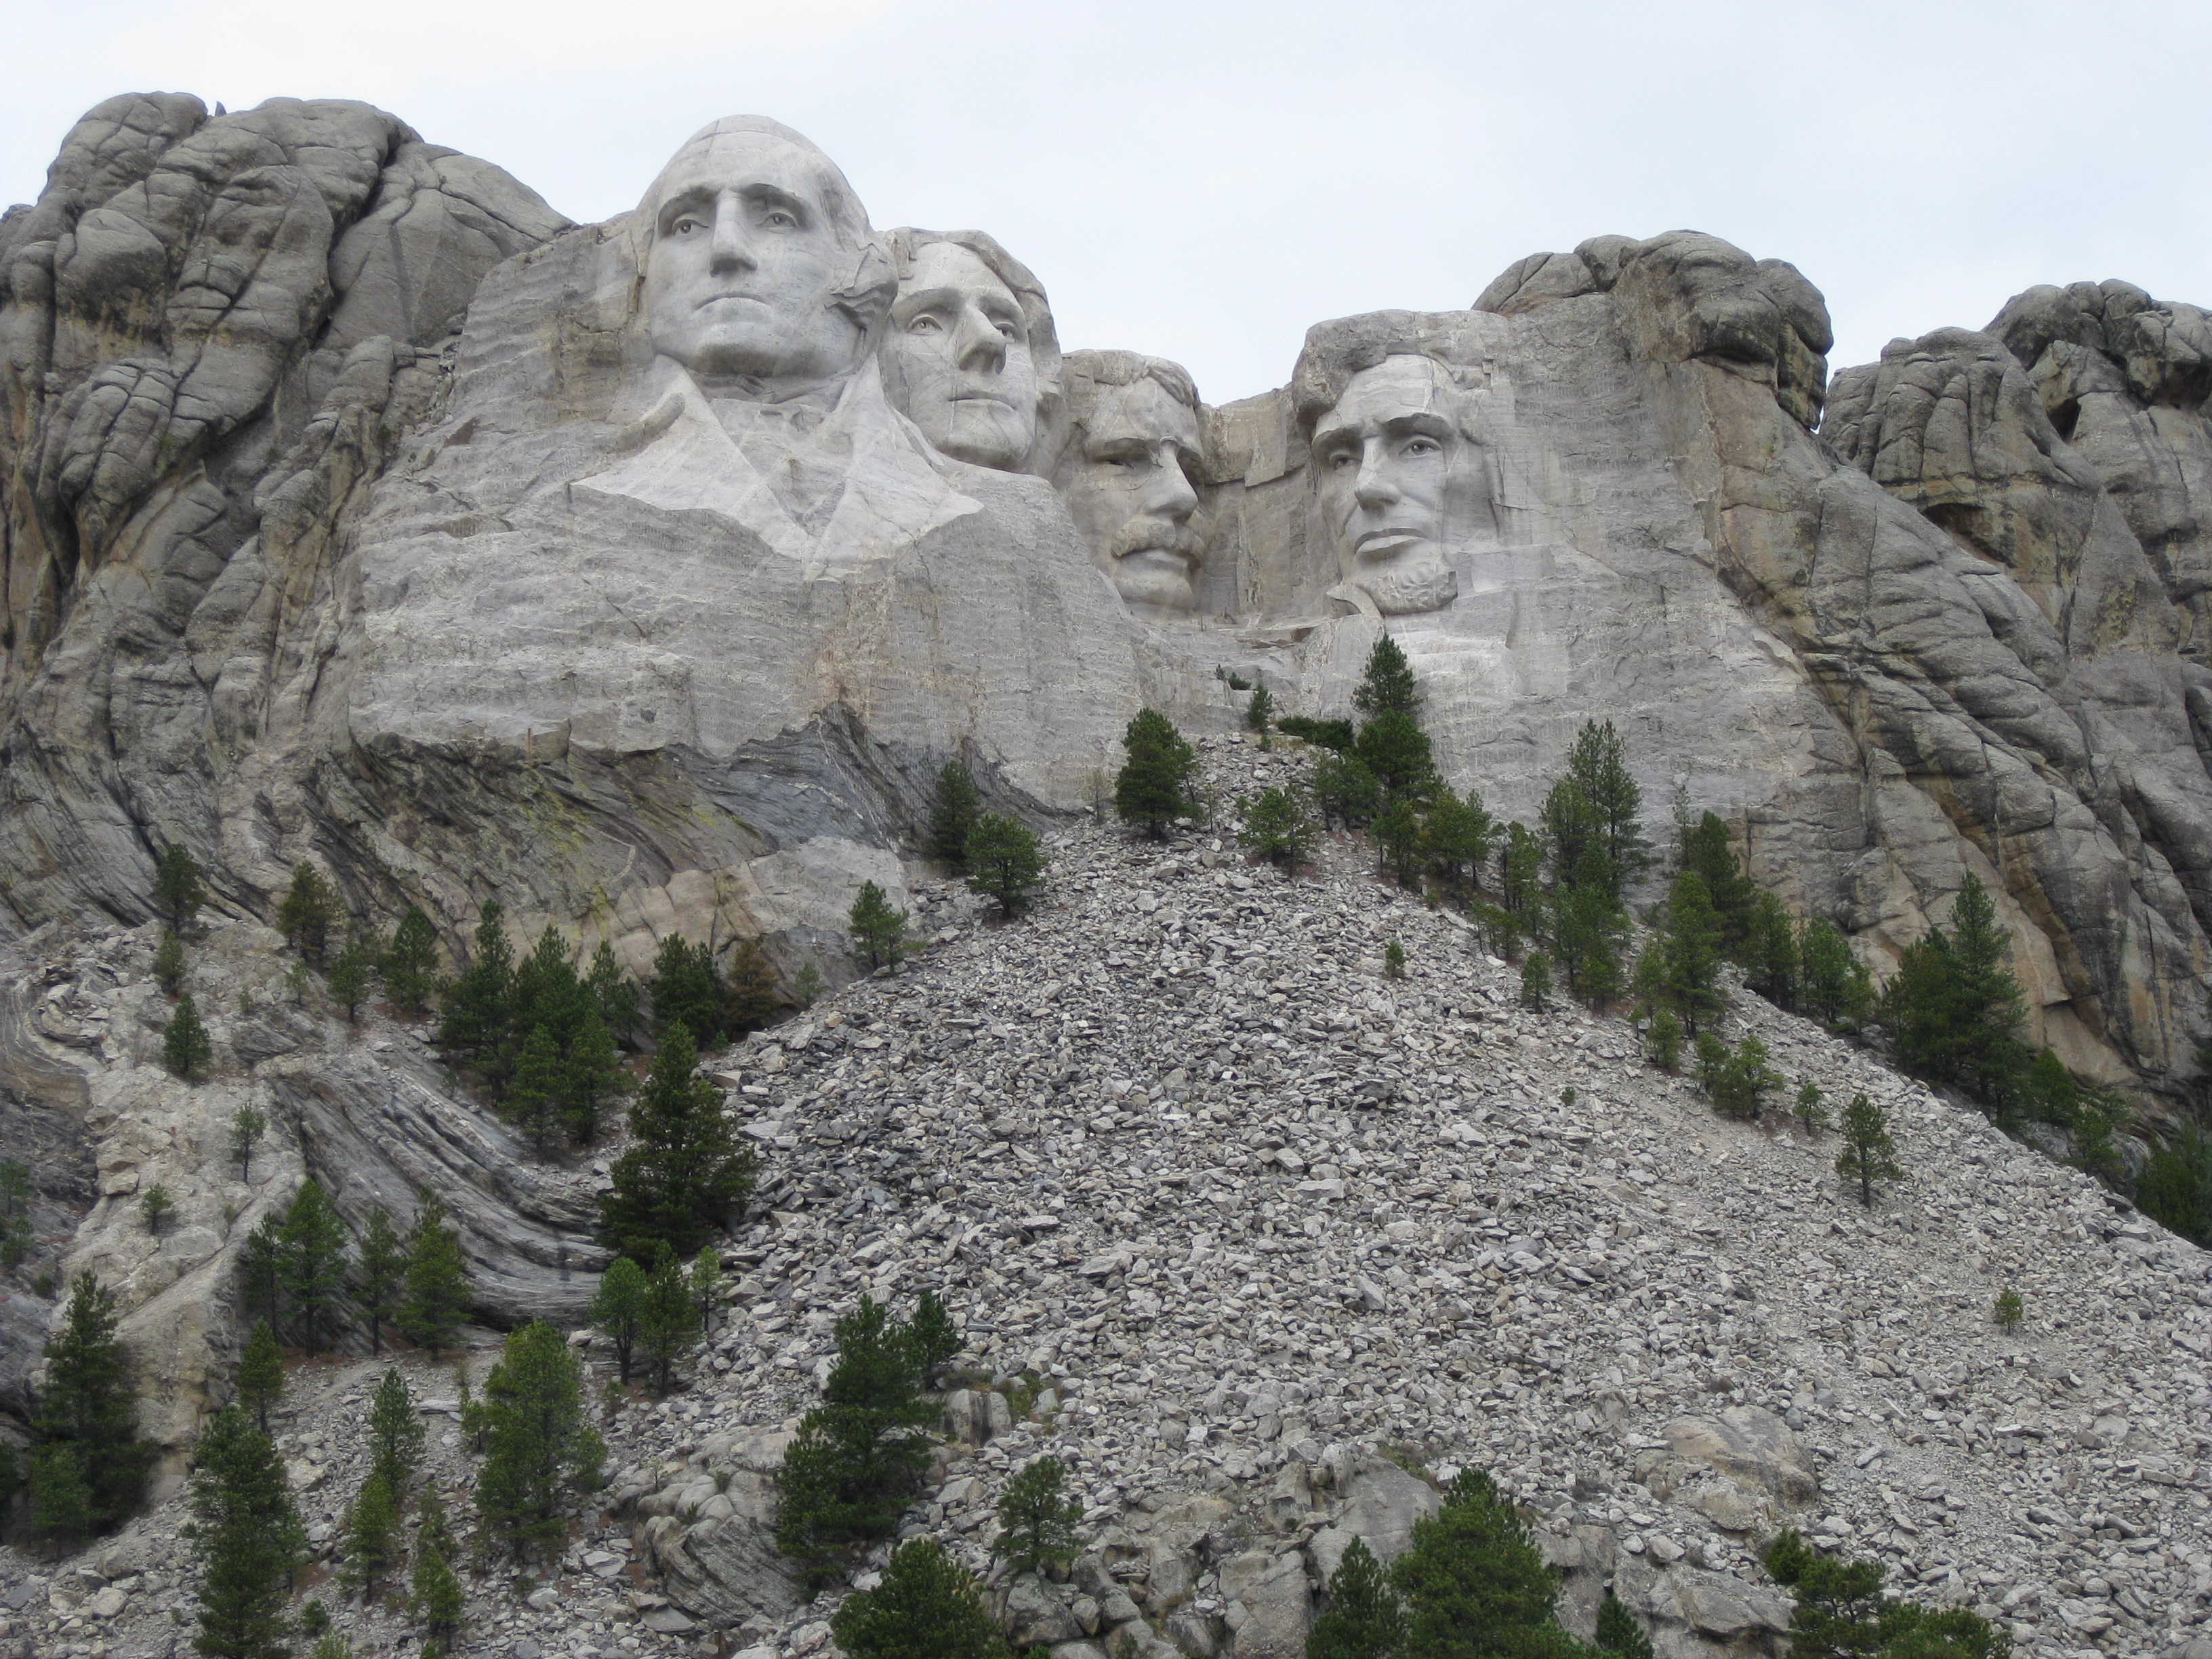
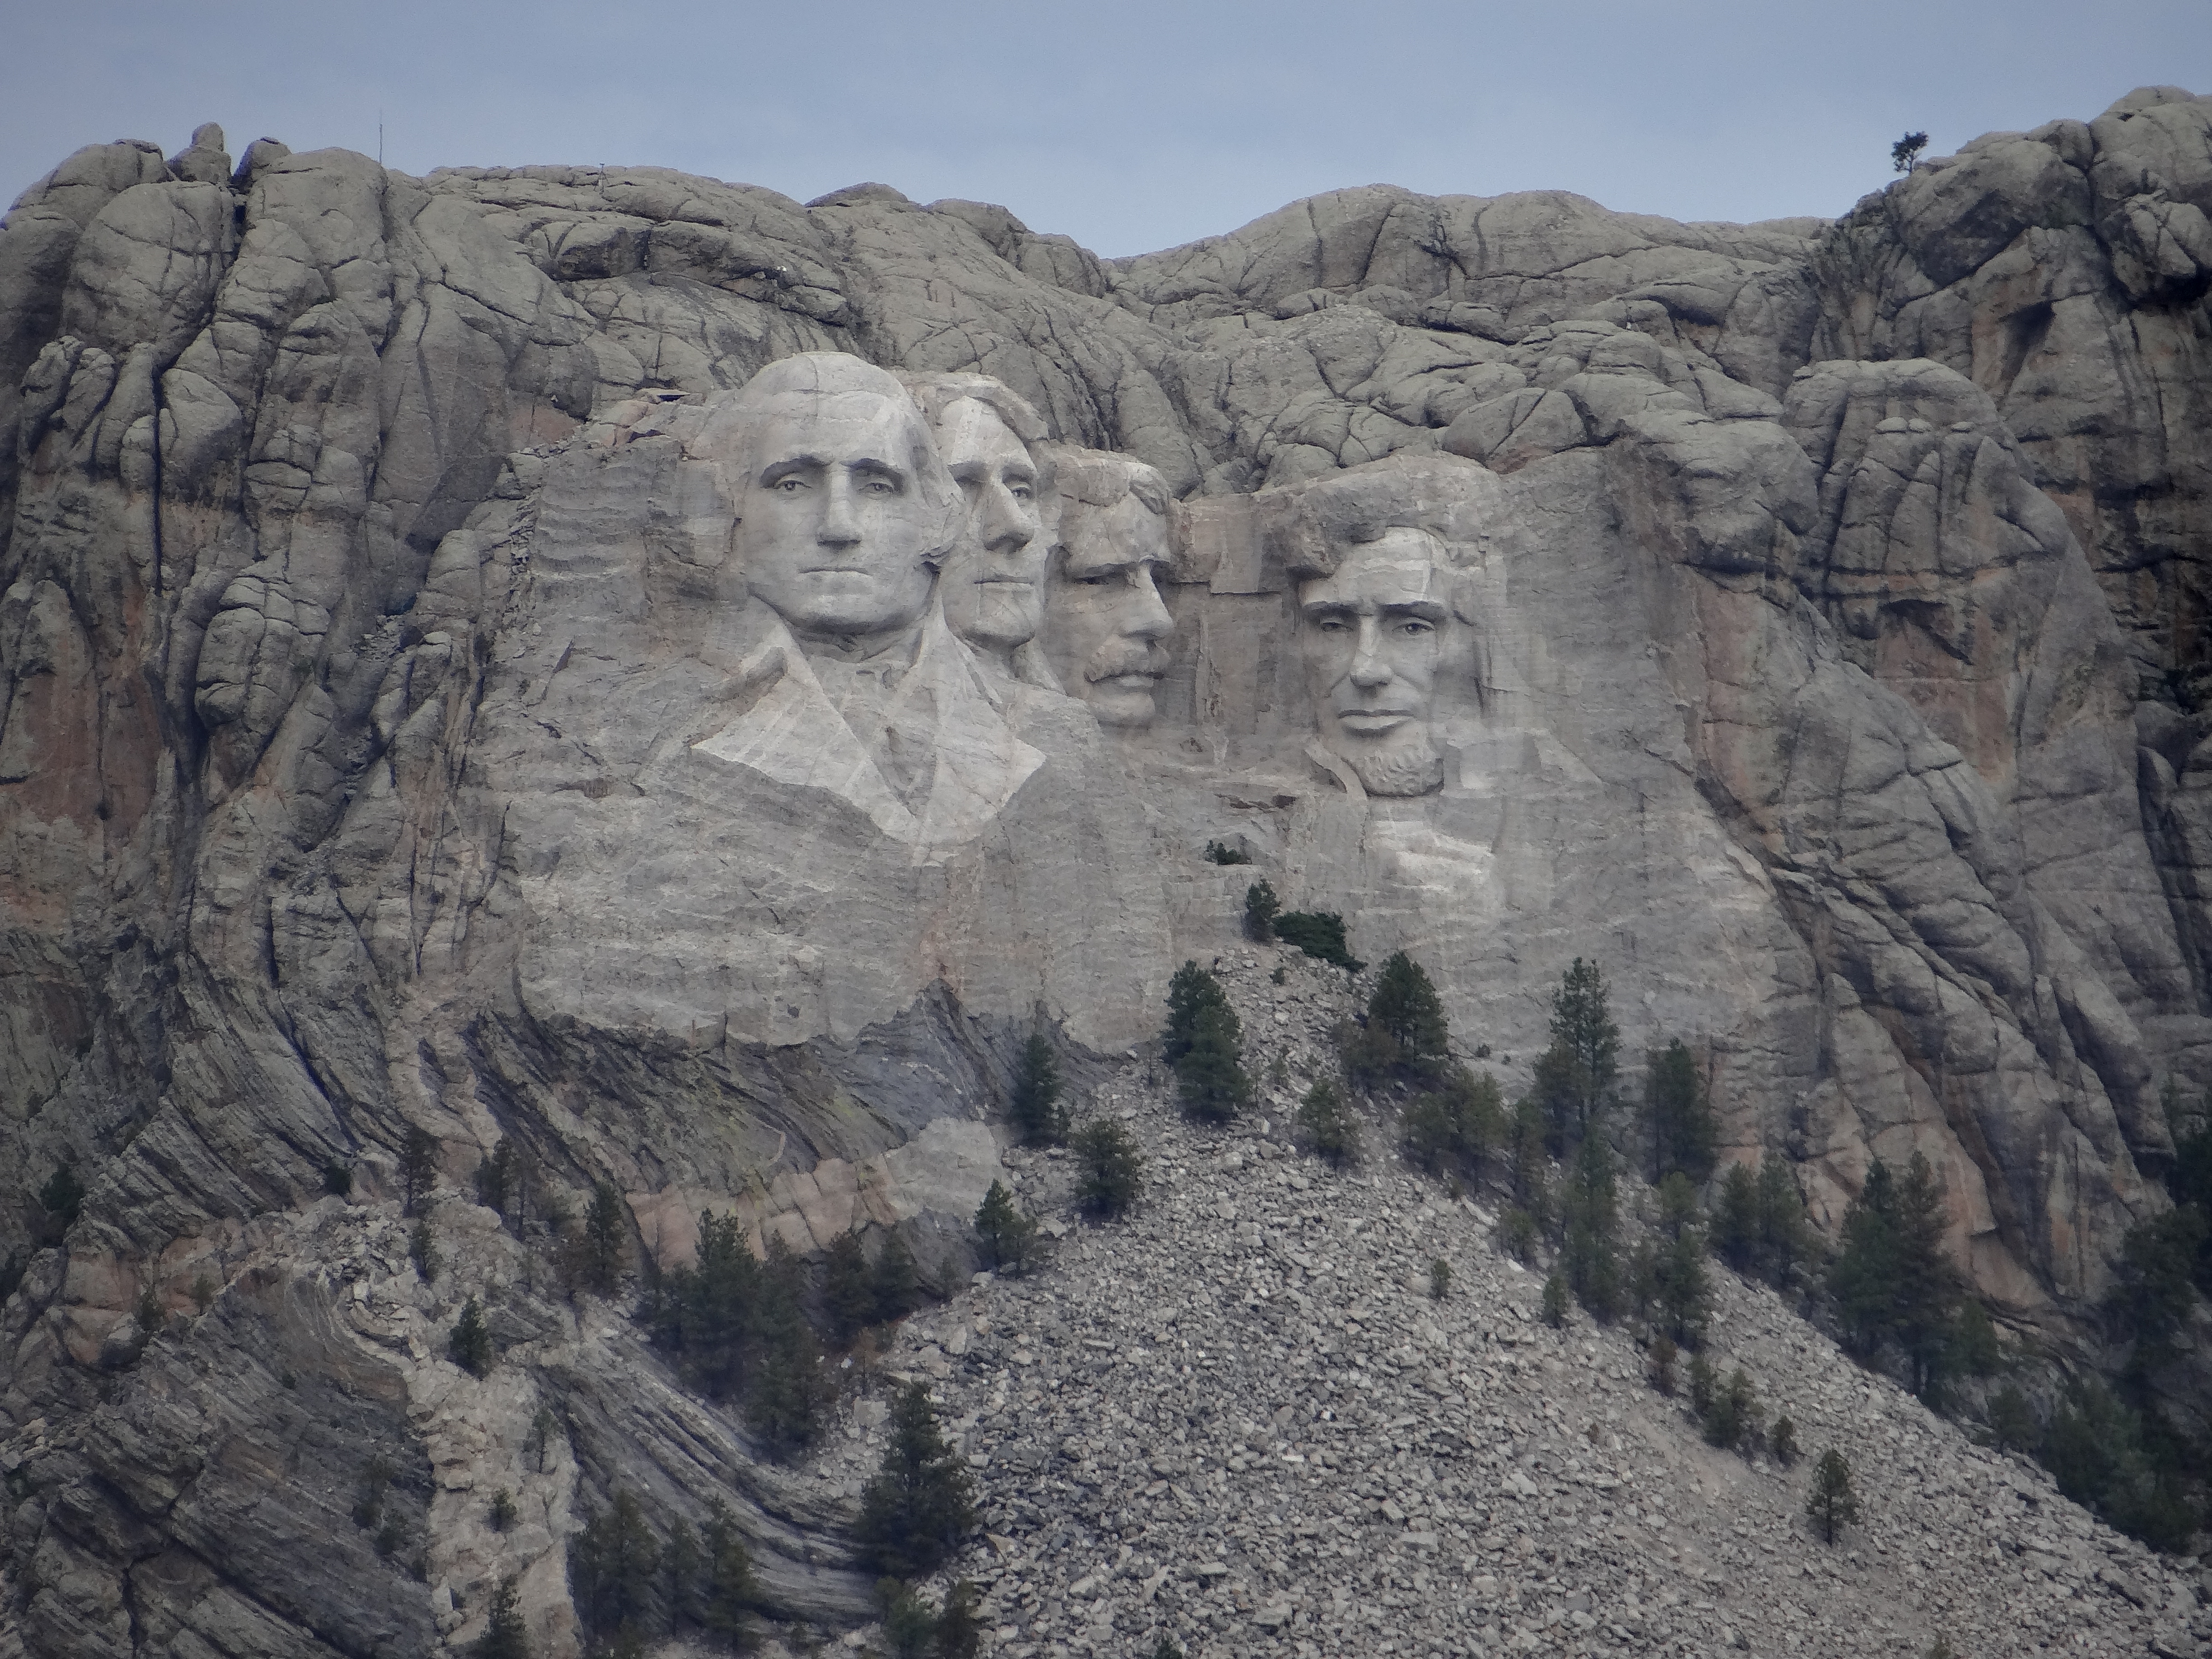
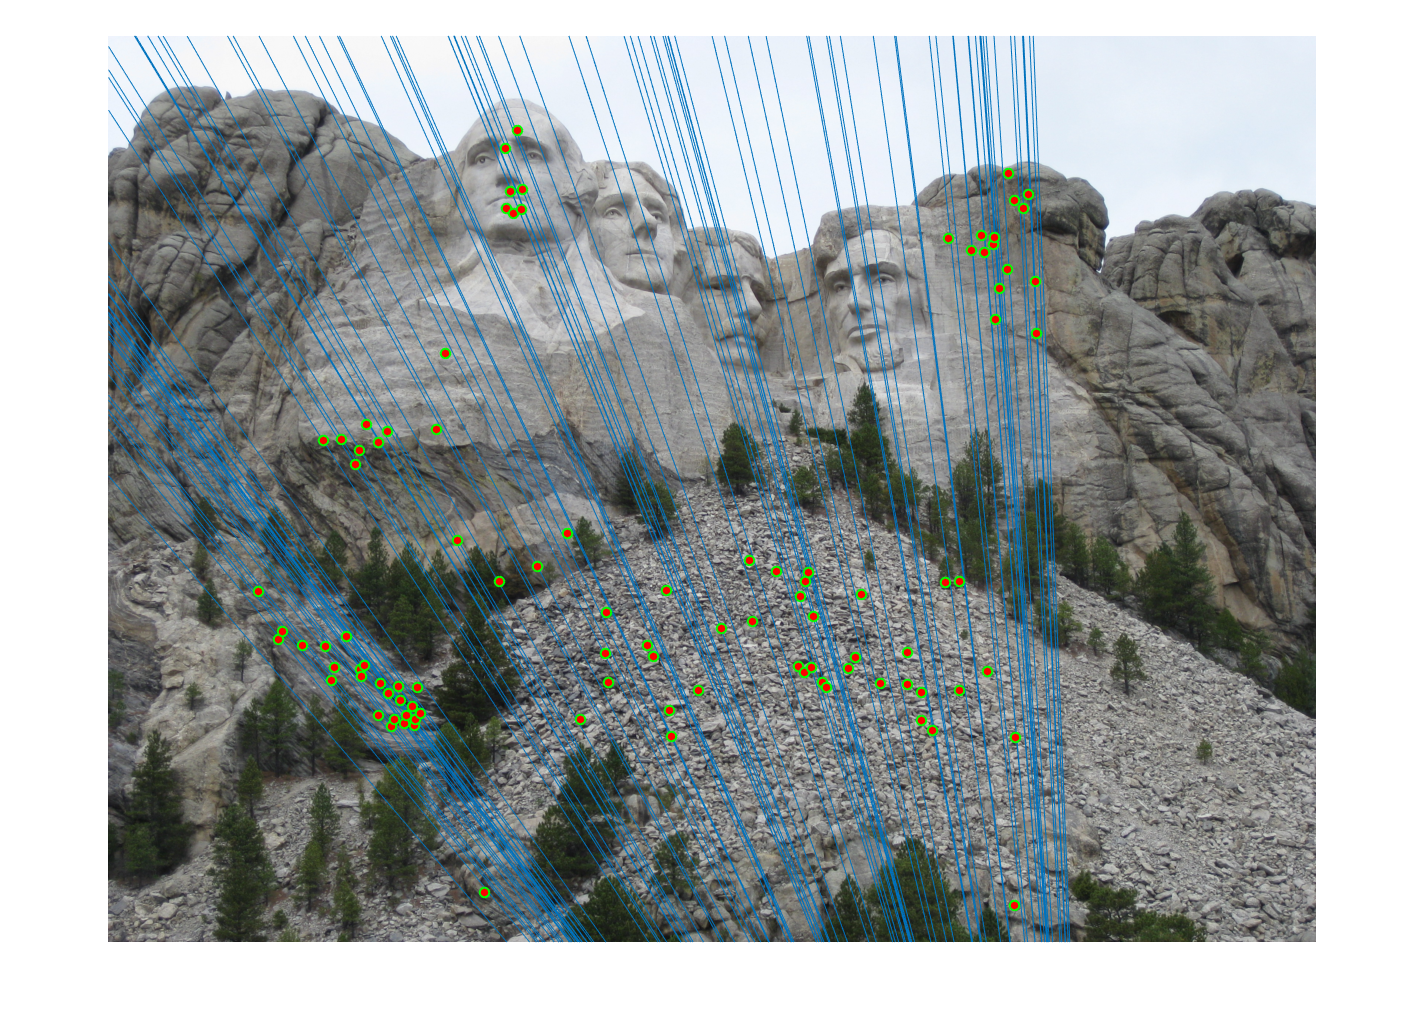
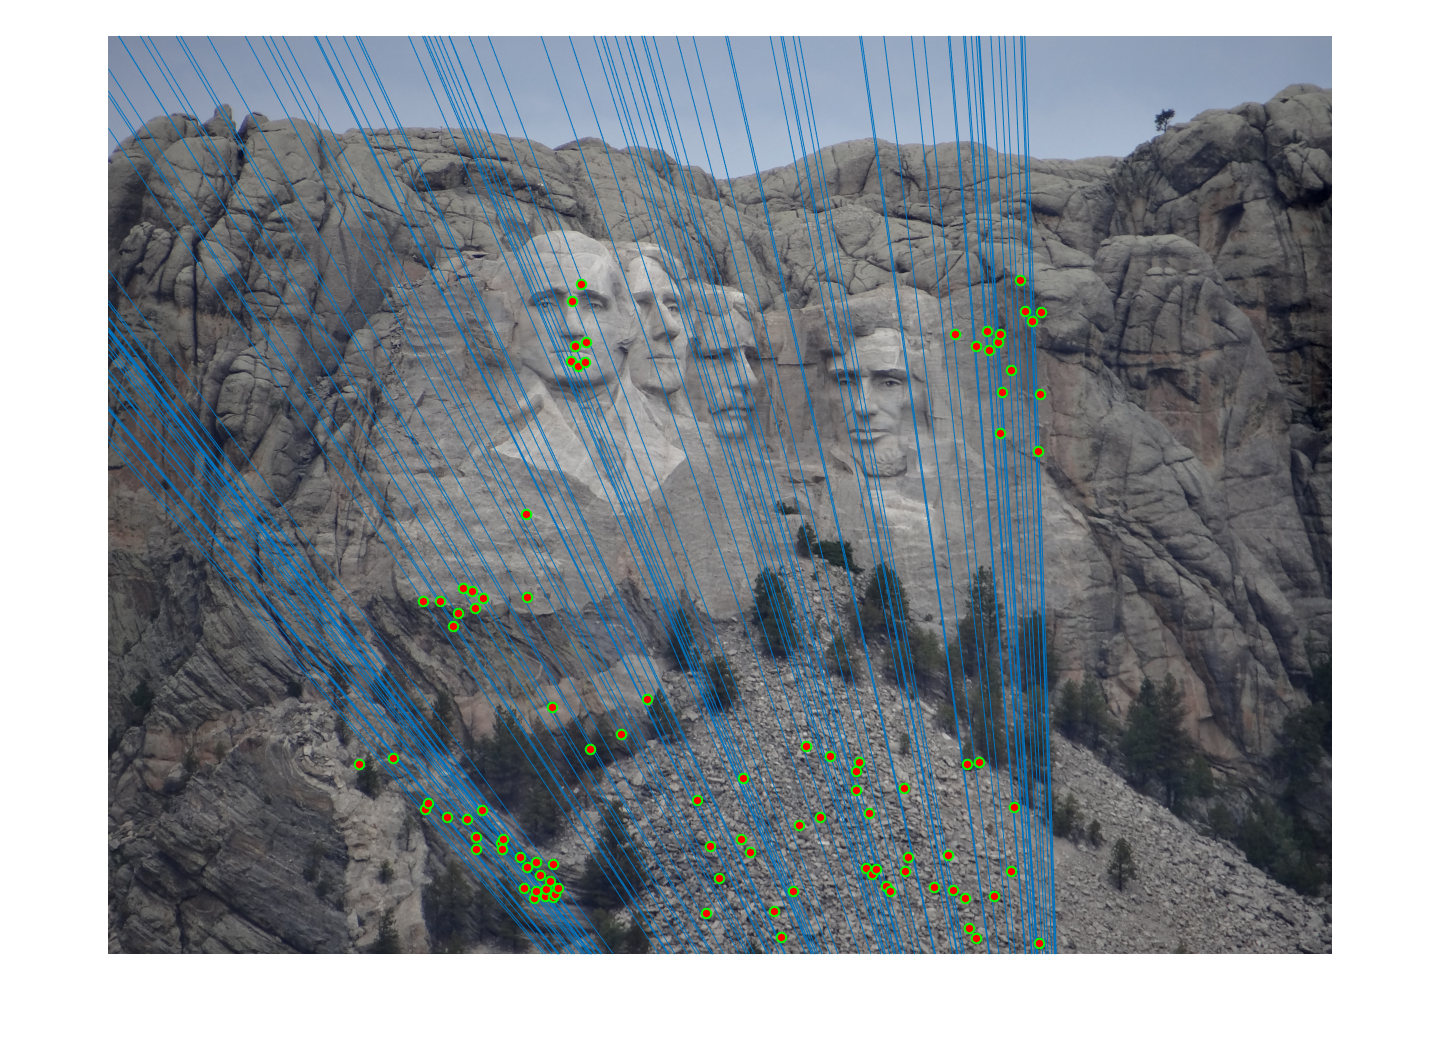
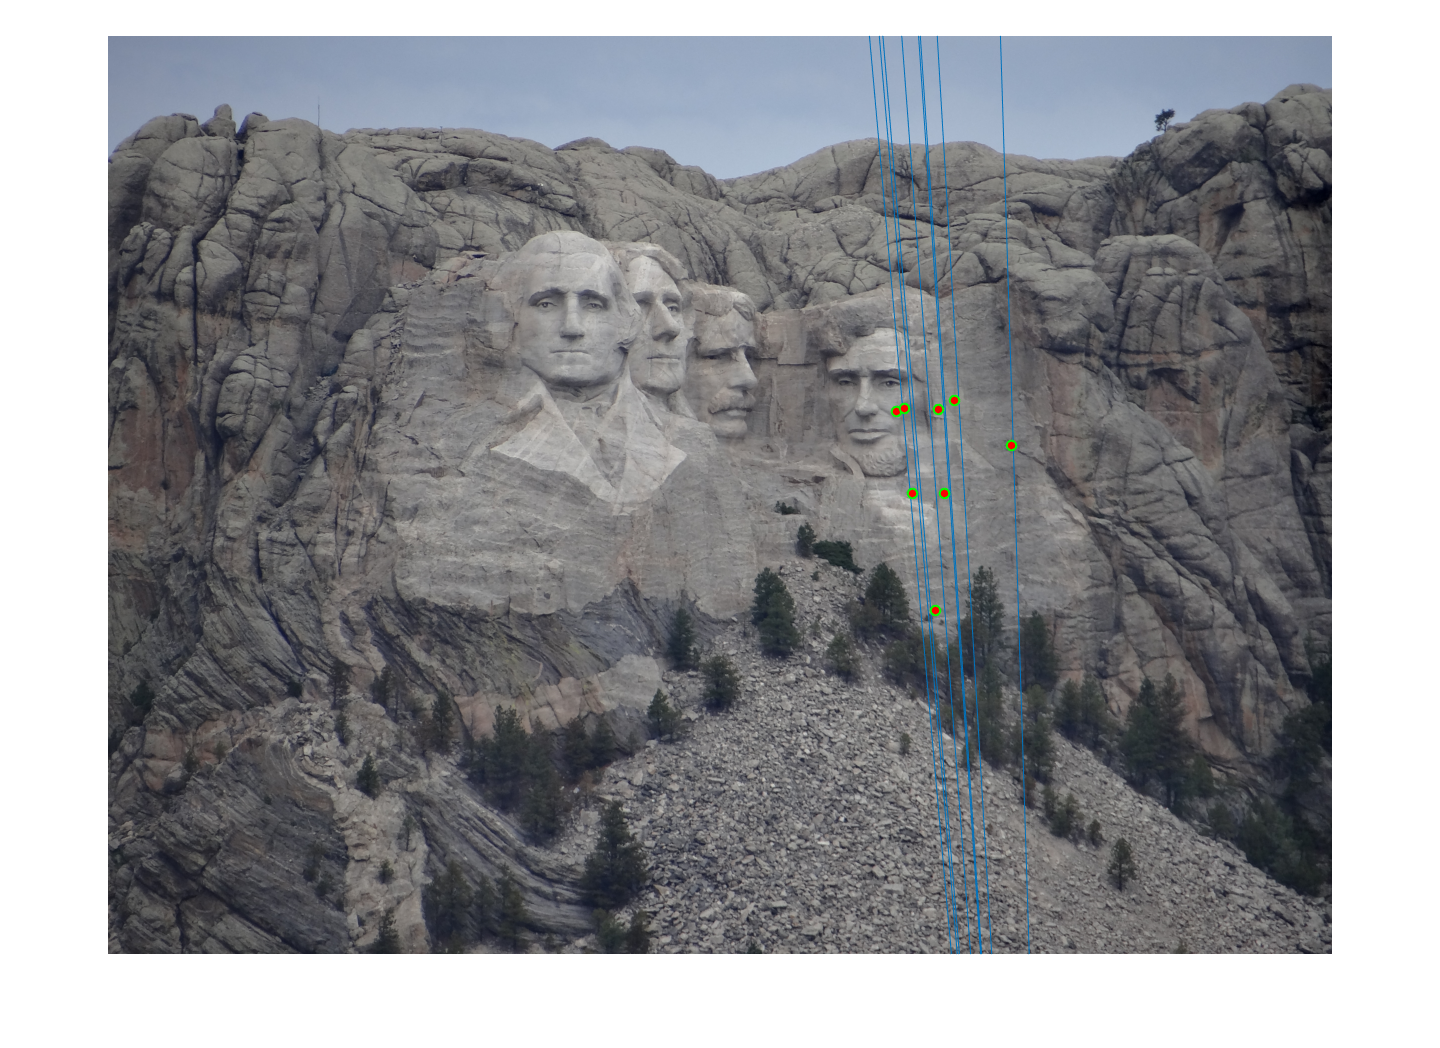
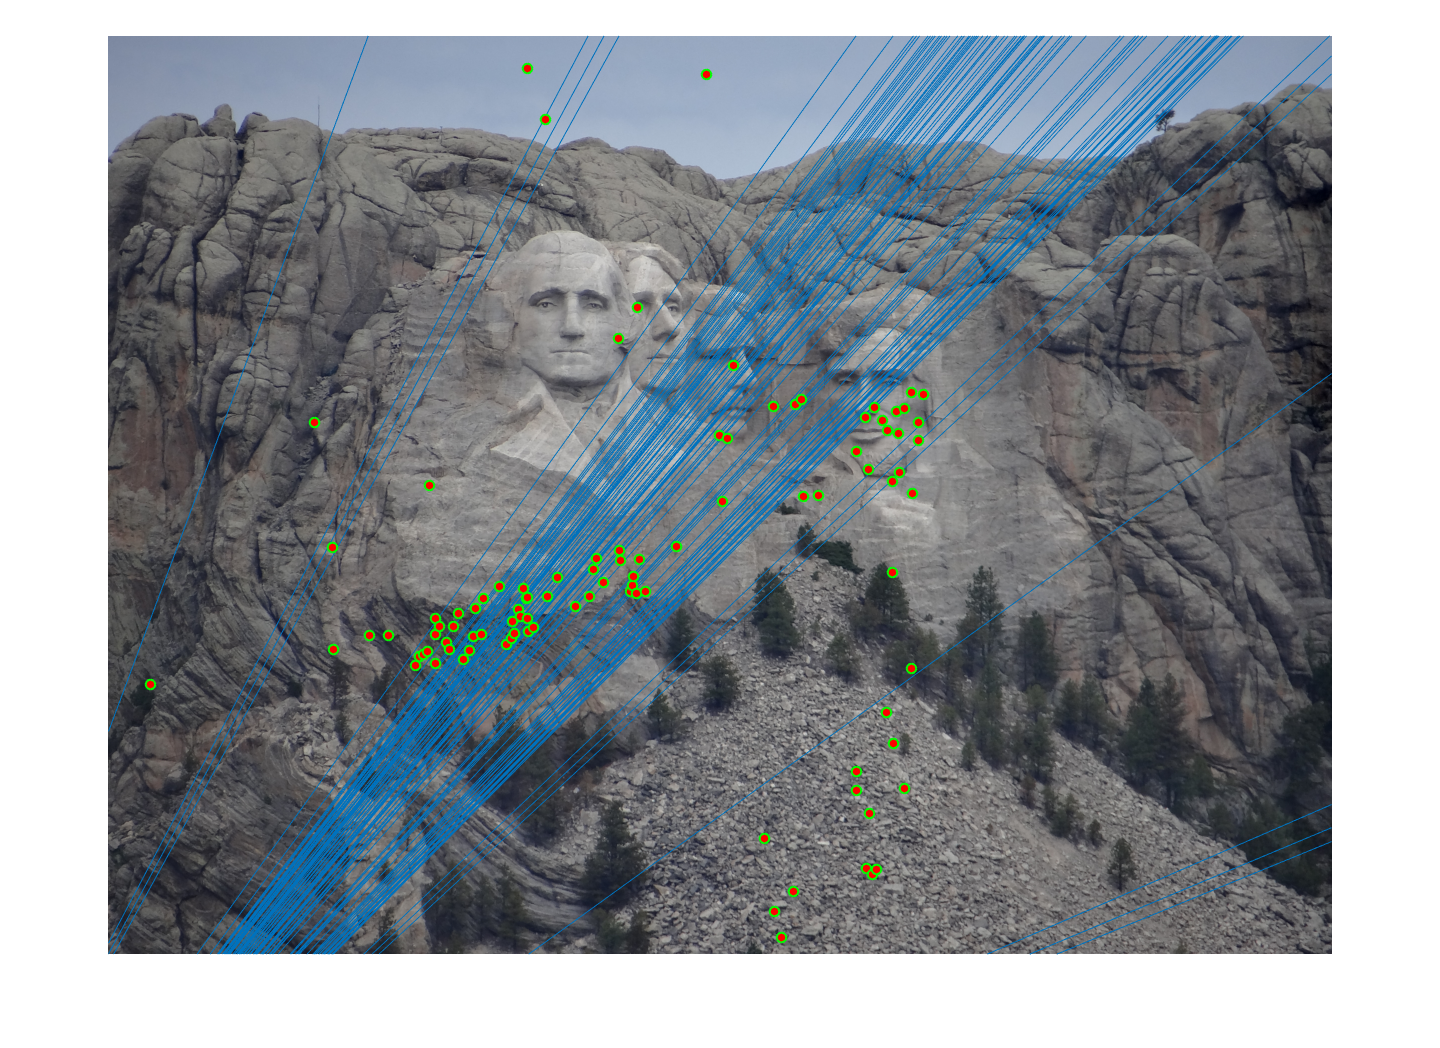
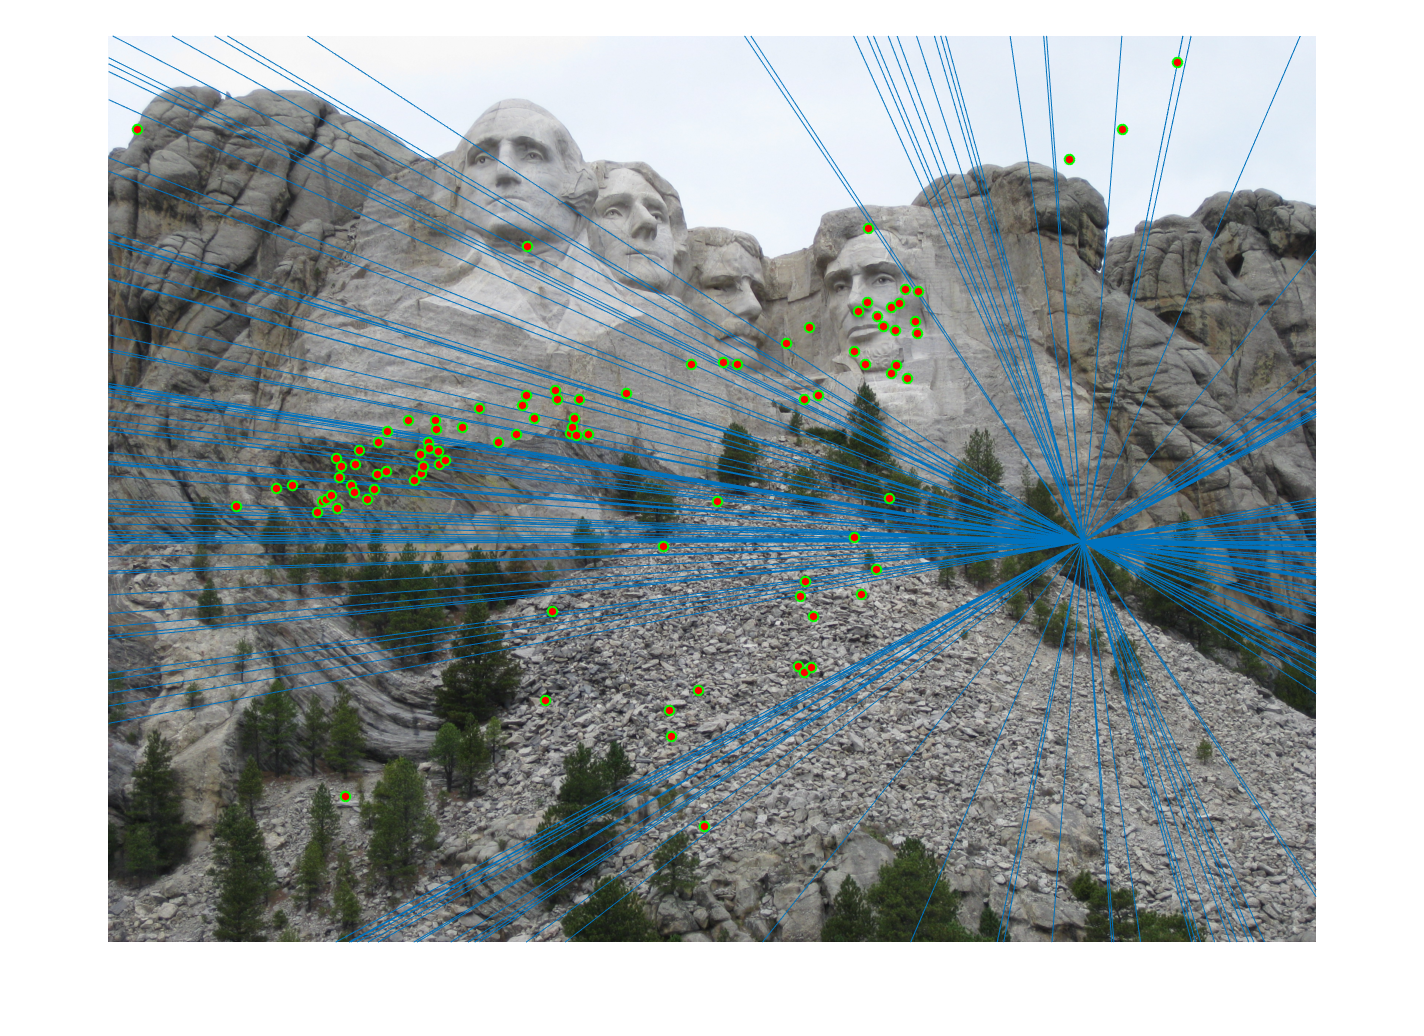
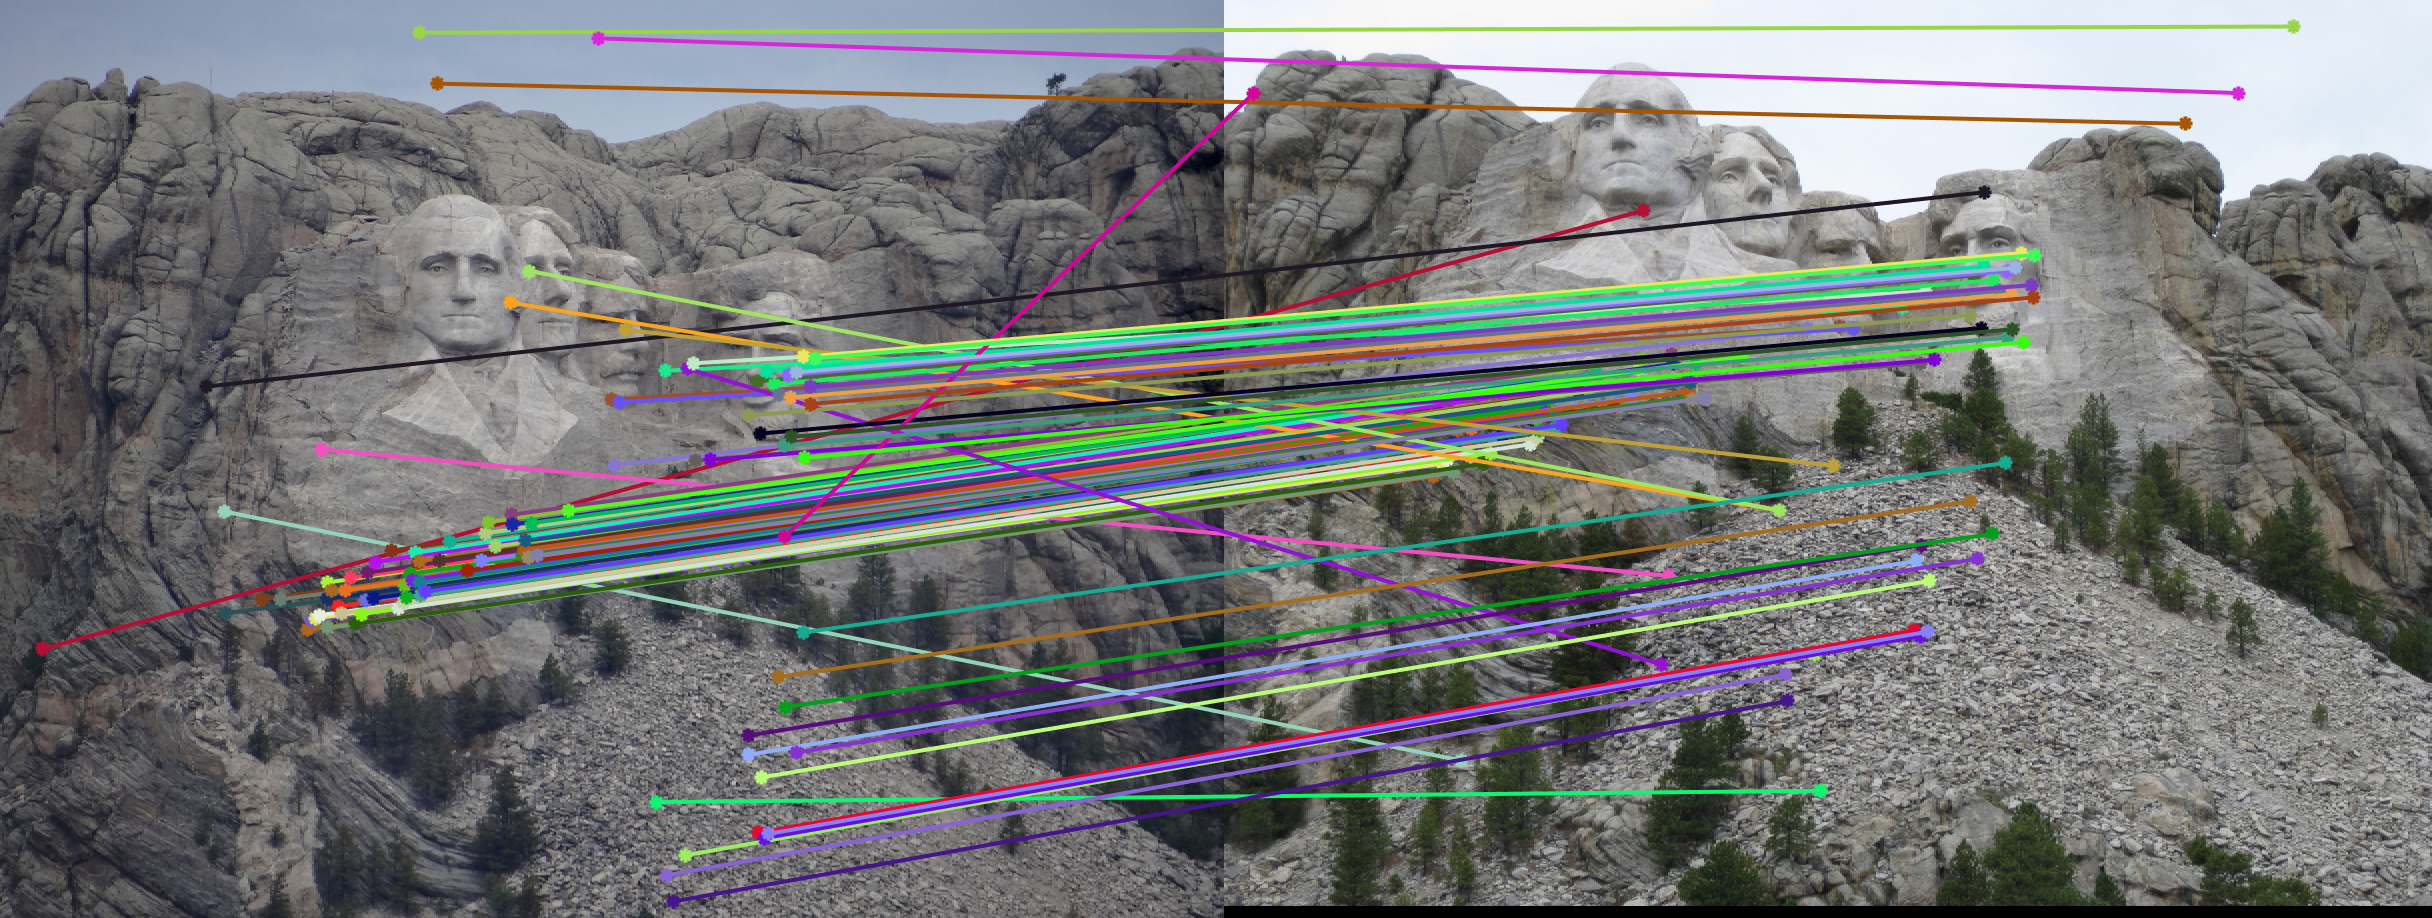
Mount Rushmore
We first run our algorithm on the following Mount Rushmore pair of images.
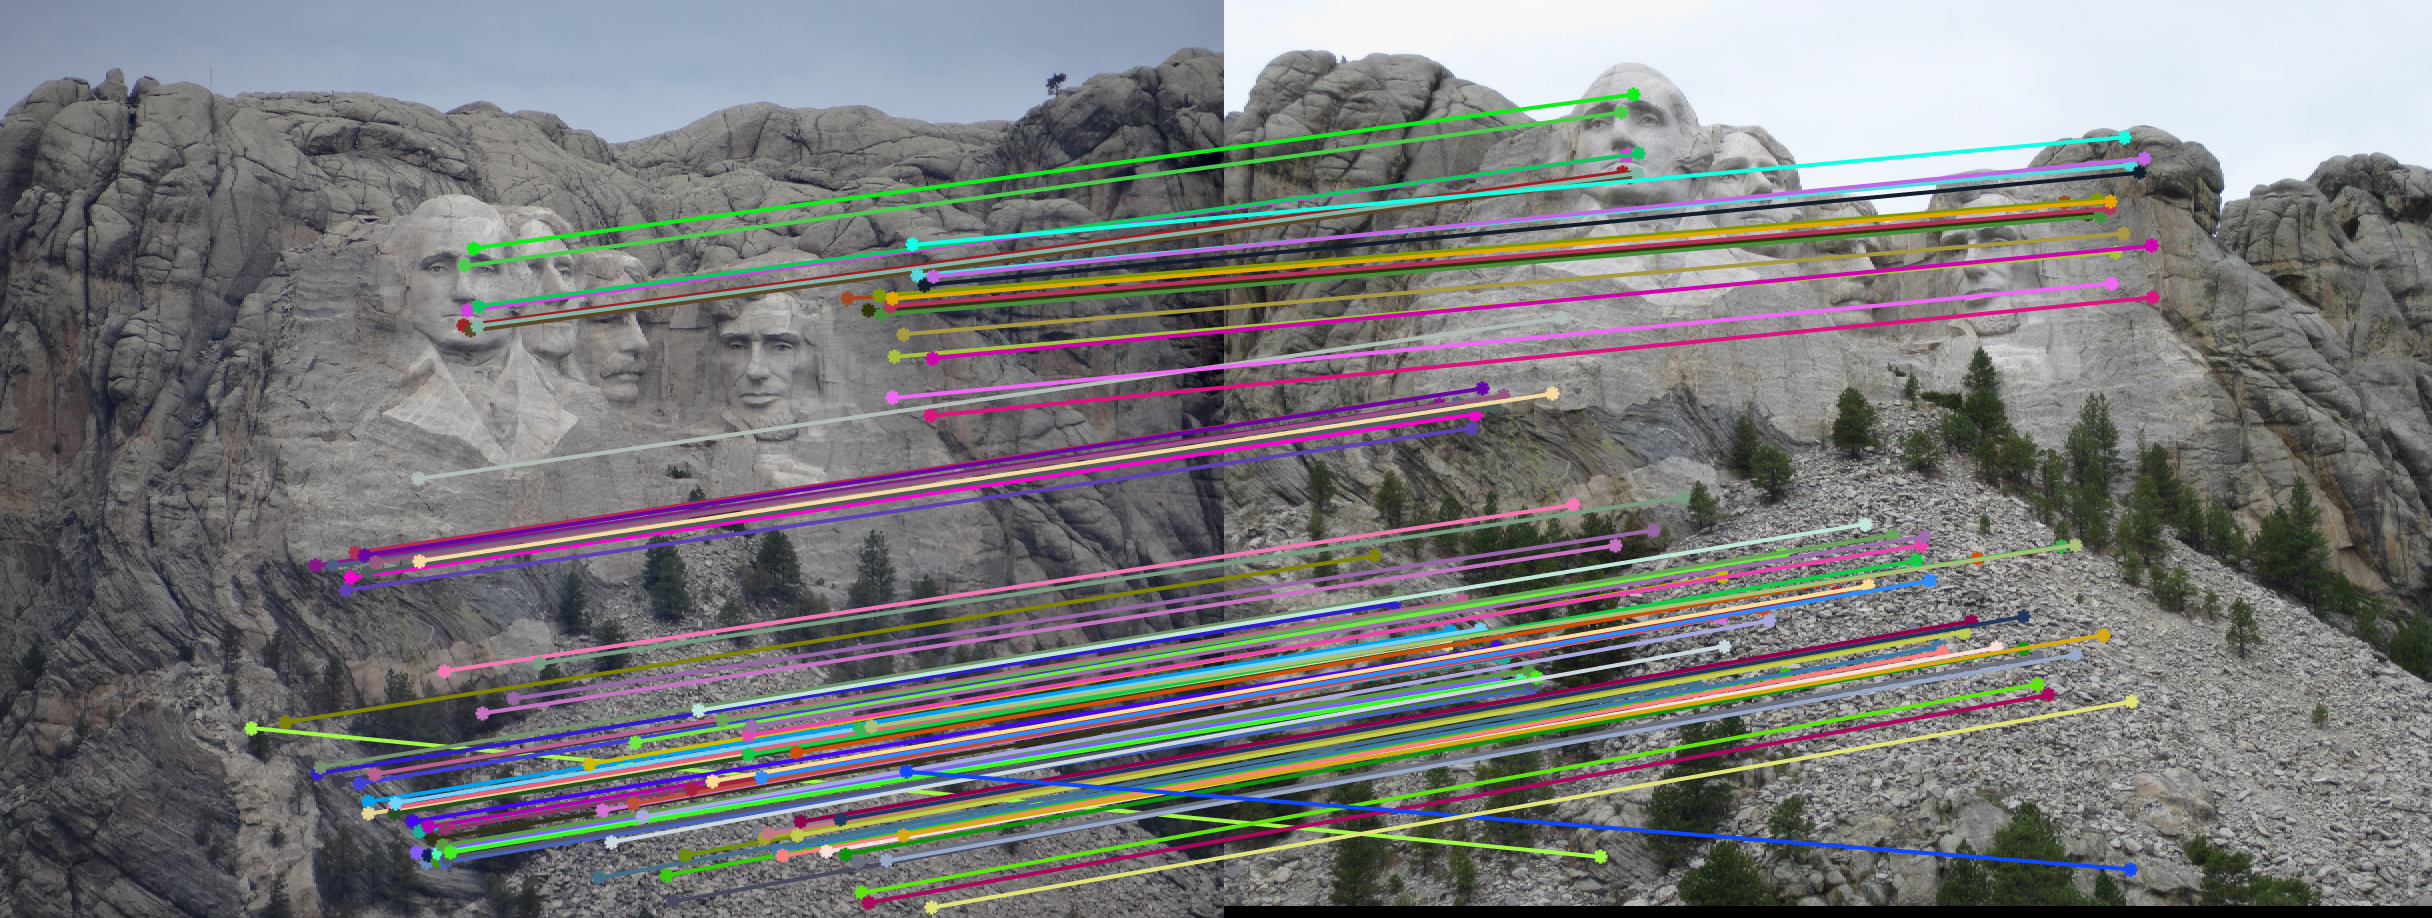
When we run the SIFT implementation, we get the following pairs of correspondances,
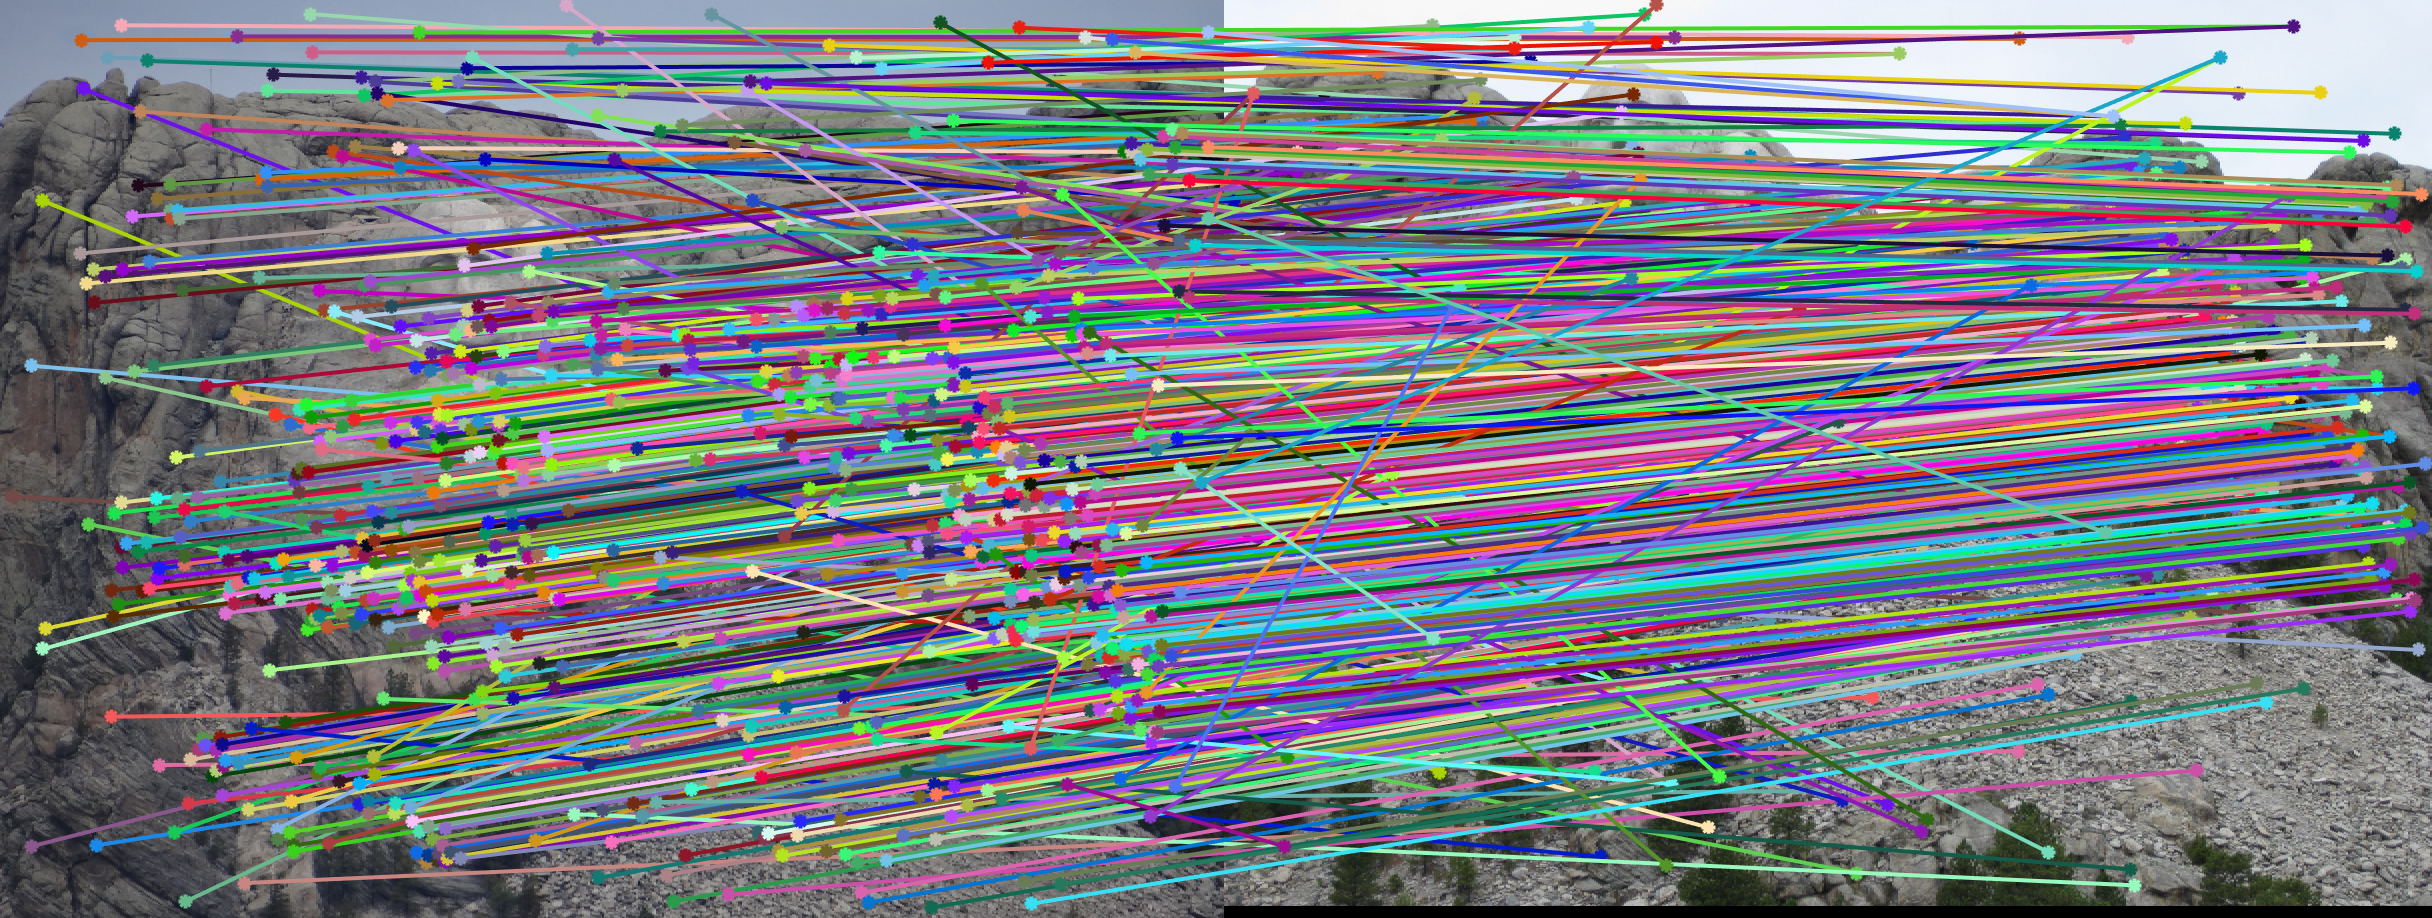
As we can see, there are a lot of matches between the two images. Last time, we used Nearest Neighbour method to find the best 100 matches. This time, we will use the top 100 inliers based on the Fundamental Matrix equation descirbed above.
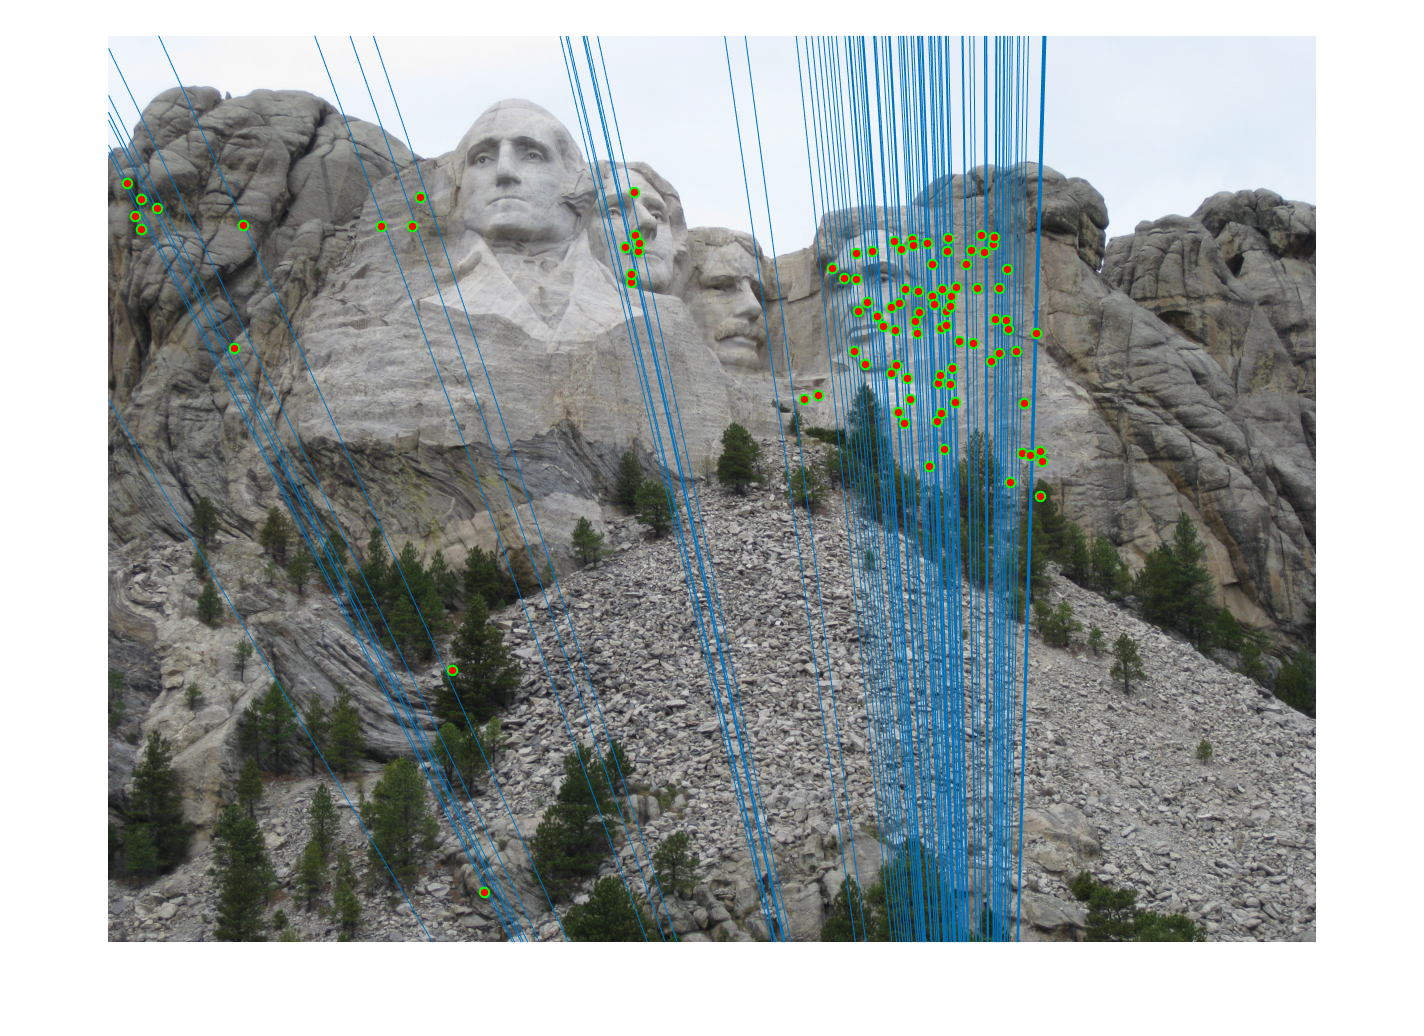
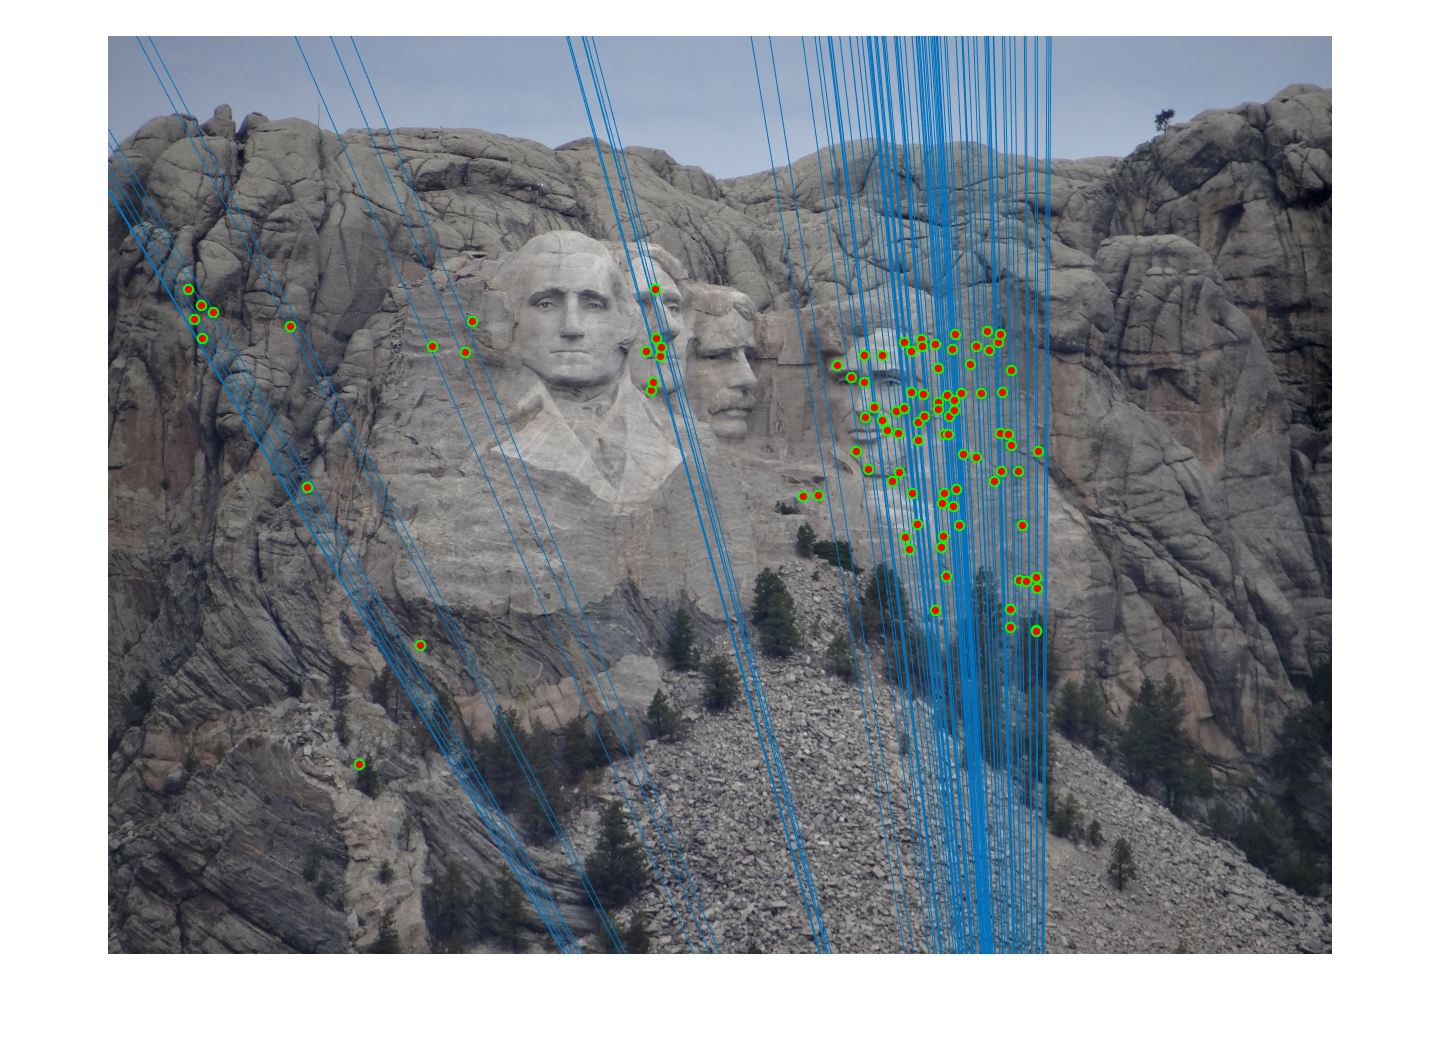
We estimate the fundamental matrix using RANSAC and we get the epipolar lines as shown below.
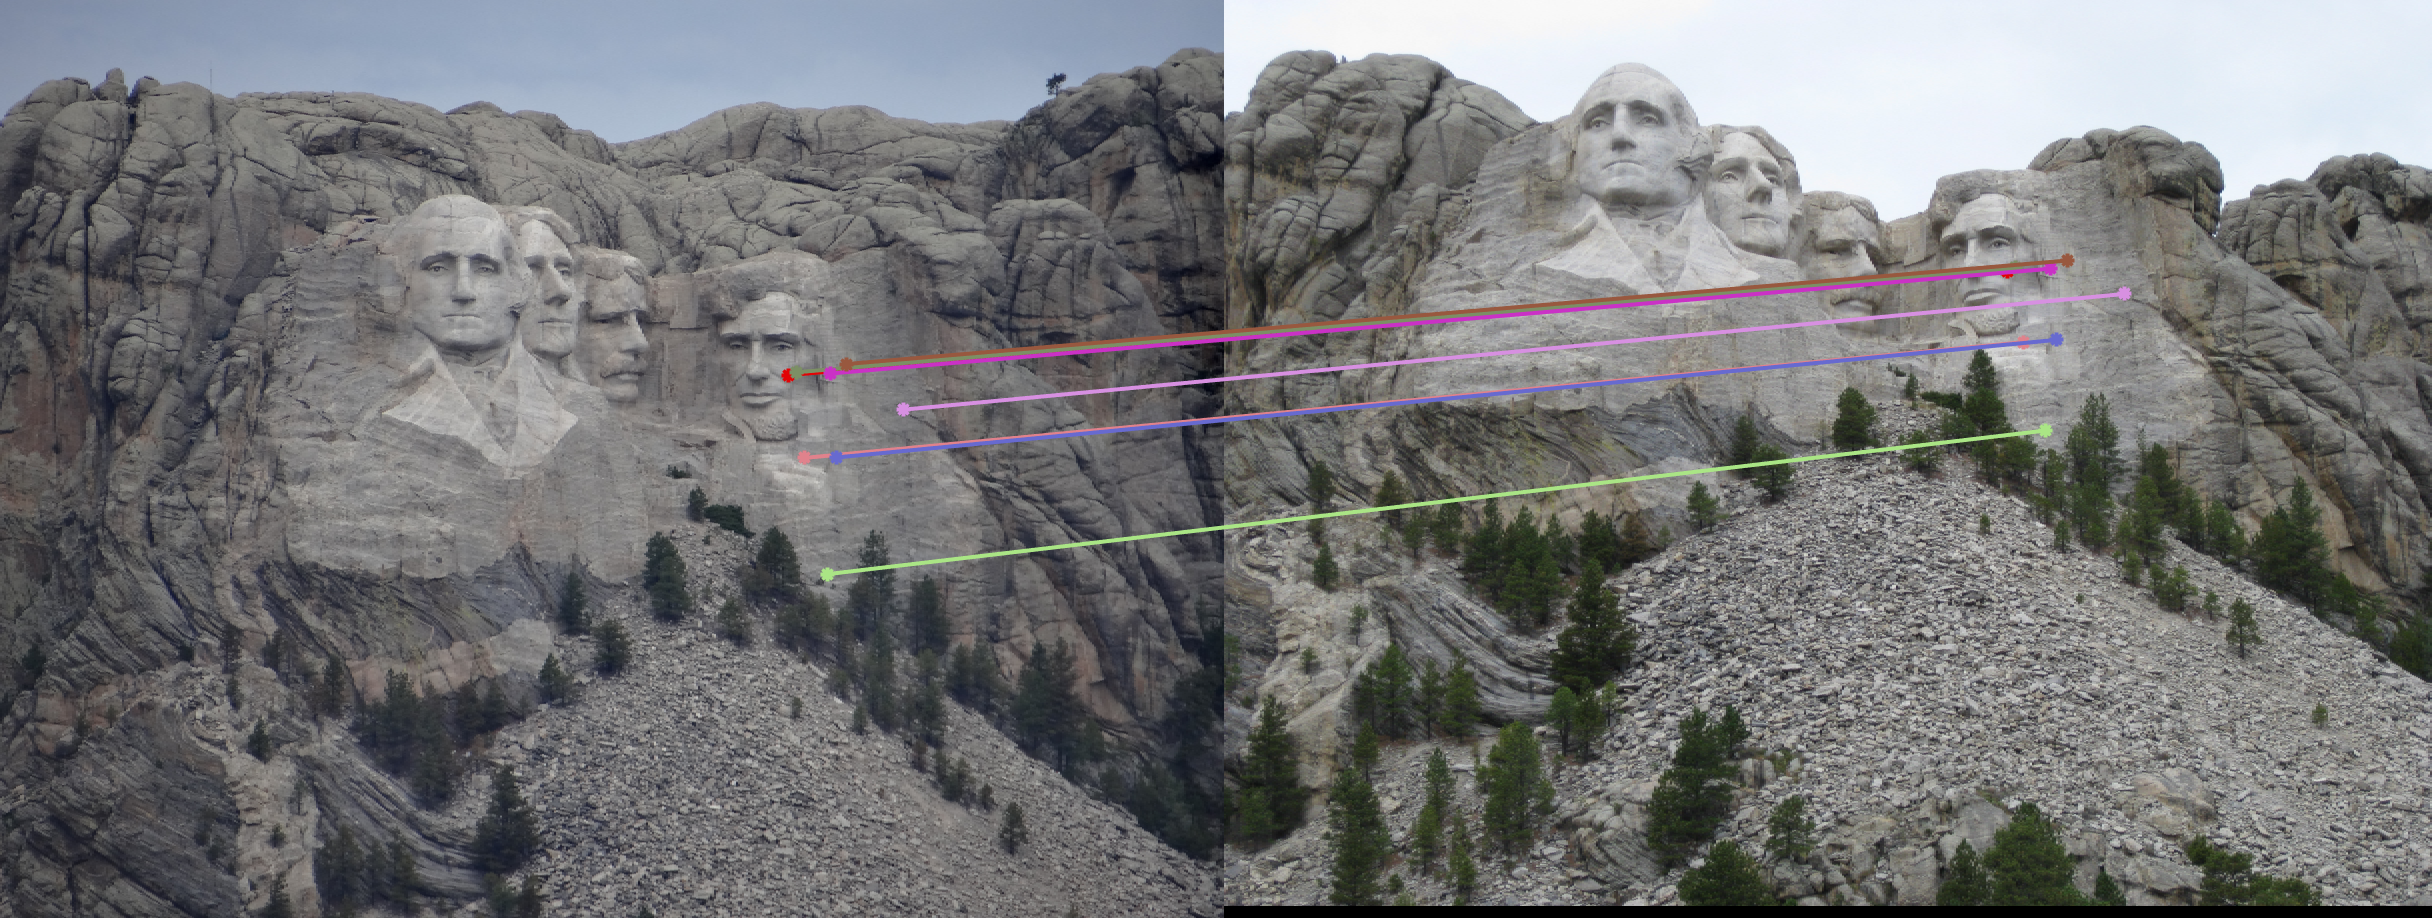
The correspondances that we get using the epipolar lines to search for the points in the other image are as follows,
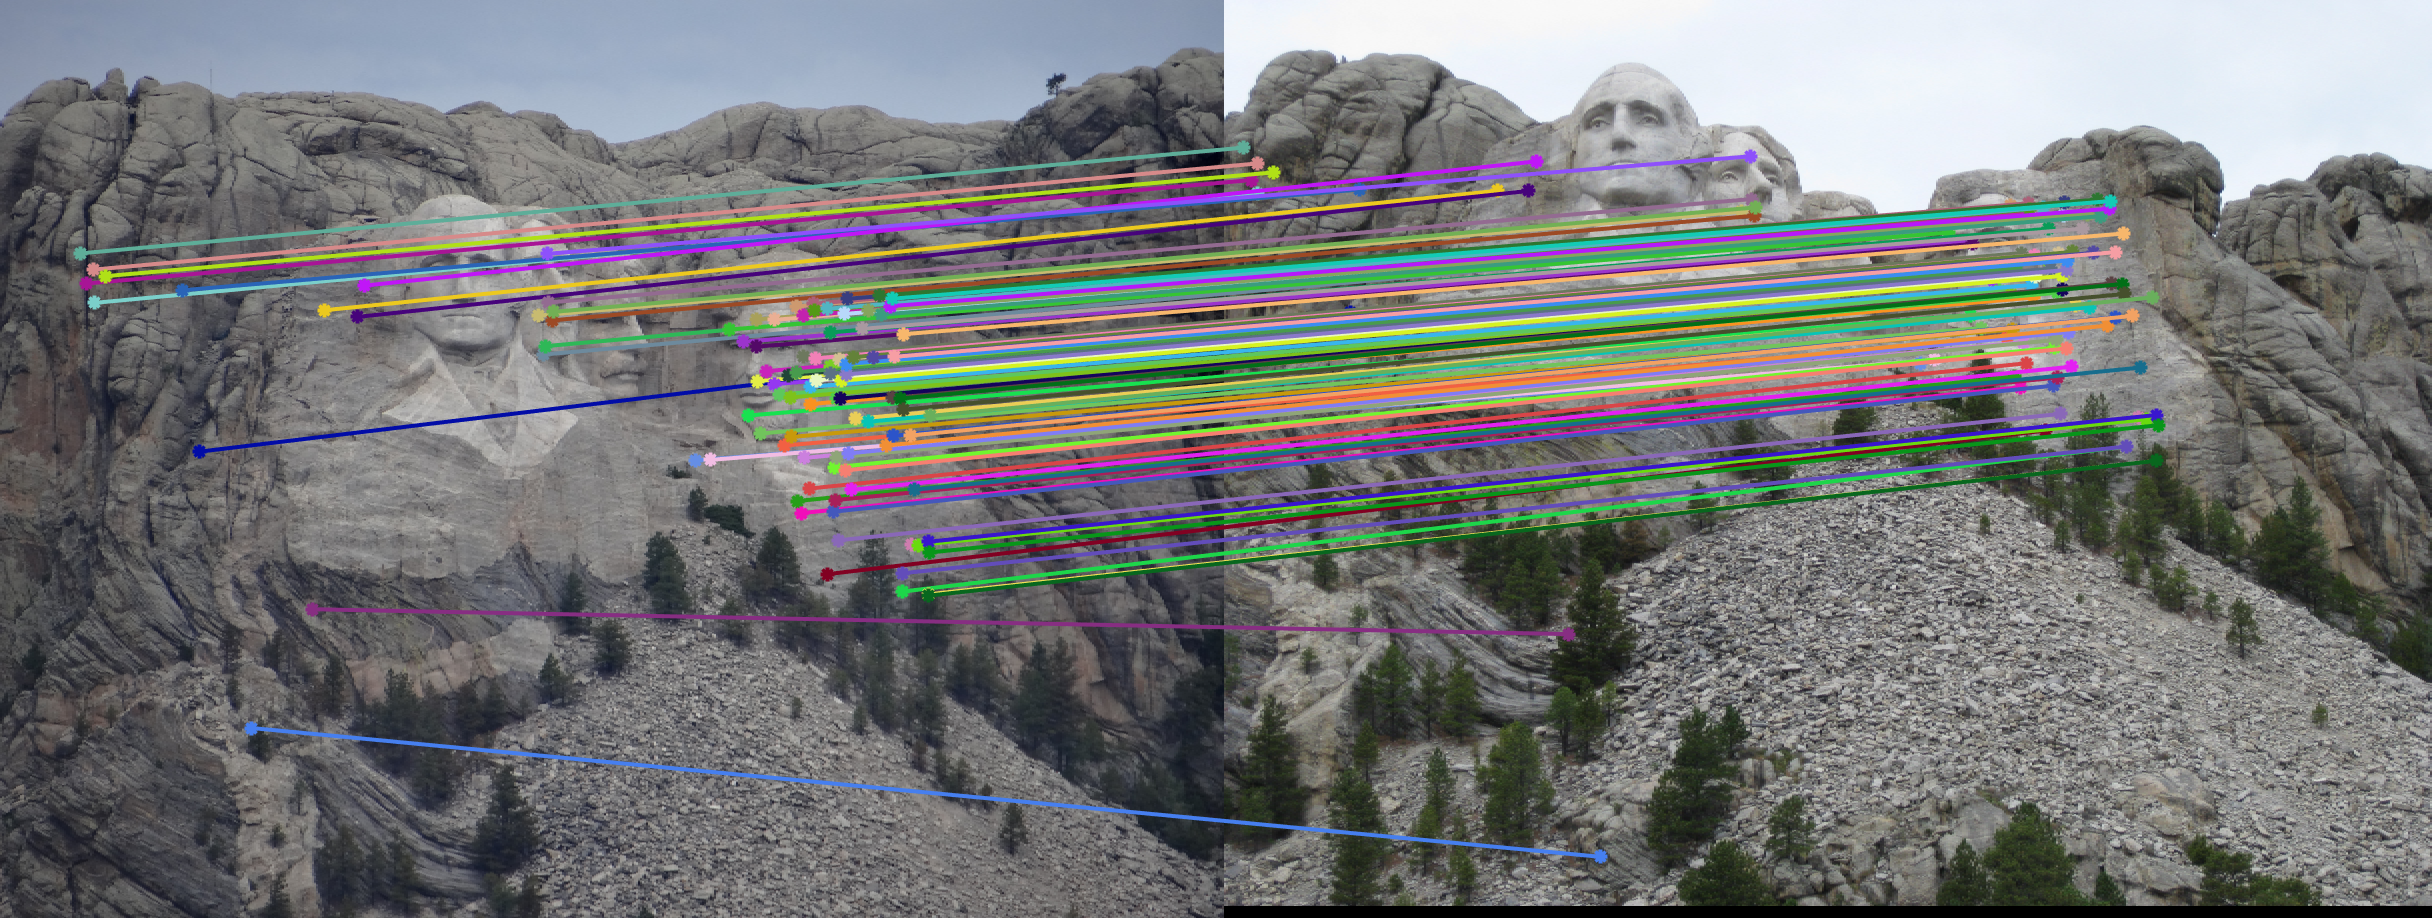
We can see that the correspondances are very accurate between the two images. I got an accuracy of around 25% on the Mount Rushmore pair using the SIFT-Nearest Neighbour approach in the previous project. It is a very good improvment over that algorithm. The epipolar lines restrict our search vastly and the results very clearly benefit from that.
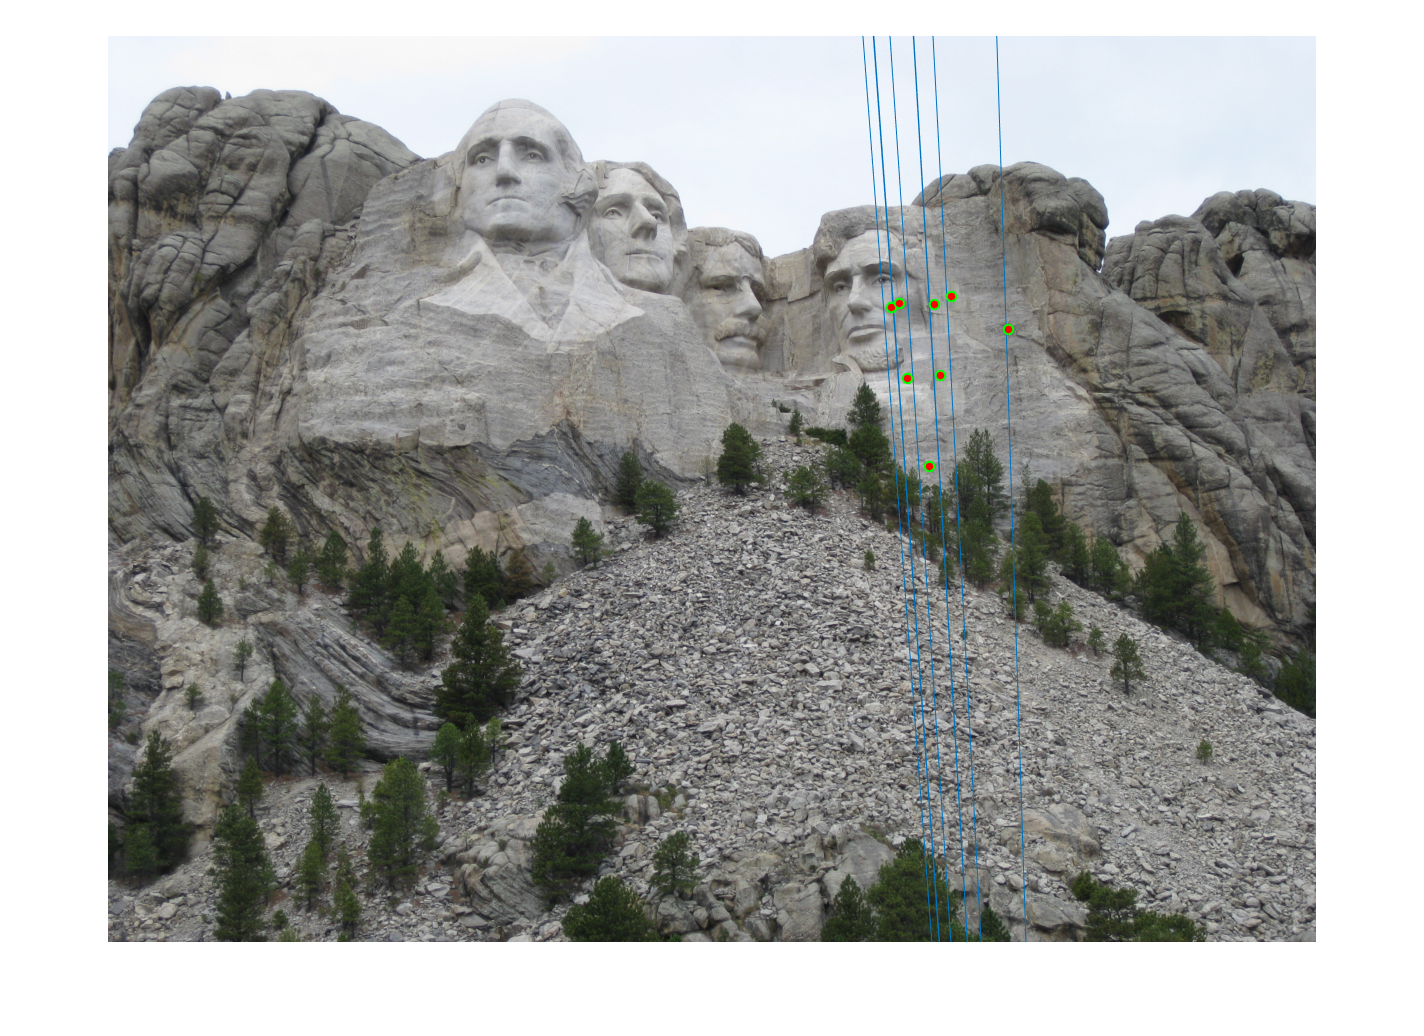
The points to be considered in RANSAC are chosen at random. Therefore, the results may vary. Here are the results on a different set of points.
Choosing Paramters
There were a couple of parameters that could be chosen in RANSAC. The ones that I varied were,
- The number of runs of the algorithm
- The threshold for the consensus set
- The number of points to use while estimating the fundamental matrix
- Scaling factor for normalization - 1 or √2
- Normalization
Number of runs of algorithm
The number of runs of the algorithm was important. If it was too less, we might've not explored too many sets to give the best fundamental matrix estimation. If it was too much, we were needlessly exploring (wasted effort).
According to the RANSAC equation, for 8 points and a probability of outliers set at 50%, to get a 99% probability that we will find at least one good set, we should set the number of runs at 1177. I started off with those parameters but set the number of runs at 5000, to be conservative. However, the best fundamental matrix was consistently not updated after 3000 iterations. The reminaing iterations were wasted effort.
For 2500 iterations, the best matrix wasn't updated after around 1500 iterations. Finally, at 1200 iterations, the algorithm had only two more mistakes on average as compared to the 5000 iteration algorithm. If anything, this speaks to the implementation of SIFT by VLFeat, that gives good matches with more than 50% probability.
Threshold for the consensus set
In order to put the results in the larger context of comparison with the algorithm from project 2, I took the top 100 matches and compare the accuracy. The threshold was varied so that it would accept the number of elements that was close to 100 (keeping a buffer for randomness of course).
I started off with a thresholf of 0.05. However, it turned out to be too much and accepted more than 500 points consistently. So, I varied the threshold until I got about 200 points on average. The value of the threshold is set at 0.02.
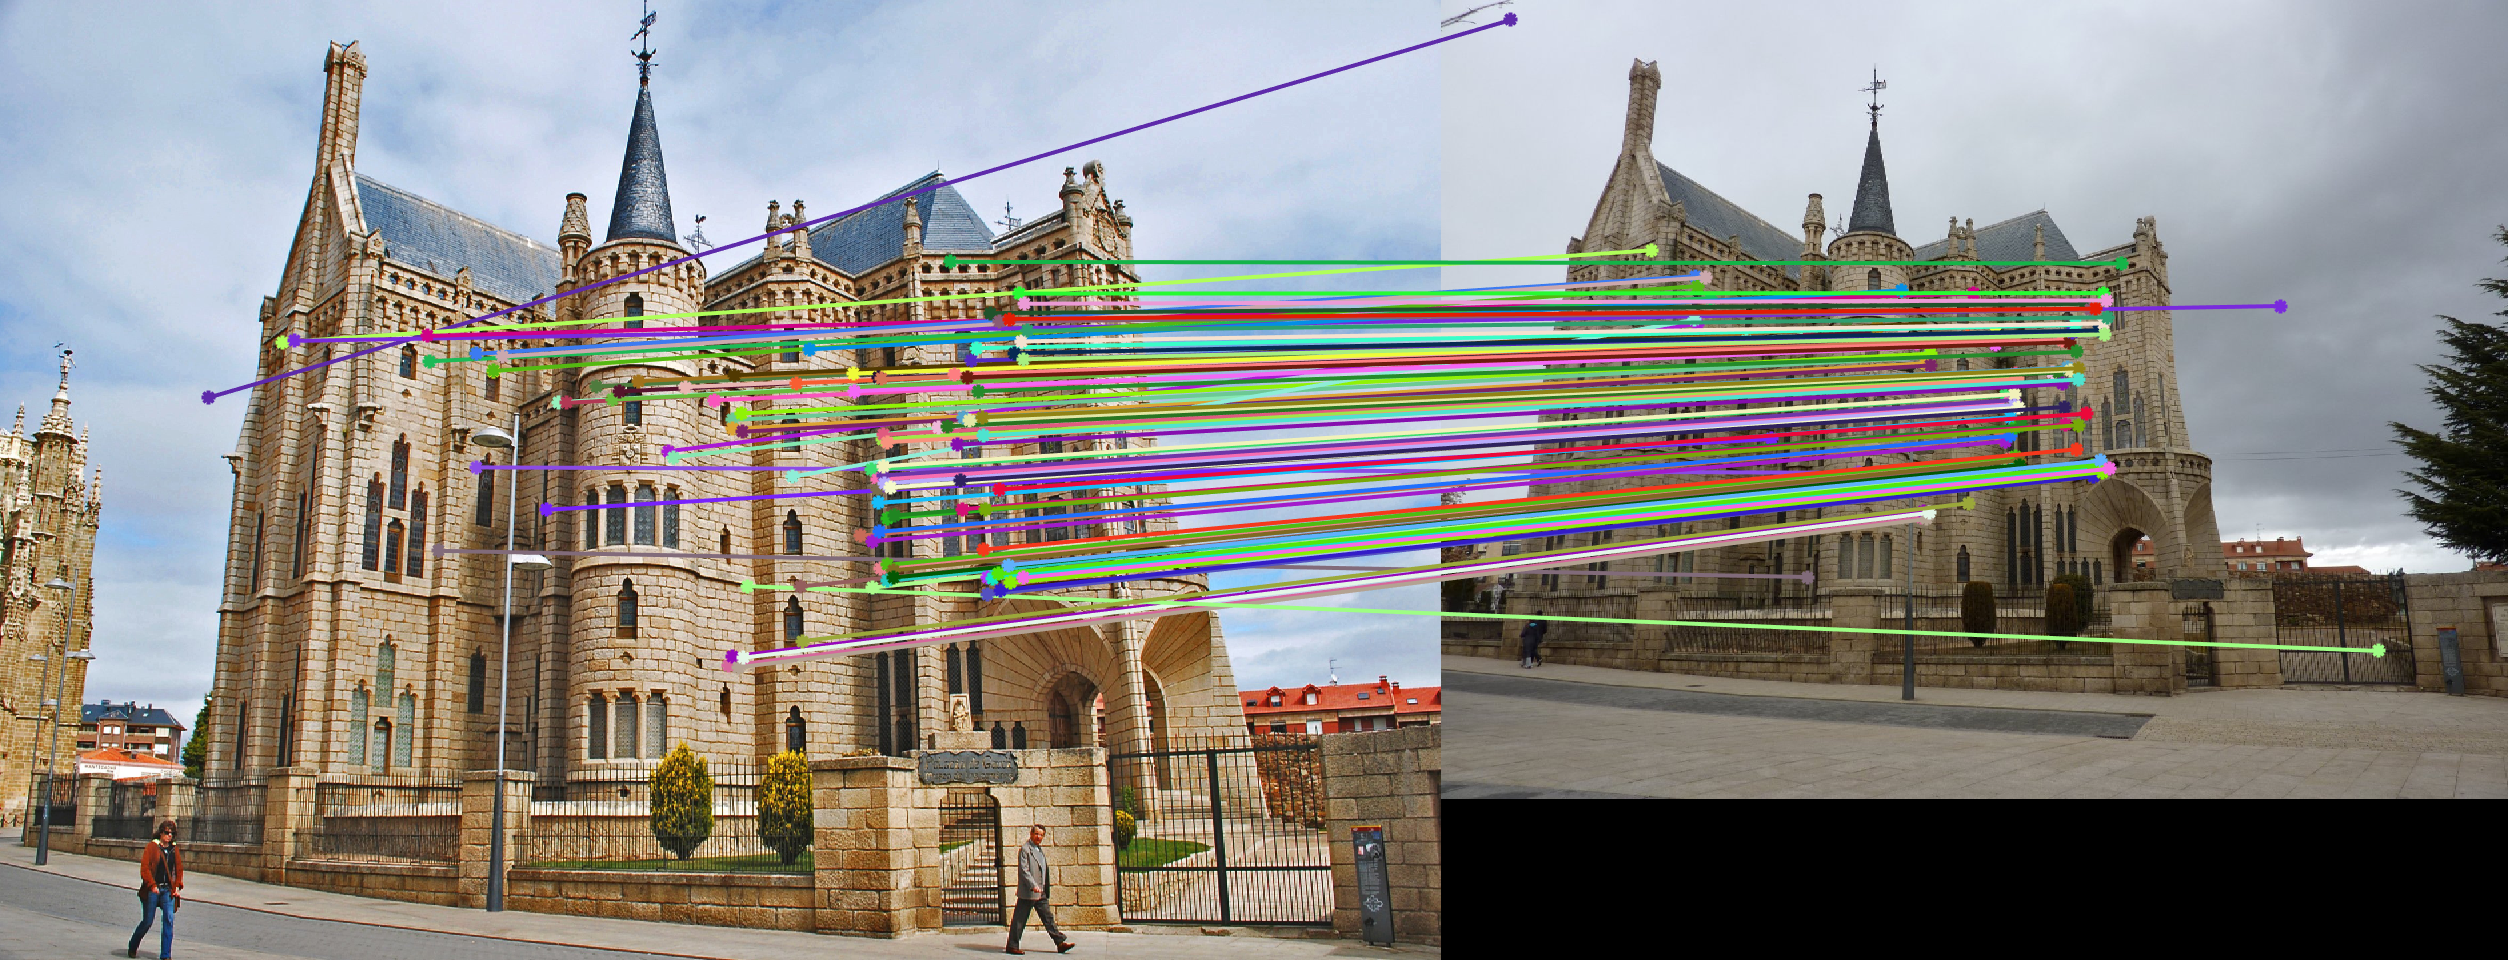
Just for kicks, I set the value of the threshold to a really low value (0.0001) to see if there were any points that would make the cut. I got 8 points that qualified as inliers despite the low threshold. Here they are,
Number of points to use while estimating the fundamental matrix
I used the Ax=0 form of the equation to solve for the fundamental matrix and used SVD to solve the equation. The number of points that I could use had to be a minimum of 8 but could be more than that. In general, using lesser points was faster as it is easy to calculate the SVD for a matrix with smaller dimensions. I did observe that during this project, however, the toal execution time was still less than 30 seconds (for upto 20 points) so it did not affect the running time by a lot. using more points required more iterations of RANSAC for same accuracy The number of runs of the algorithm was important. If it was too less, we might've not explored too many sets to give the best fundamental matrix estimation. If it was too much, we were needlessly exploring (wasted effort).
However, the upside of using more points to calculate the equation was that the epipolar lines tended to be spread out more if I used more points. For 8 points, they were mainly focused in one region but for 20 points, they were spread out. I think this is beacuse with more points, the matrix is is more likely to be more robust to localized maxima (as far as optimality of the fundamental matrix is concerned), therefore gives a larger spread.
The downside of using more points is that we need to run RANSAC for more number of iterations to get the same probability of success (which corresponds to accuracy). For 20 points, I had to run RANSAC for 15000 iterations to consistently get a comparable accuracy.
Scaling factor
I tried two different scaling factors, 1 and √2. On the Rushmore image pair, the results were similar. However, on the Gaudi image pair, a scaling factor of 1 was performing better than a scaling factor of √2. The difference in the number of correctly matched features was not much, however, given the epipolar contraints and the benfeits that grants to accuracy it was not a negligible change.
Scaling factor of 1
Scaling factor of √2
Normalization
Mount Rushmore with normalization
Mount Rushmore without normalization
Clearly, normalization is better.
Notre Dame
We first run our algorithm on the following Notre Dame pair of images.
When we run the SIFT implementation, we get the following pairs of correspondances,
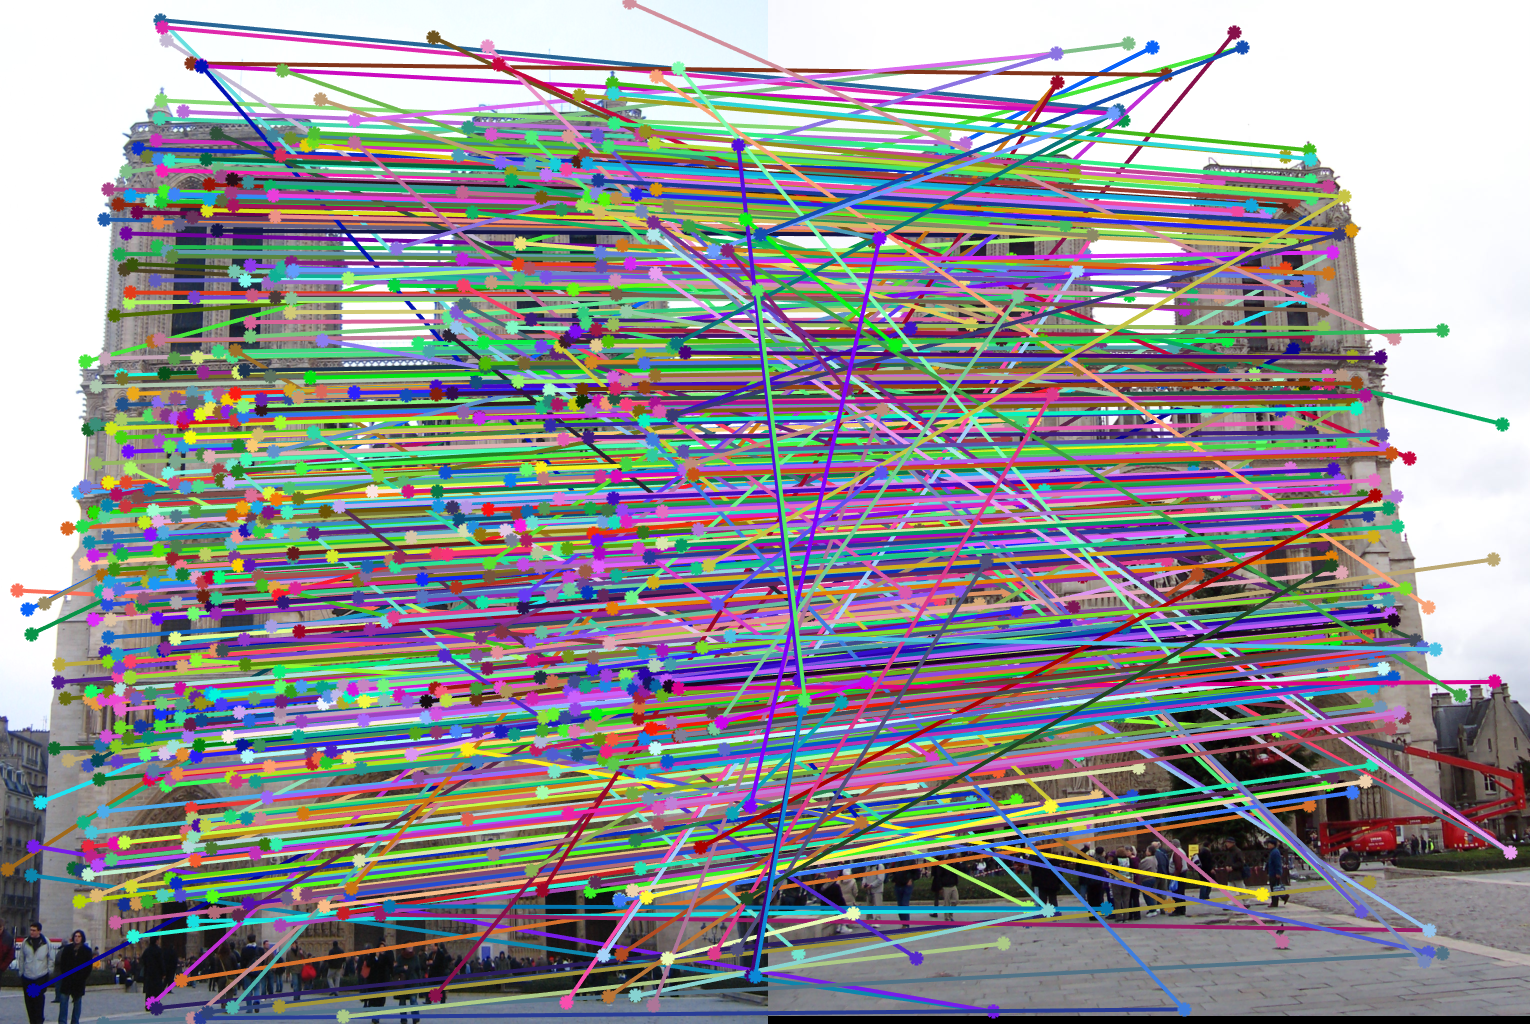
As we can see, there are a lot of matches between the two images. Last time, we used Nearest Neighbour method to find the best 100 matches. This time, we will use the top 100 inliers based on the Fundamental Matrix equation descirbed above.
We estimate the fundamental matrix using RANSAC and we get the epipolar lines as shown below.
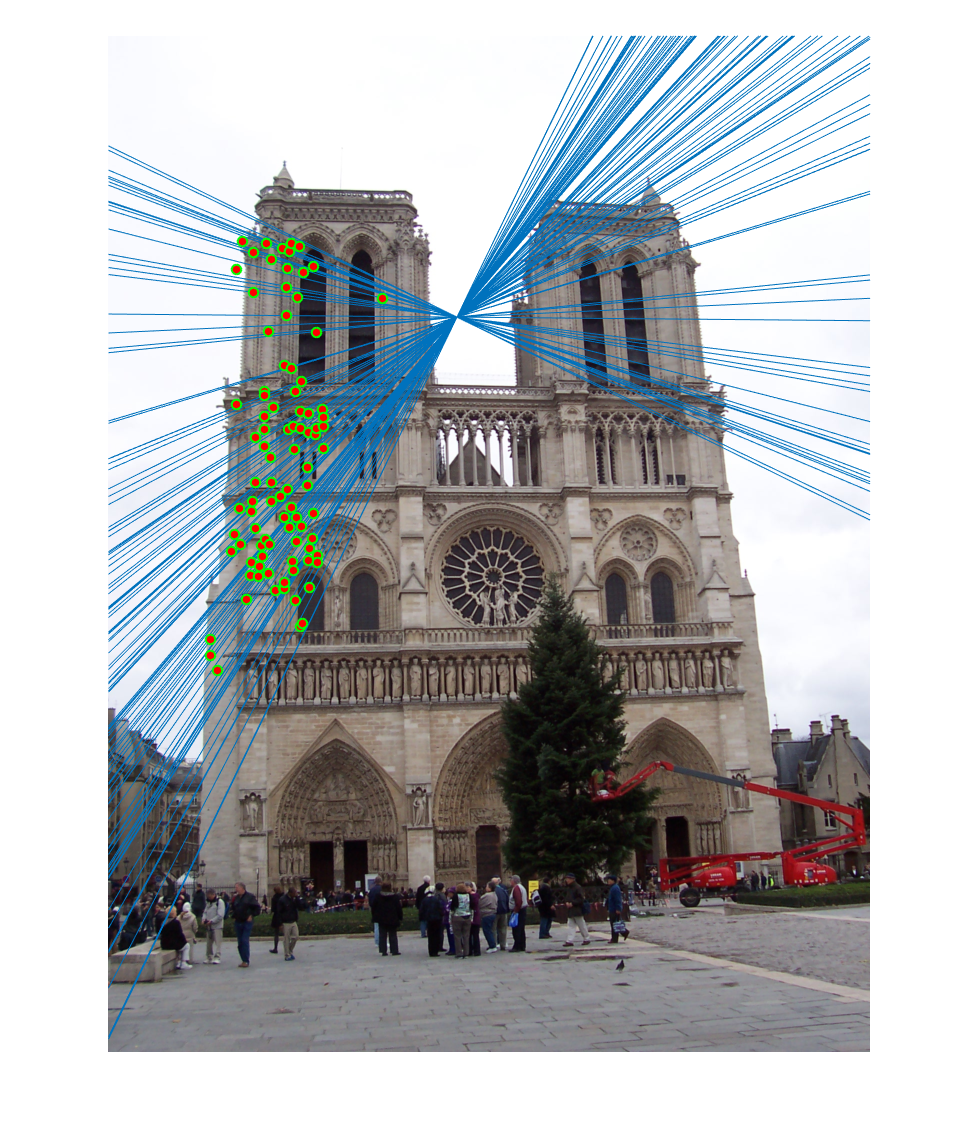
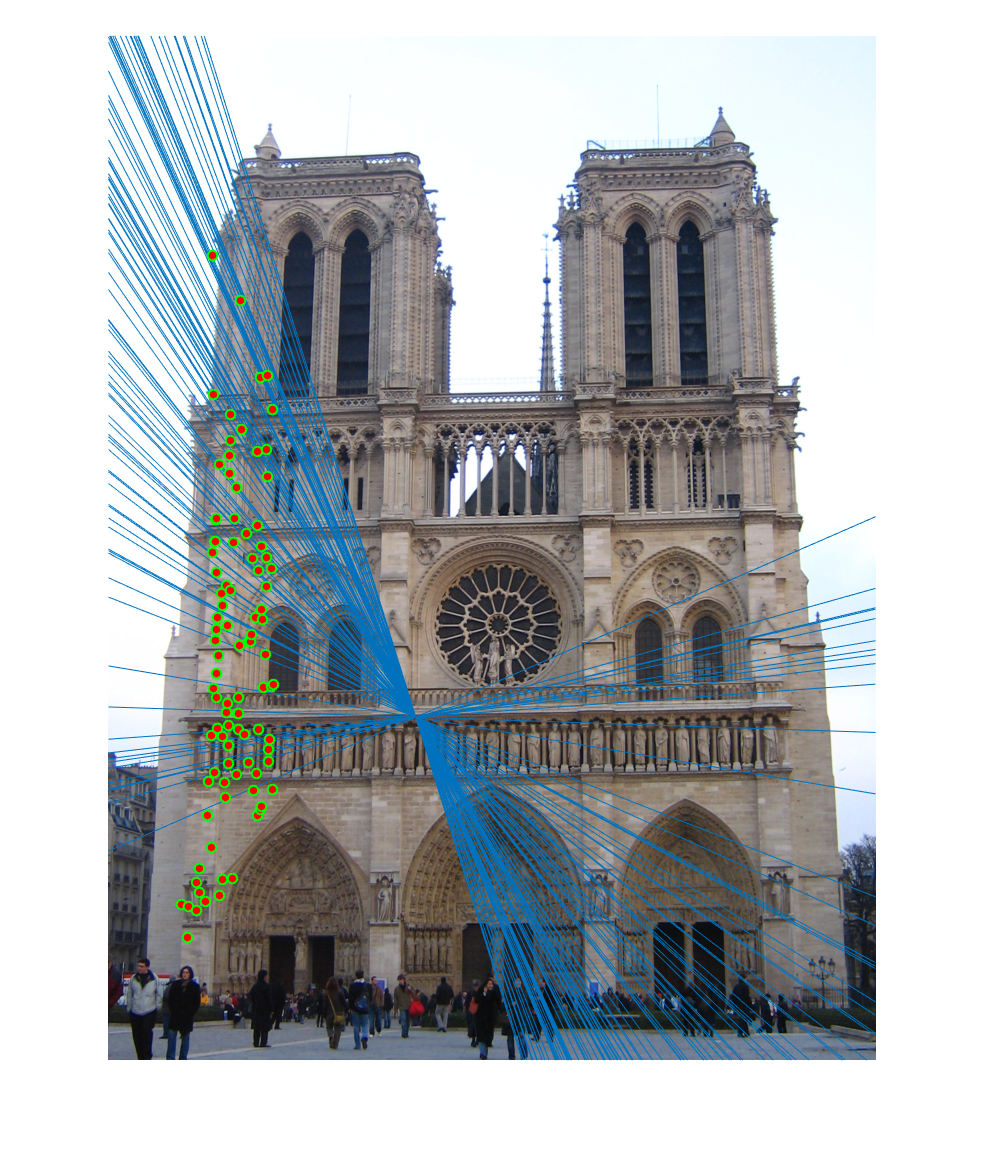
The correspondances that we get using the epipolar lines to search for the points in the other image are as follows,
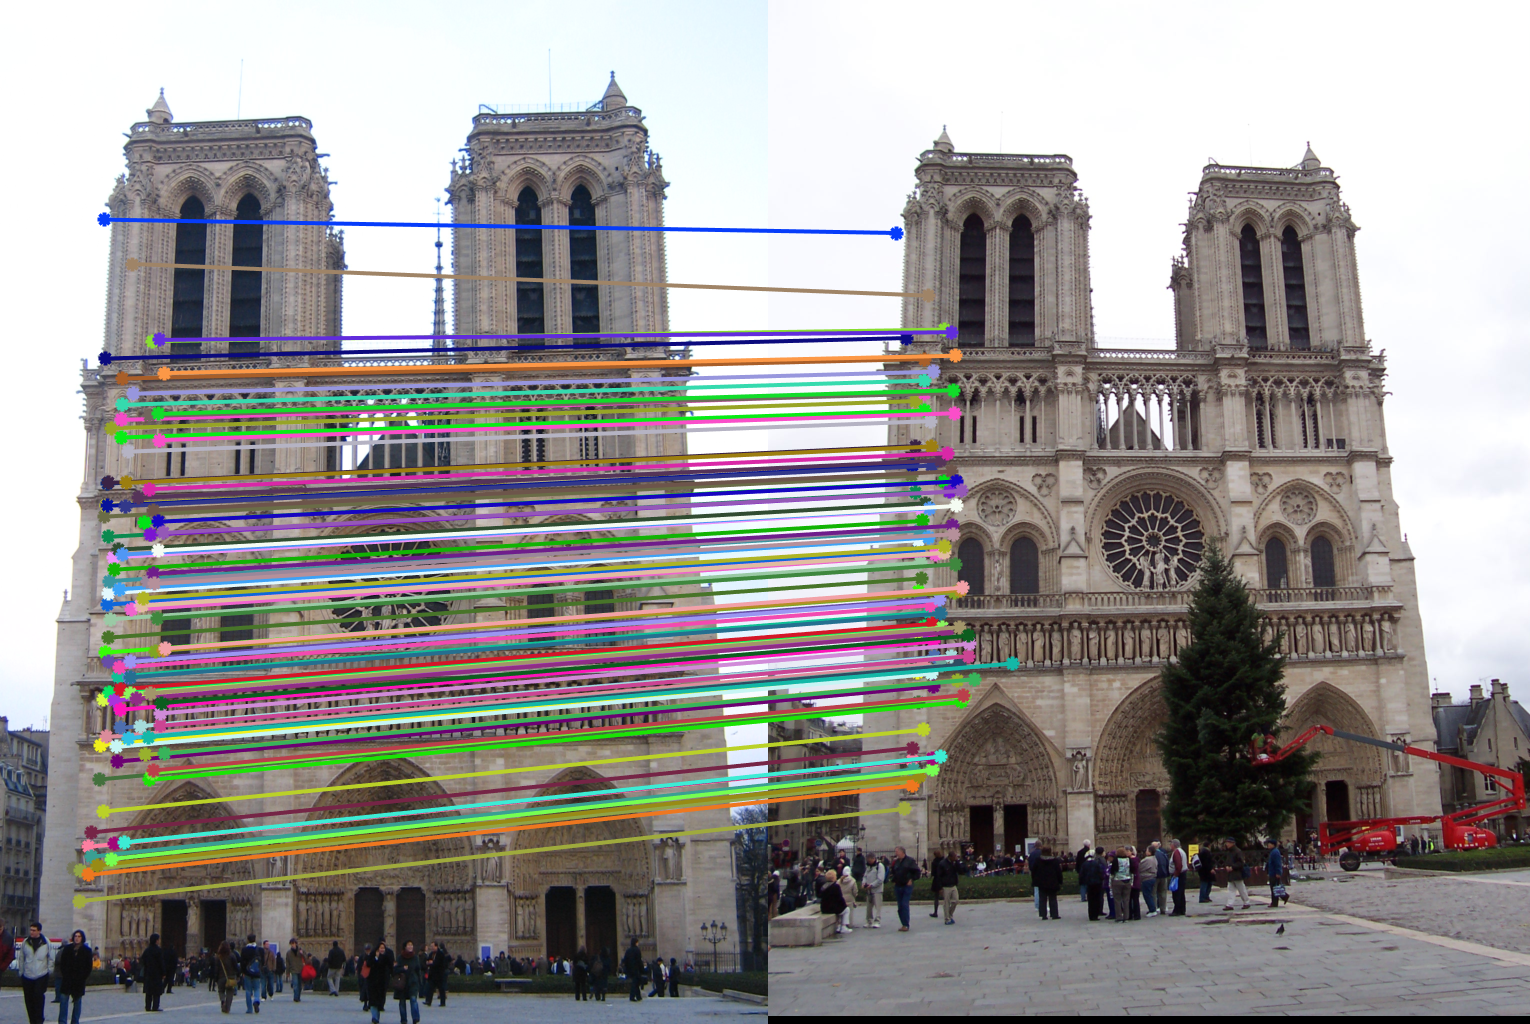
We can see that the correspondances are very accurate between the two images. I got an accuracy of around 82% on the Notre Dame pair using the SIFT-Nearest Neighbour approach in the previous project. It is a very good improvment over that algorithm. The epipolar lines restrict our search vastly and the results very clearly benefit from that.
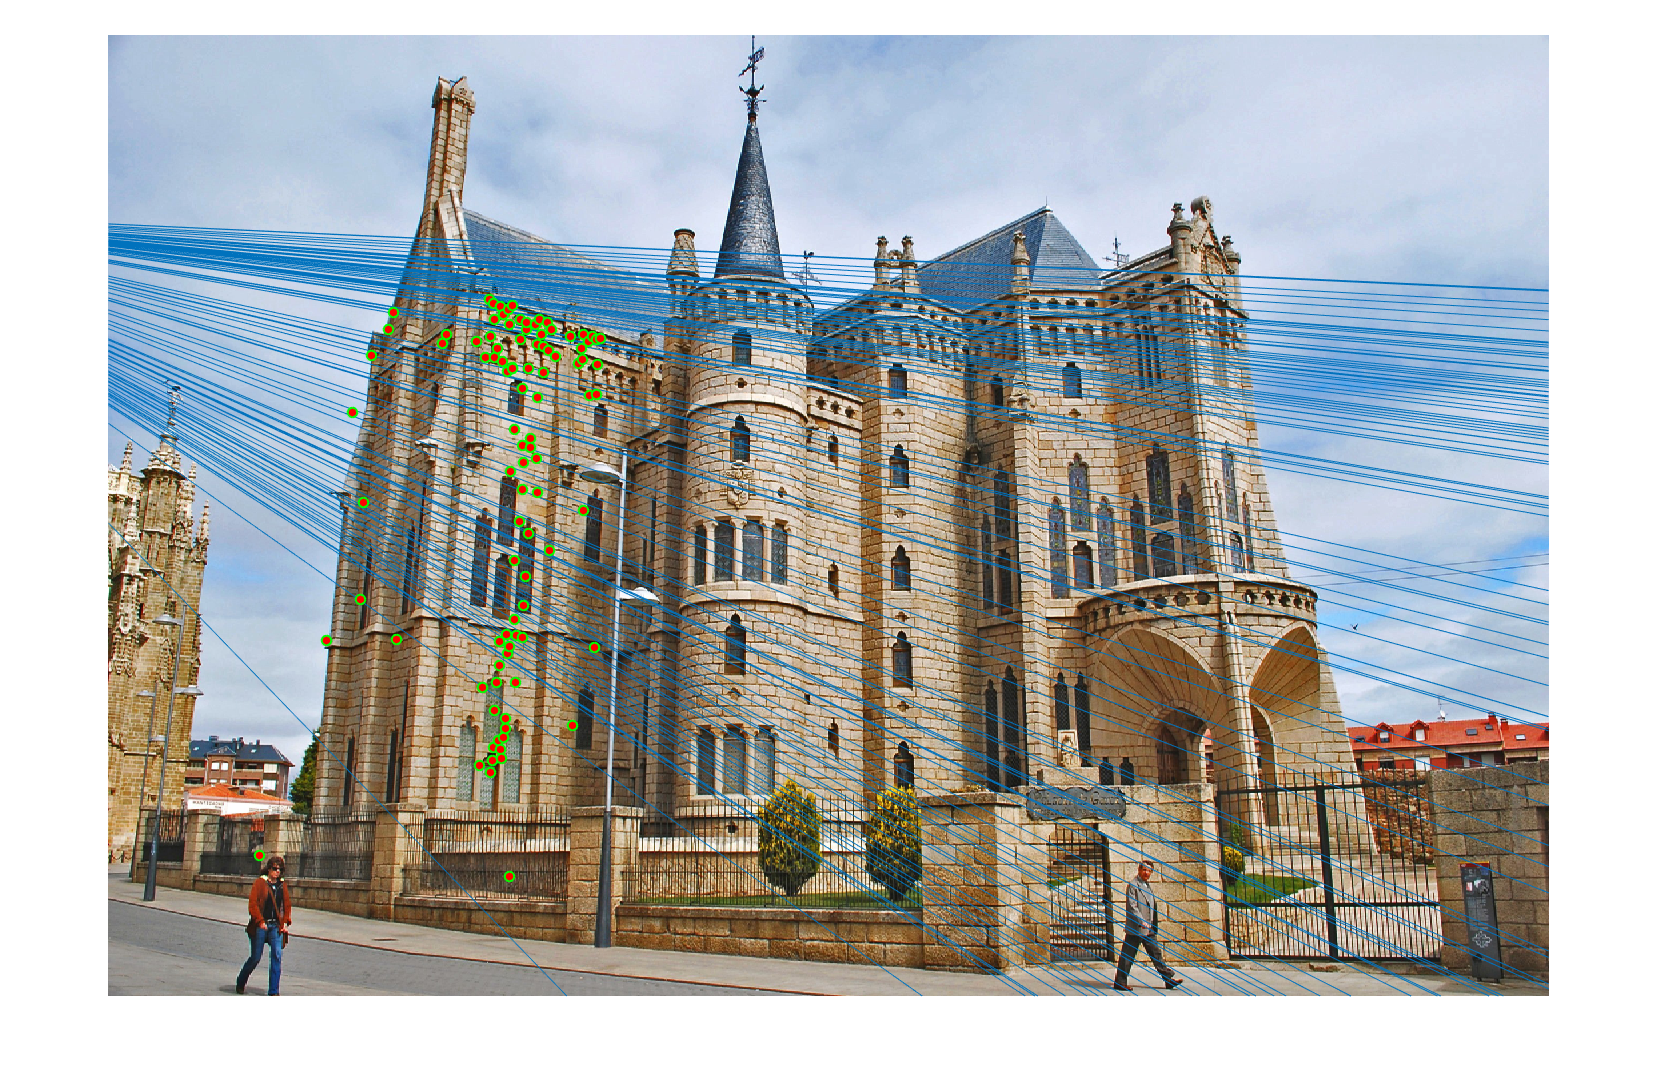
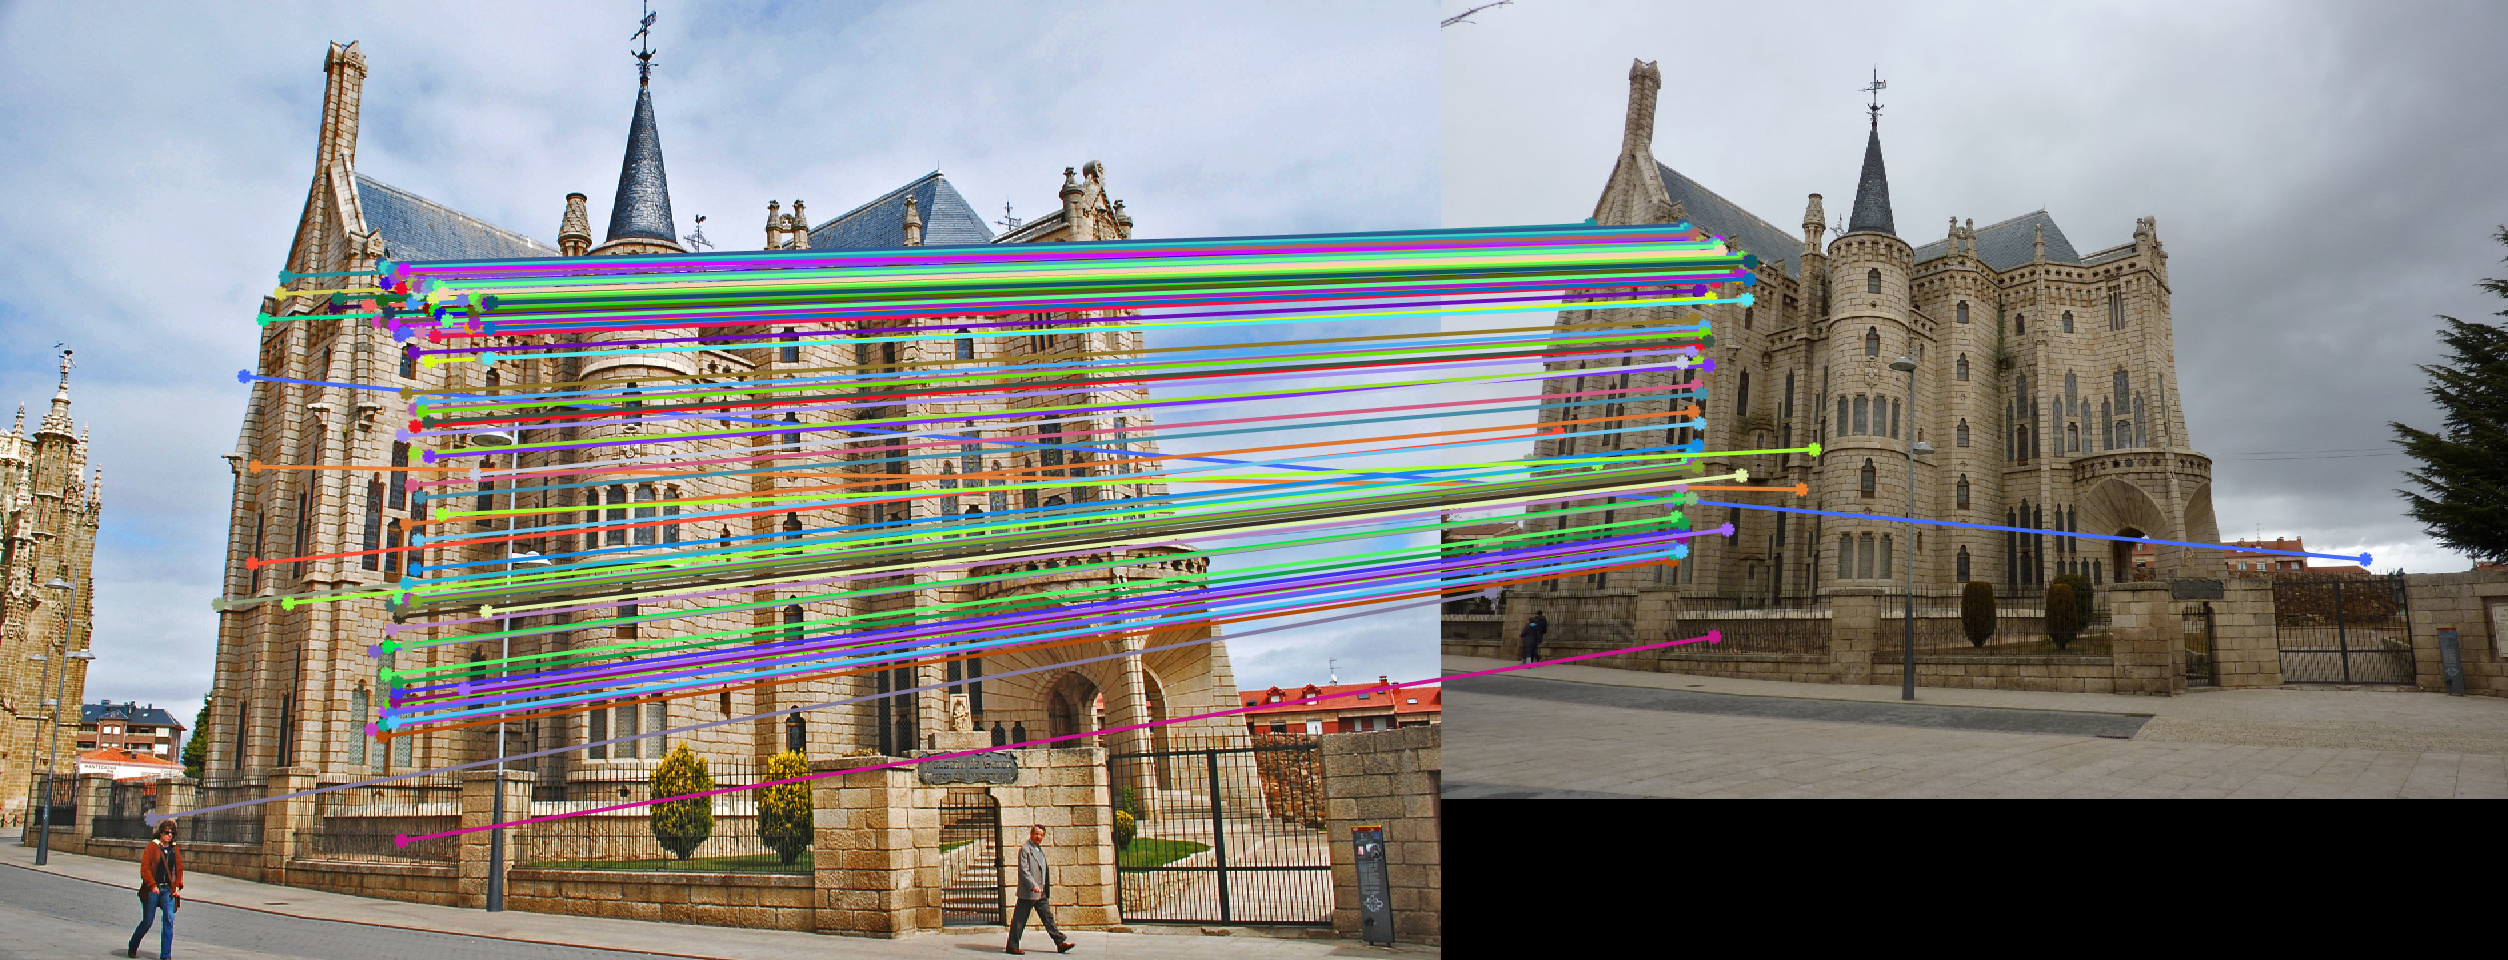
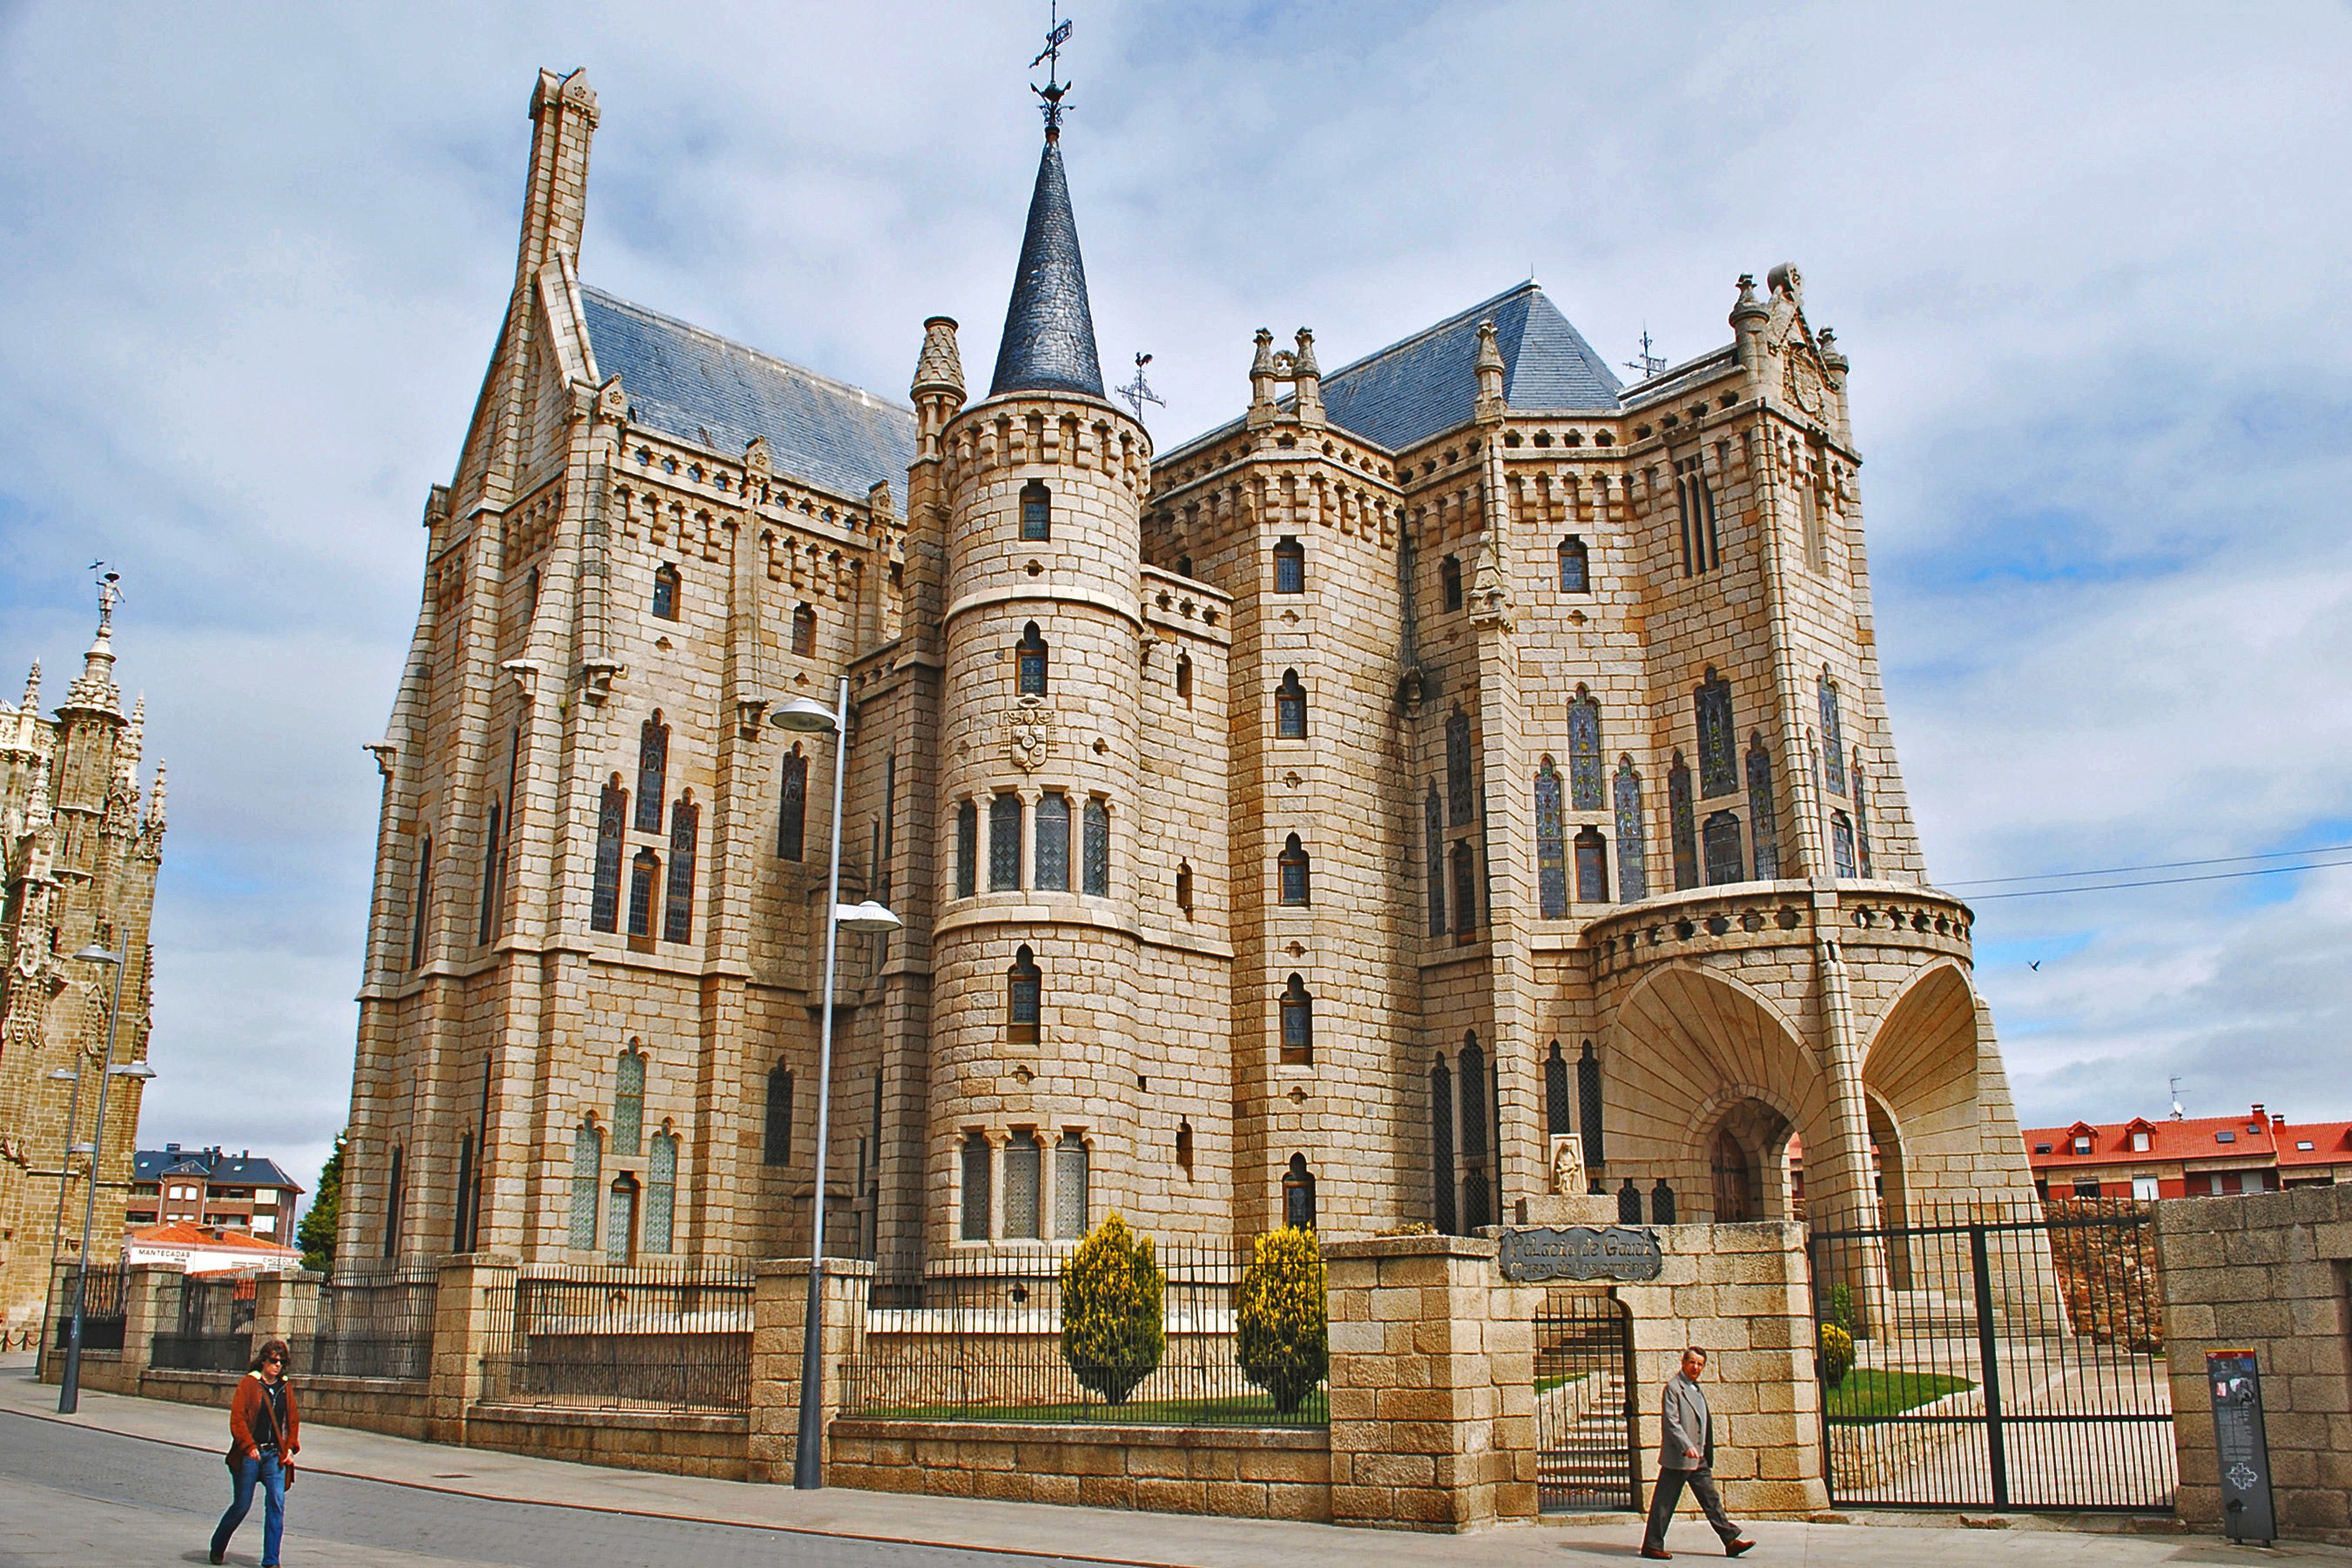
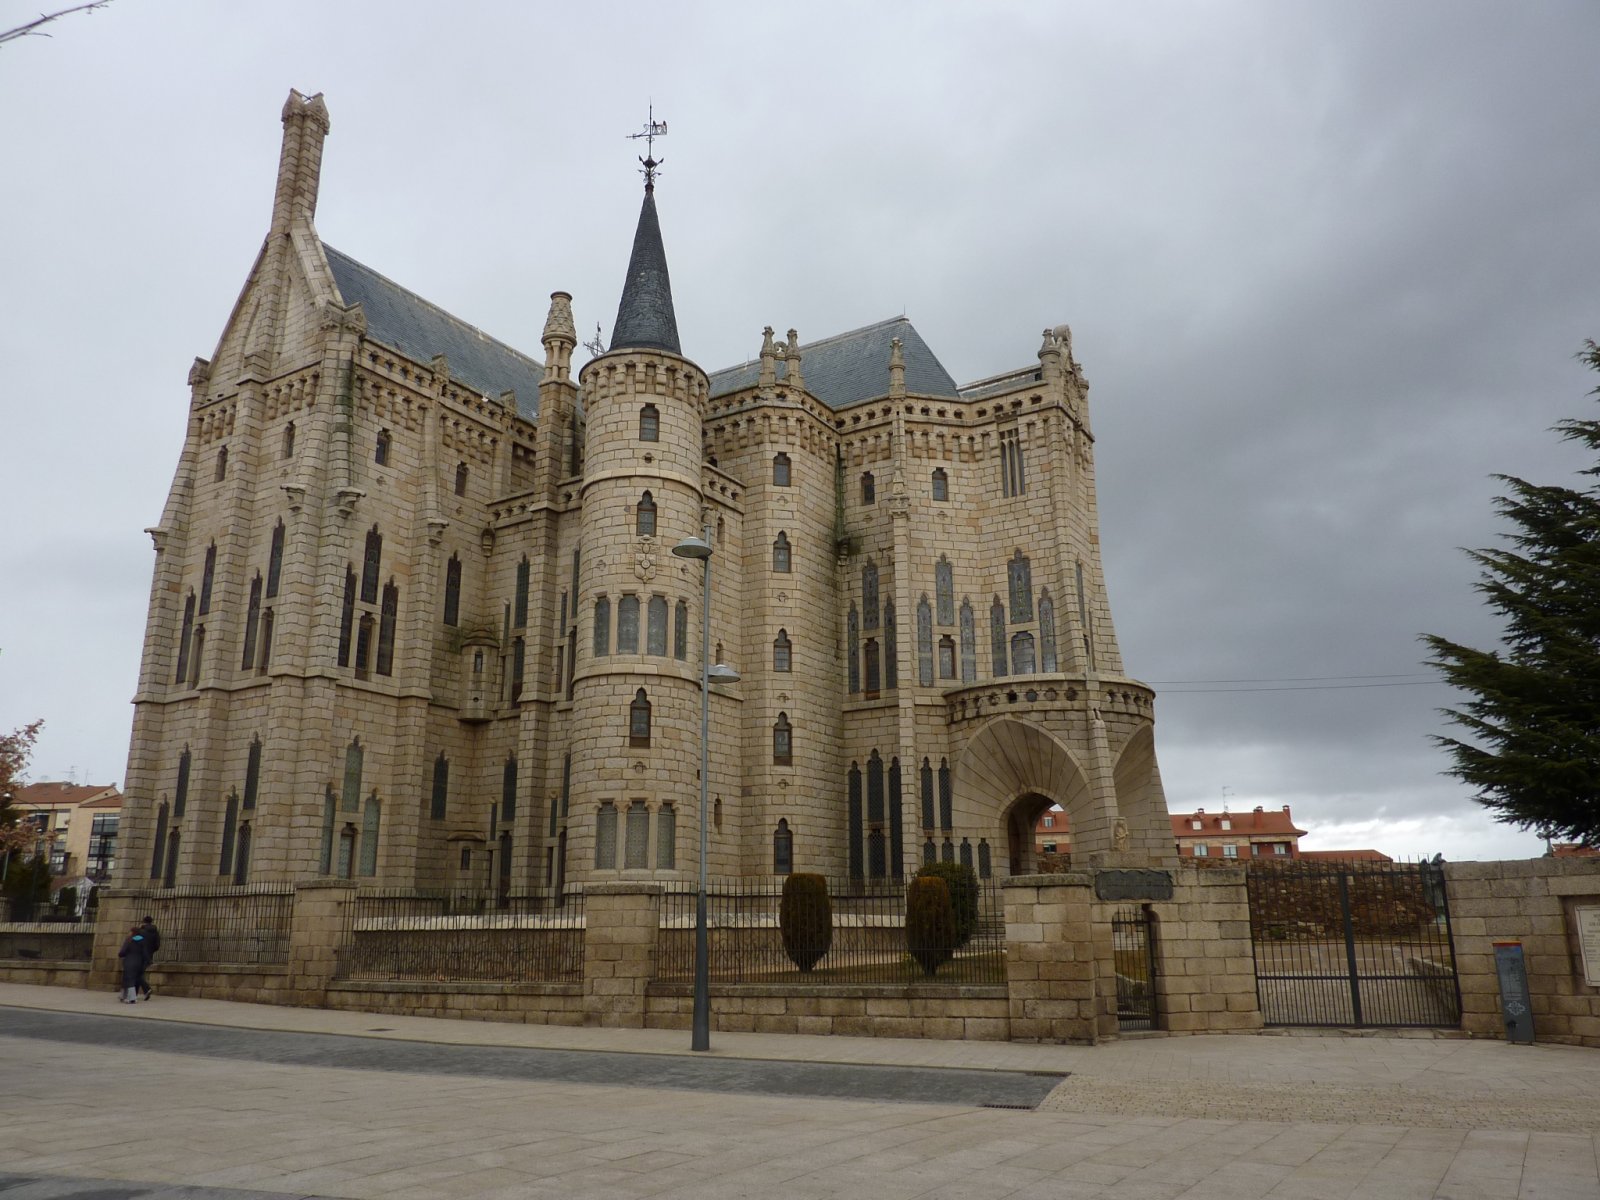
Episcopal Gaudi
We first run our algorithm on the following Episcopal Gaudi pair of images.
When we run the SIFT implementation, we get the following pairs of correspondances,
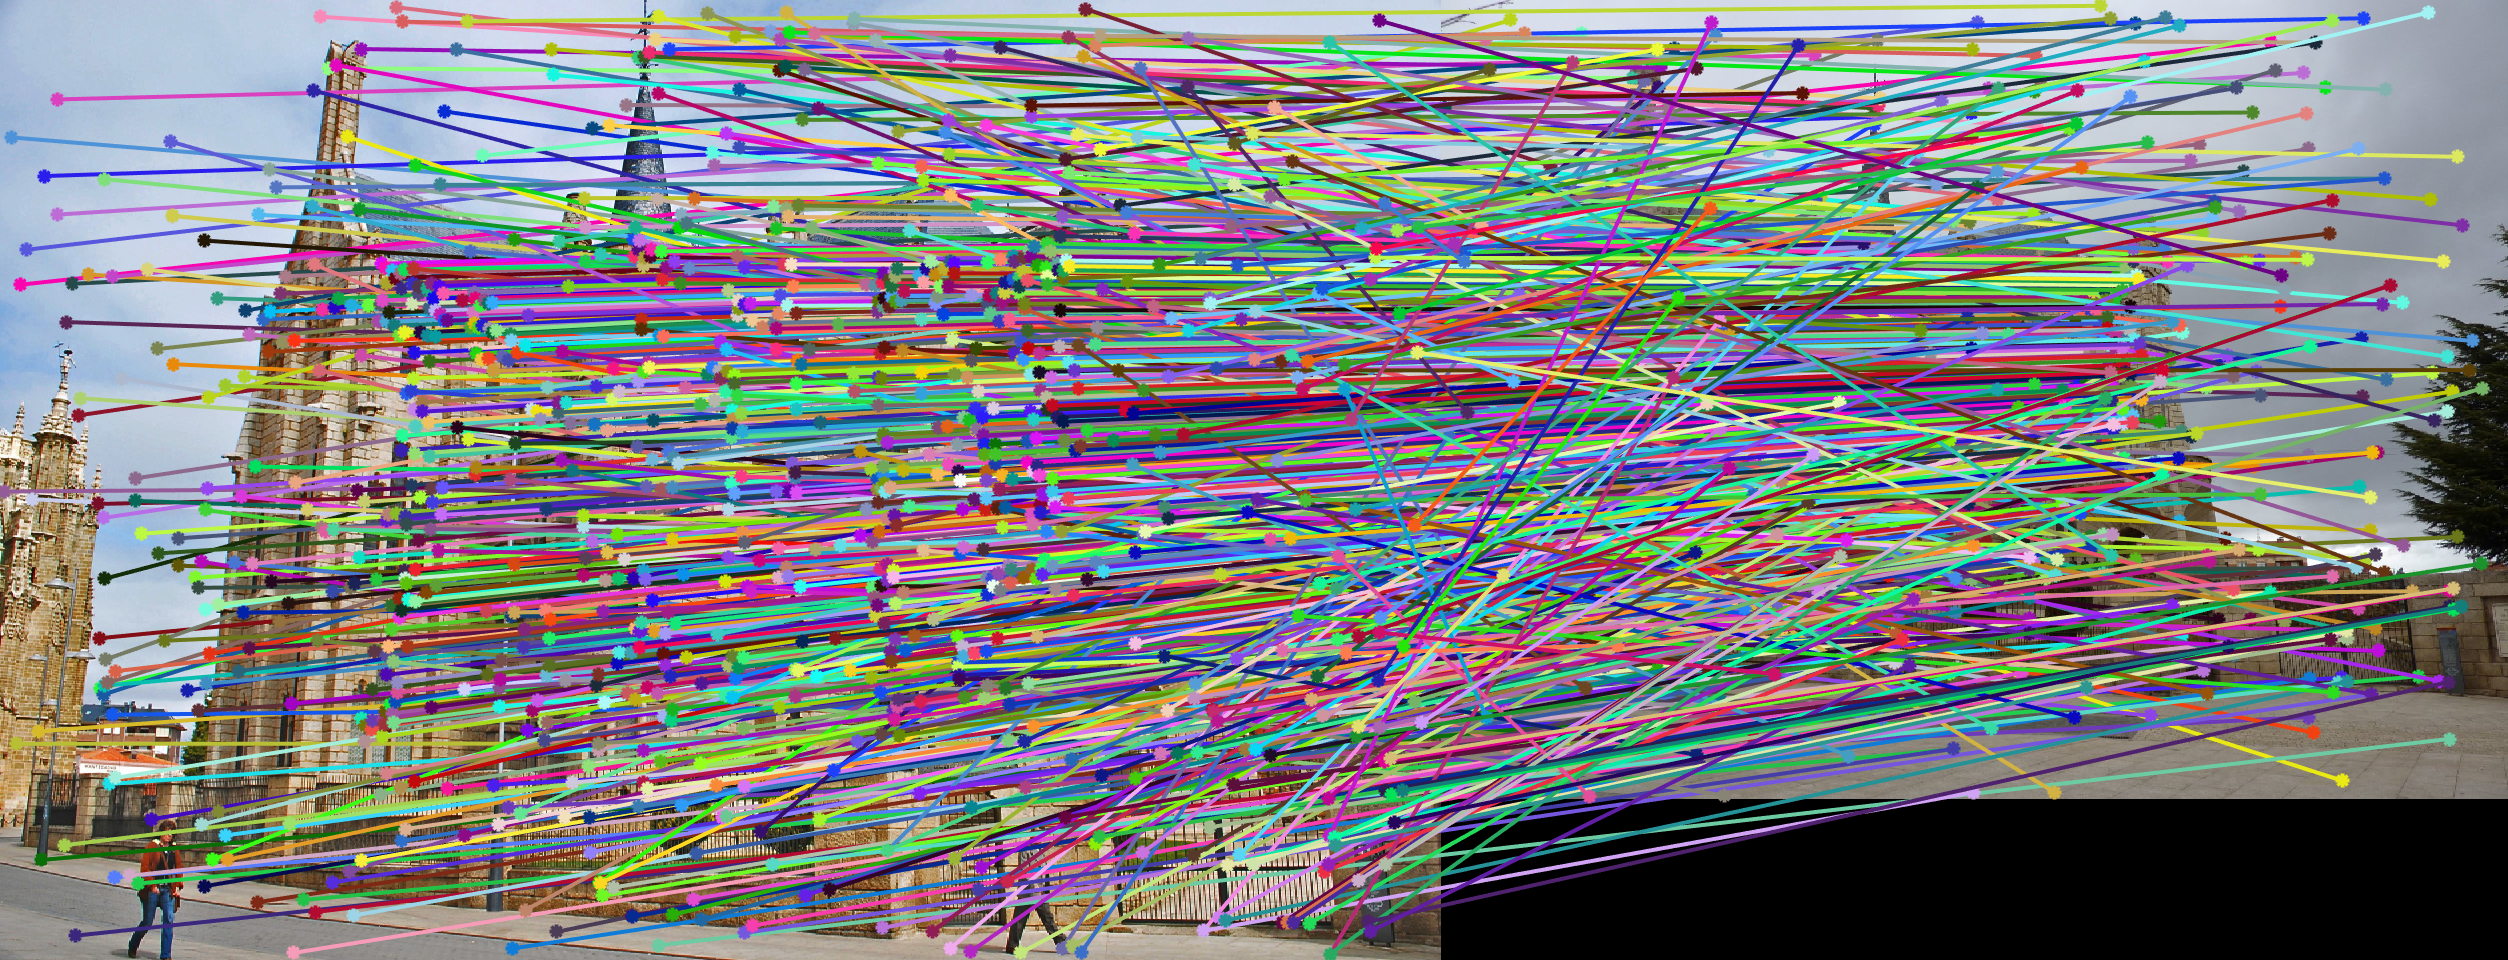
As we can see, there are a lot of matches between the two images. Last time, we used Nearest Neighbour method to find the best 100 matches. This time, we will use the top 100 inliers based on the Fundamental Matrix equation descirbed above.
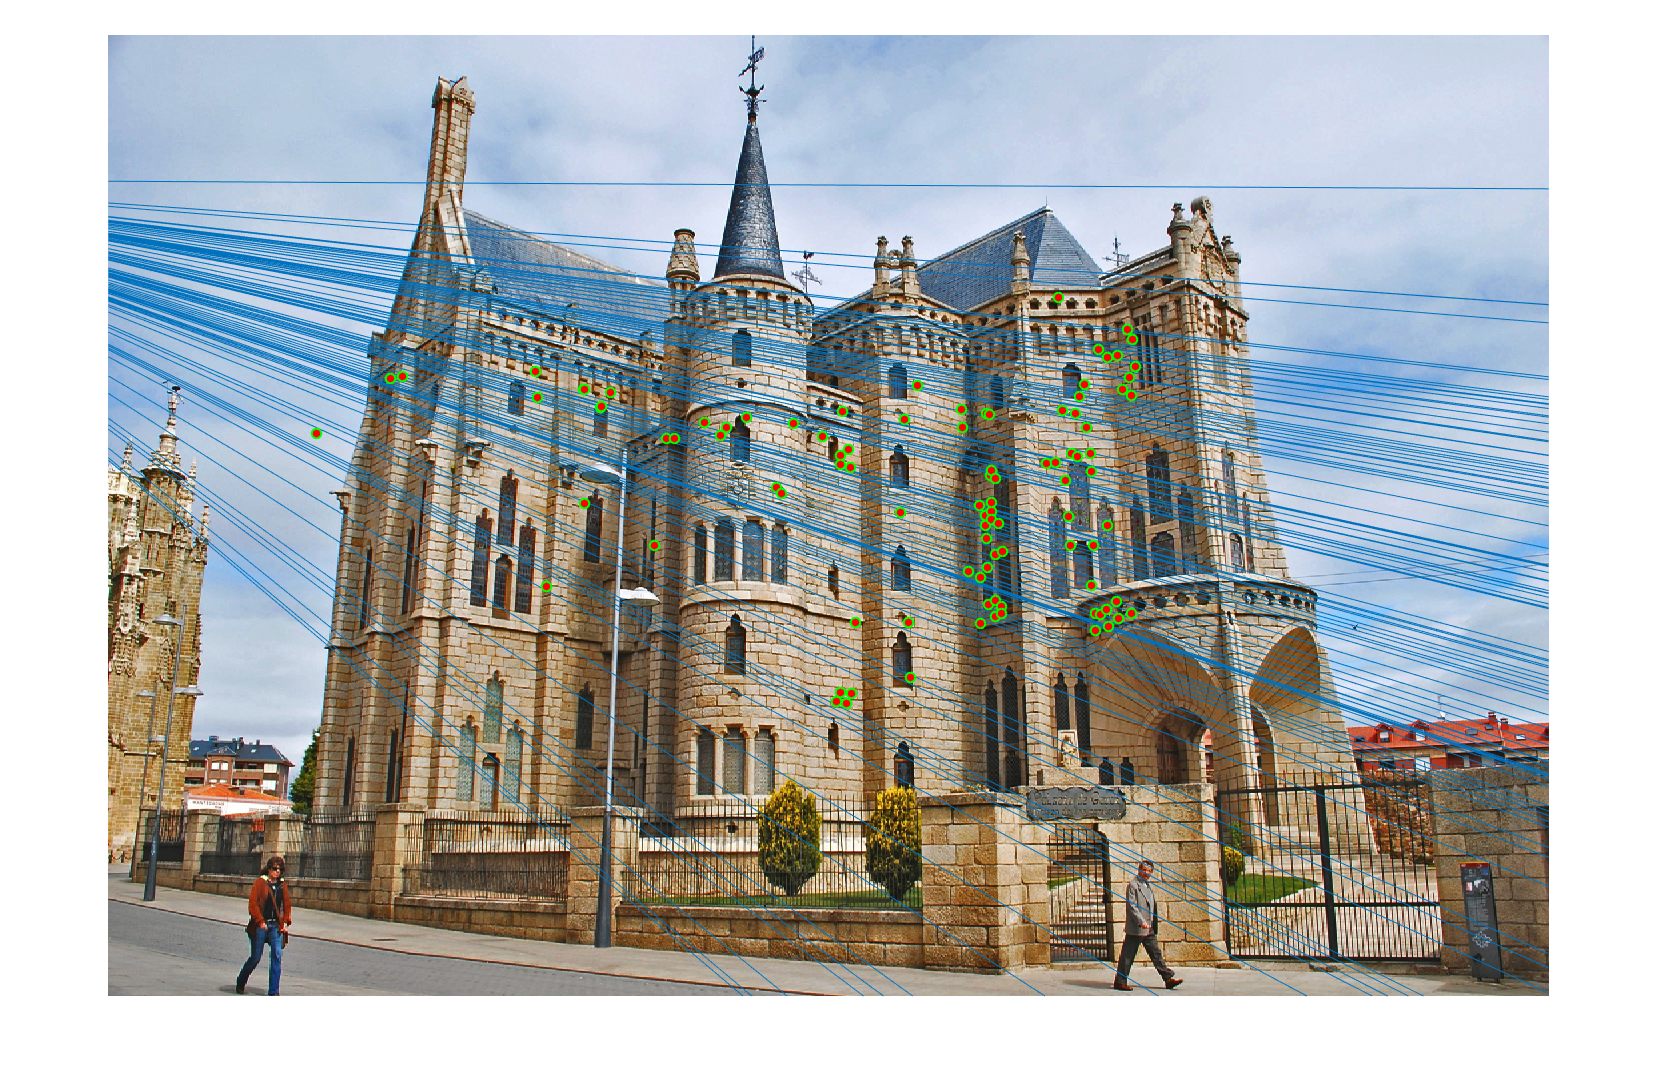
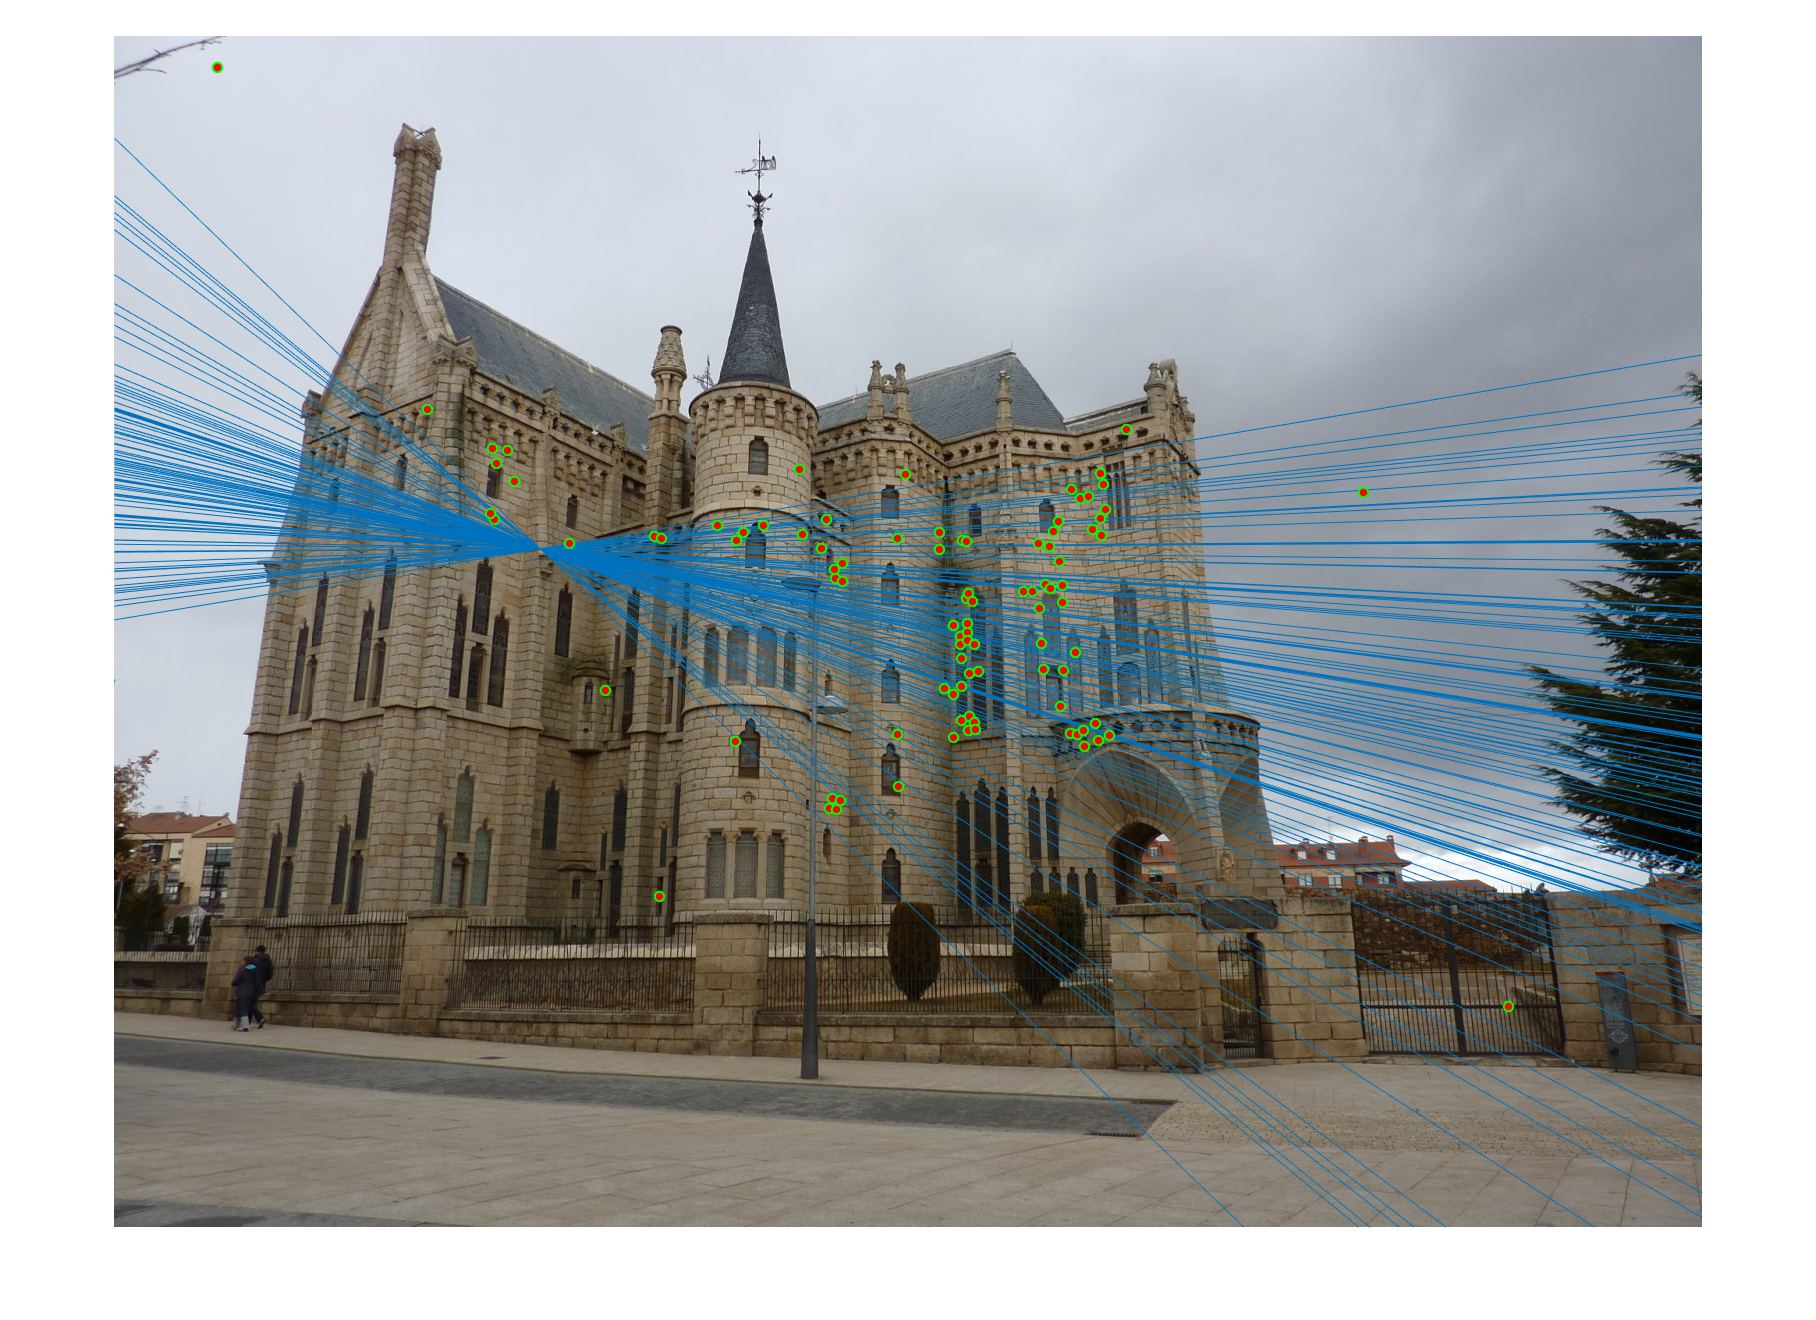
We estimate the fundamental matrix using RANSAC and we get the epipolar lines as shown below.
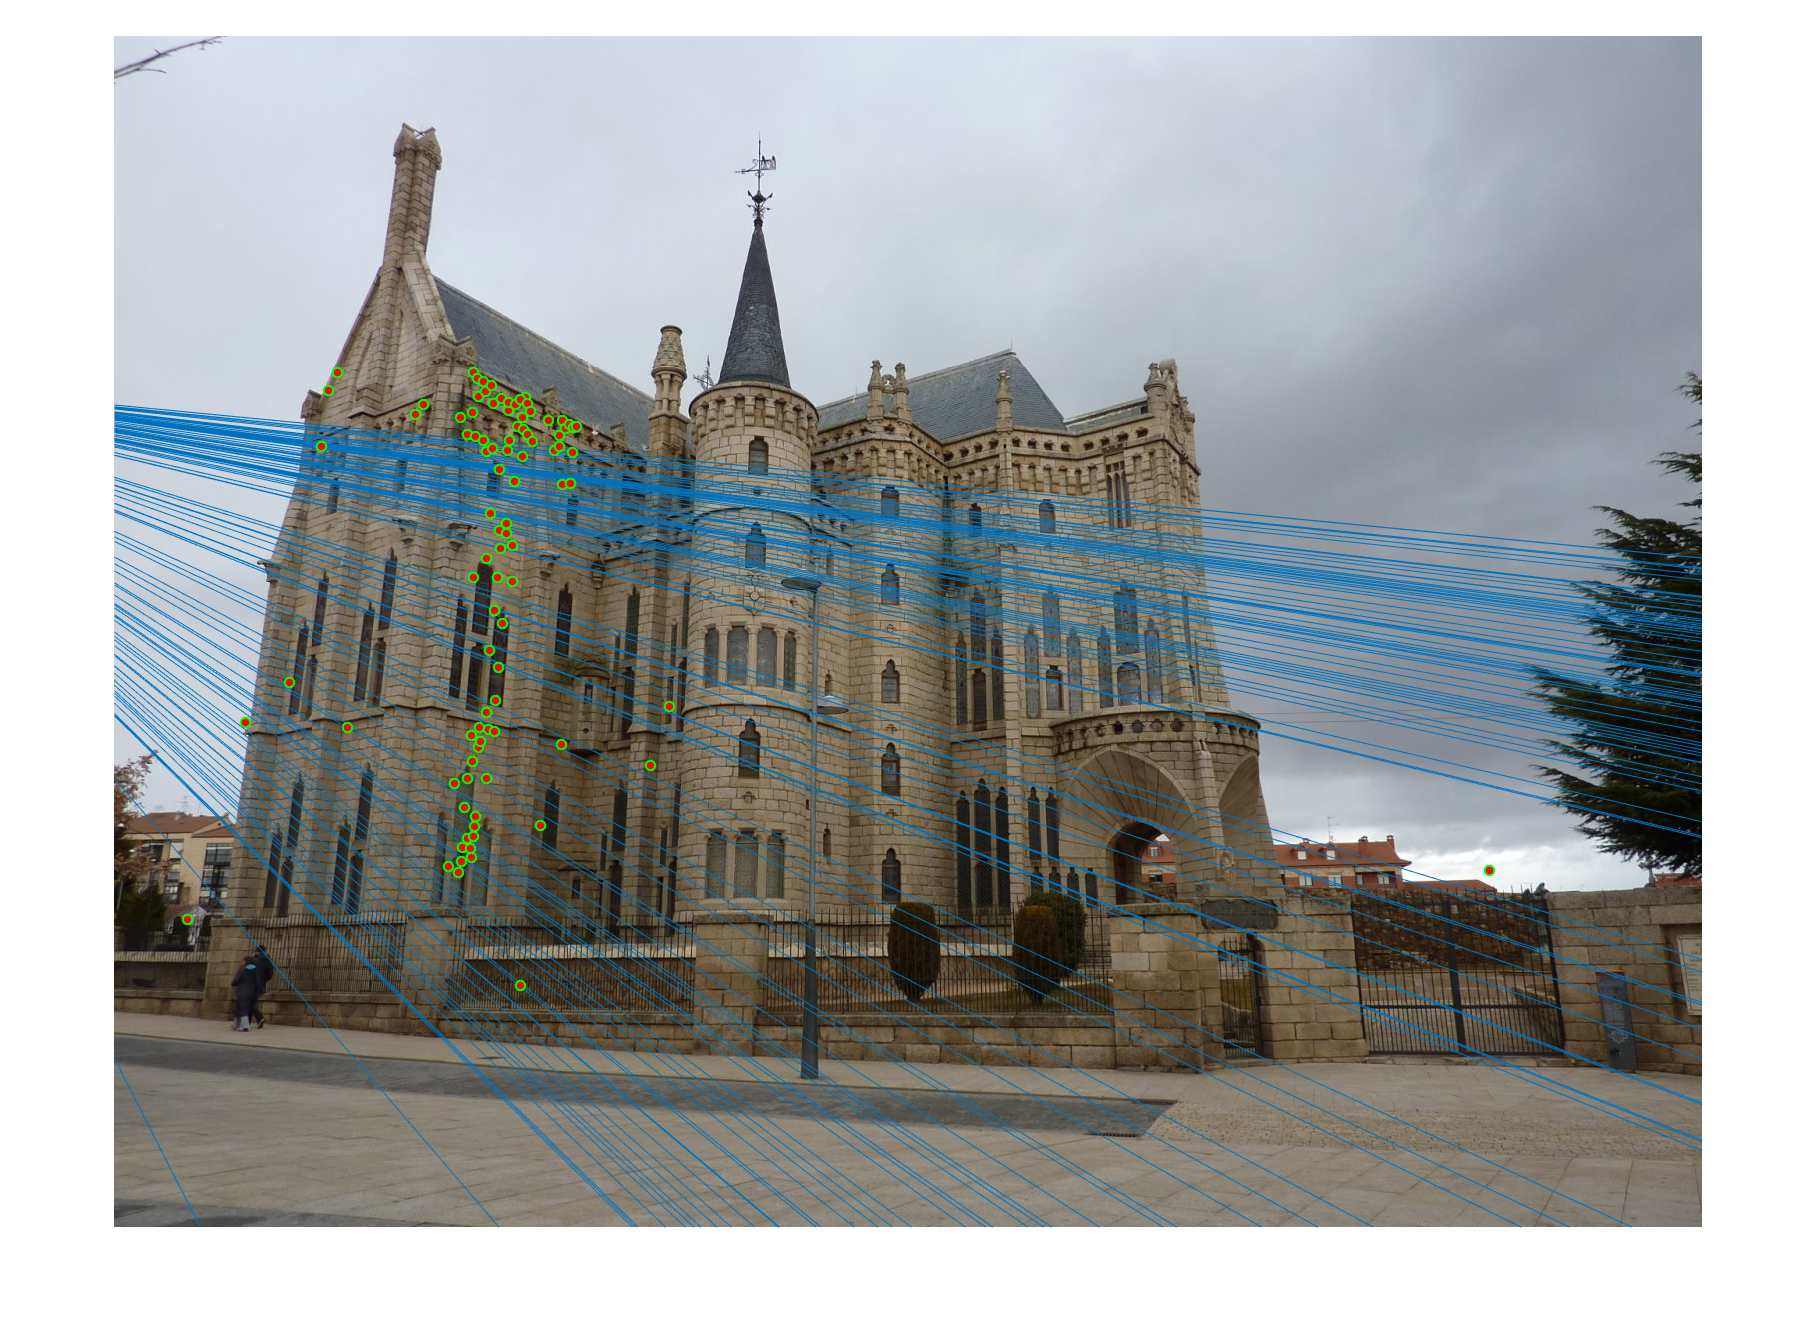
The correspondances that we get using the epipolar lines to search for the points in the other image are as follows,
We can see that the correspondances are very accurate between the two images. I got a poor accuracy on the Episcopal Gaudi pair using the SIFT-Nearest Neighbour approach in the previous project. It is a very good improvment over that algorithm. The epipolar lines restrict our search vastly and the results very clearly benefit from that.
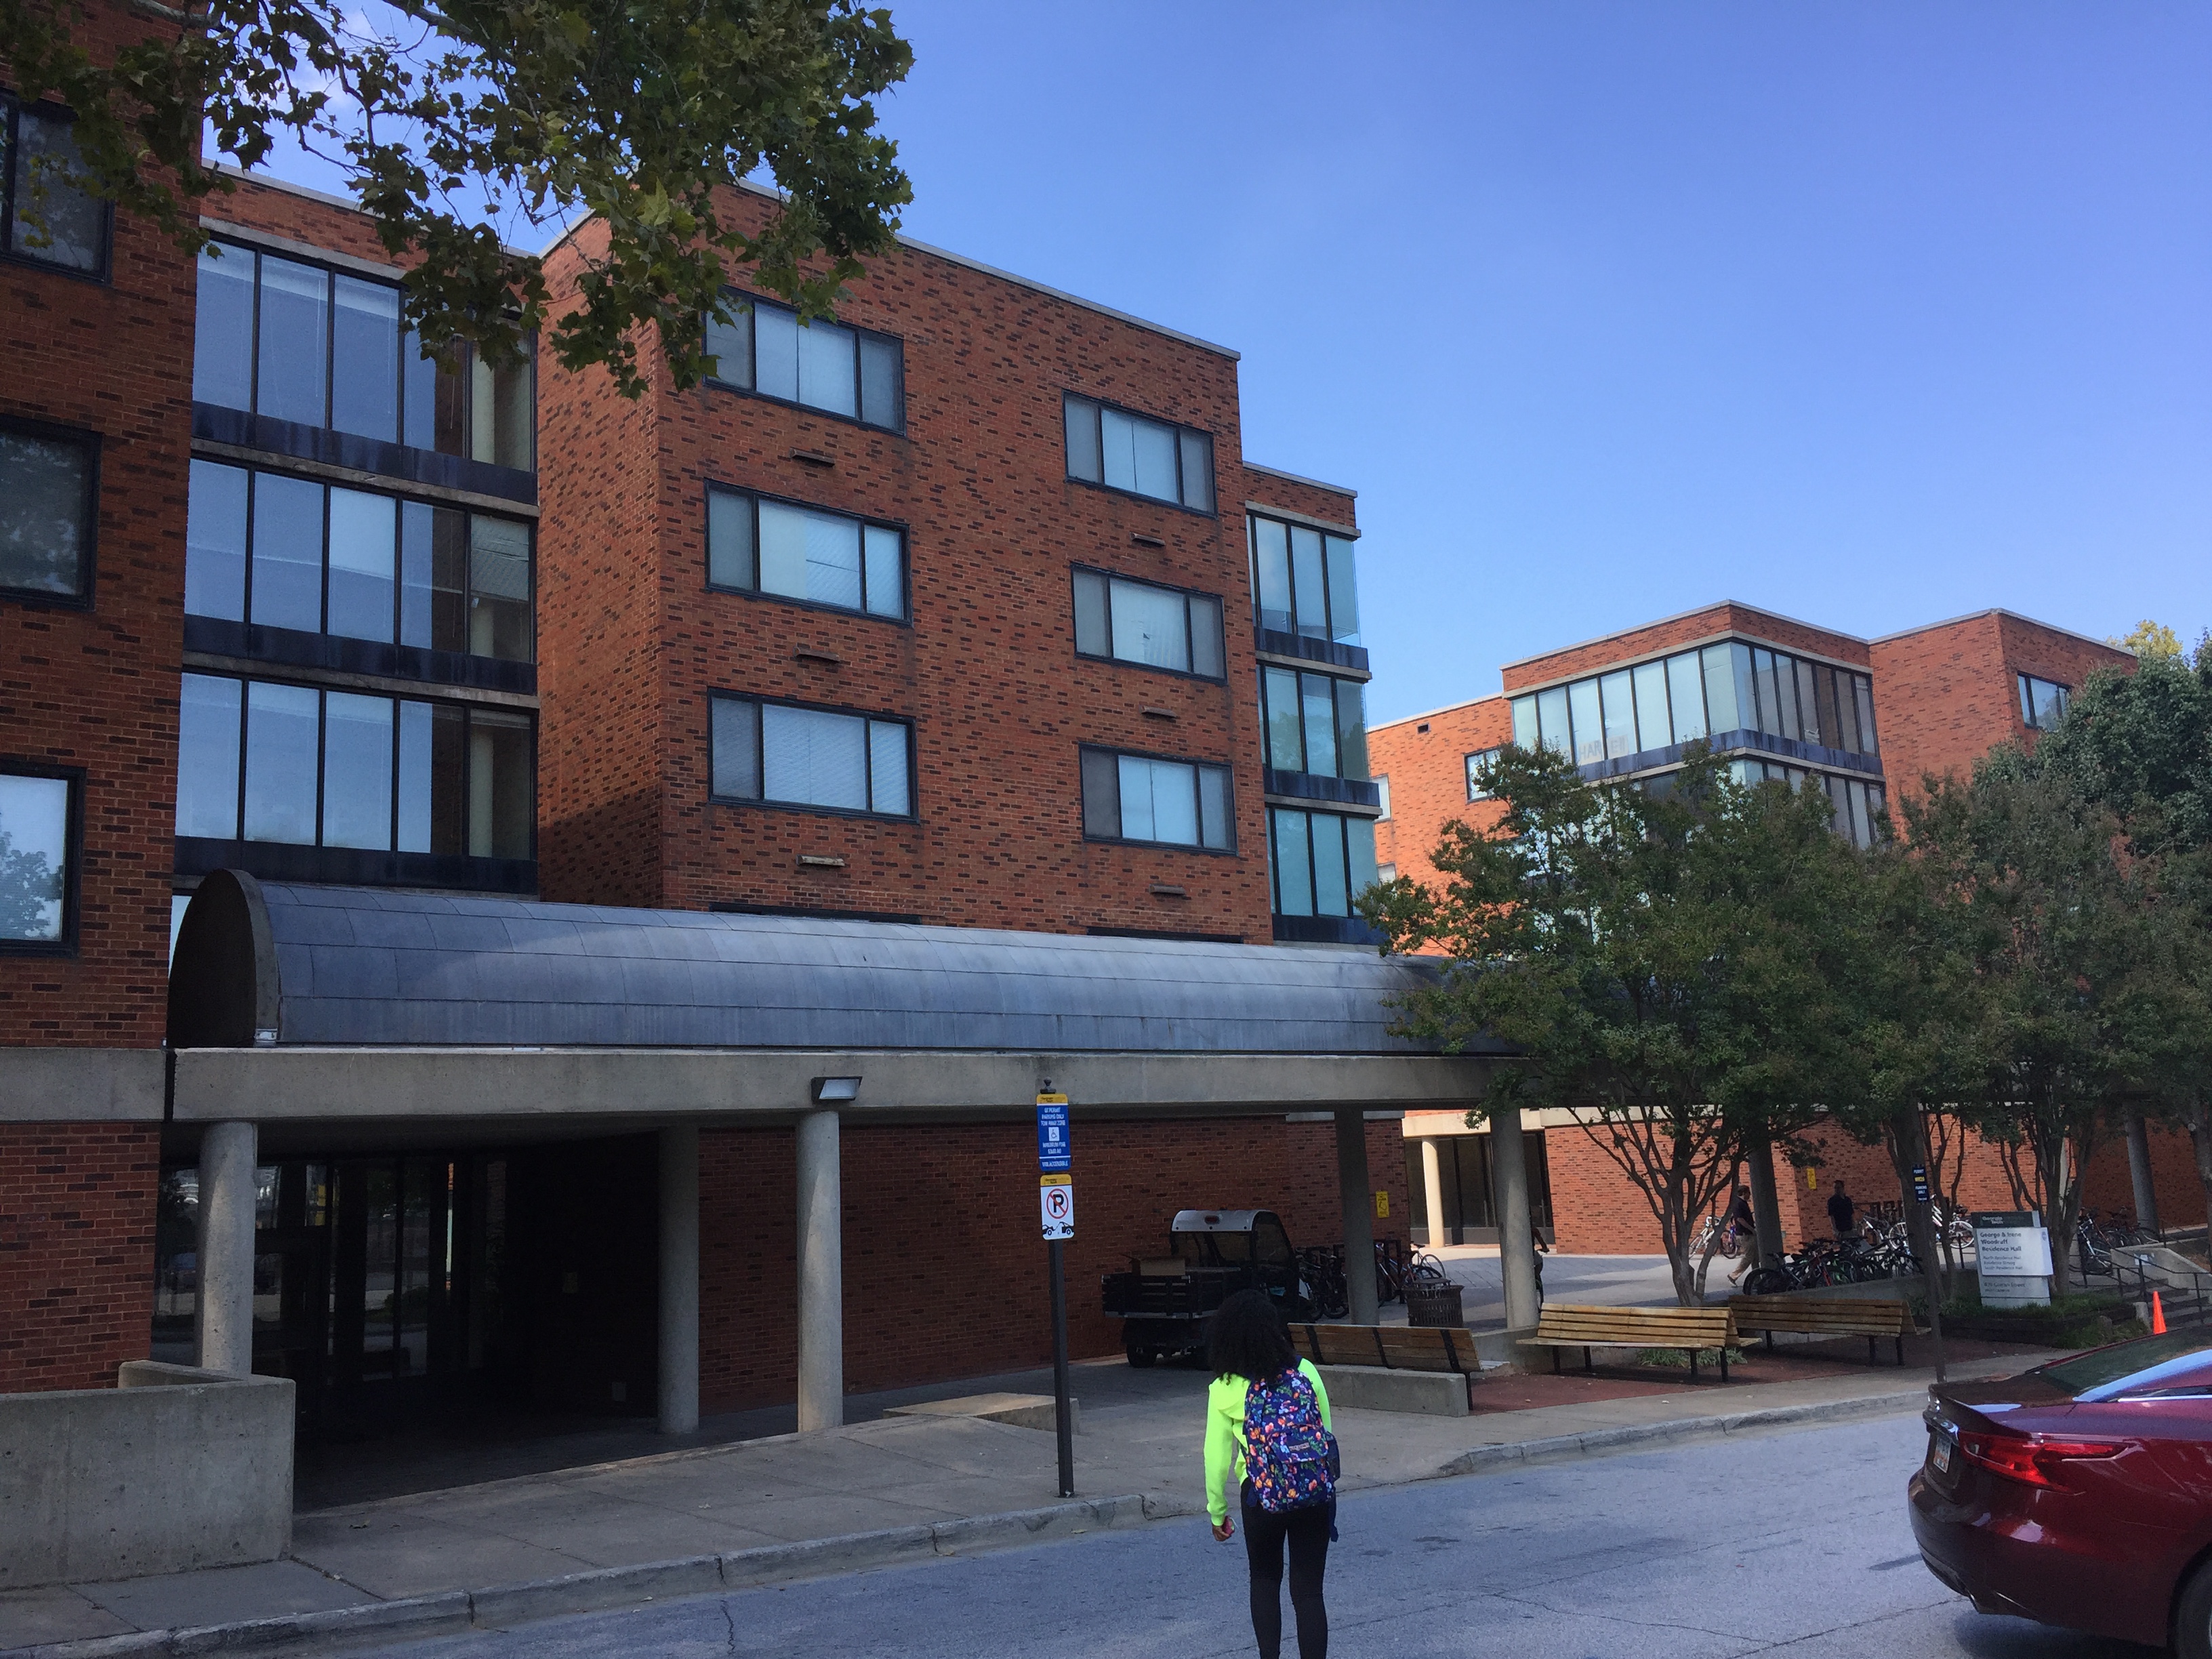
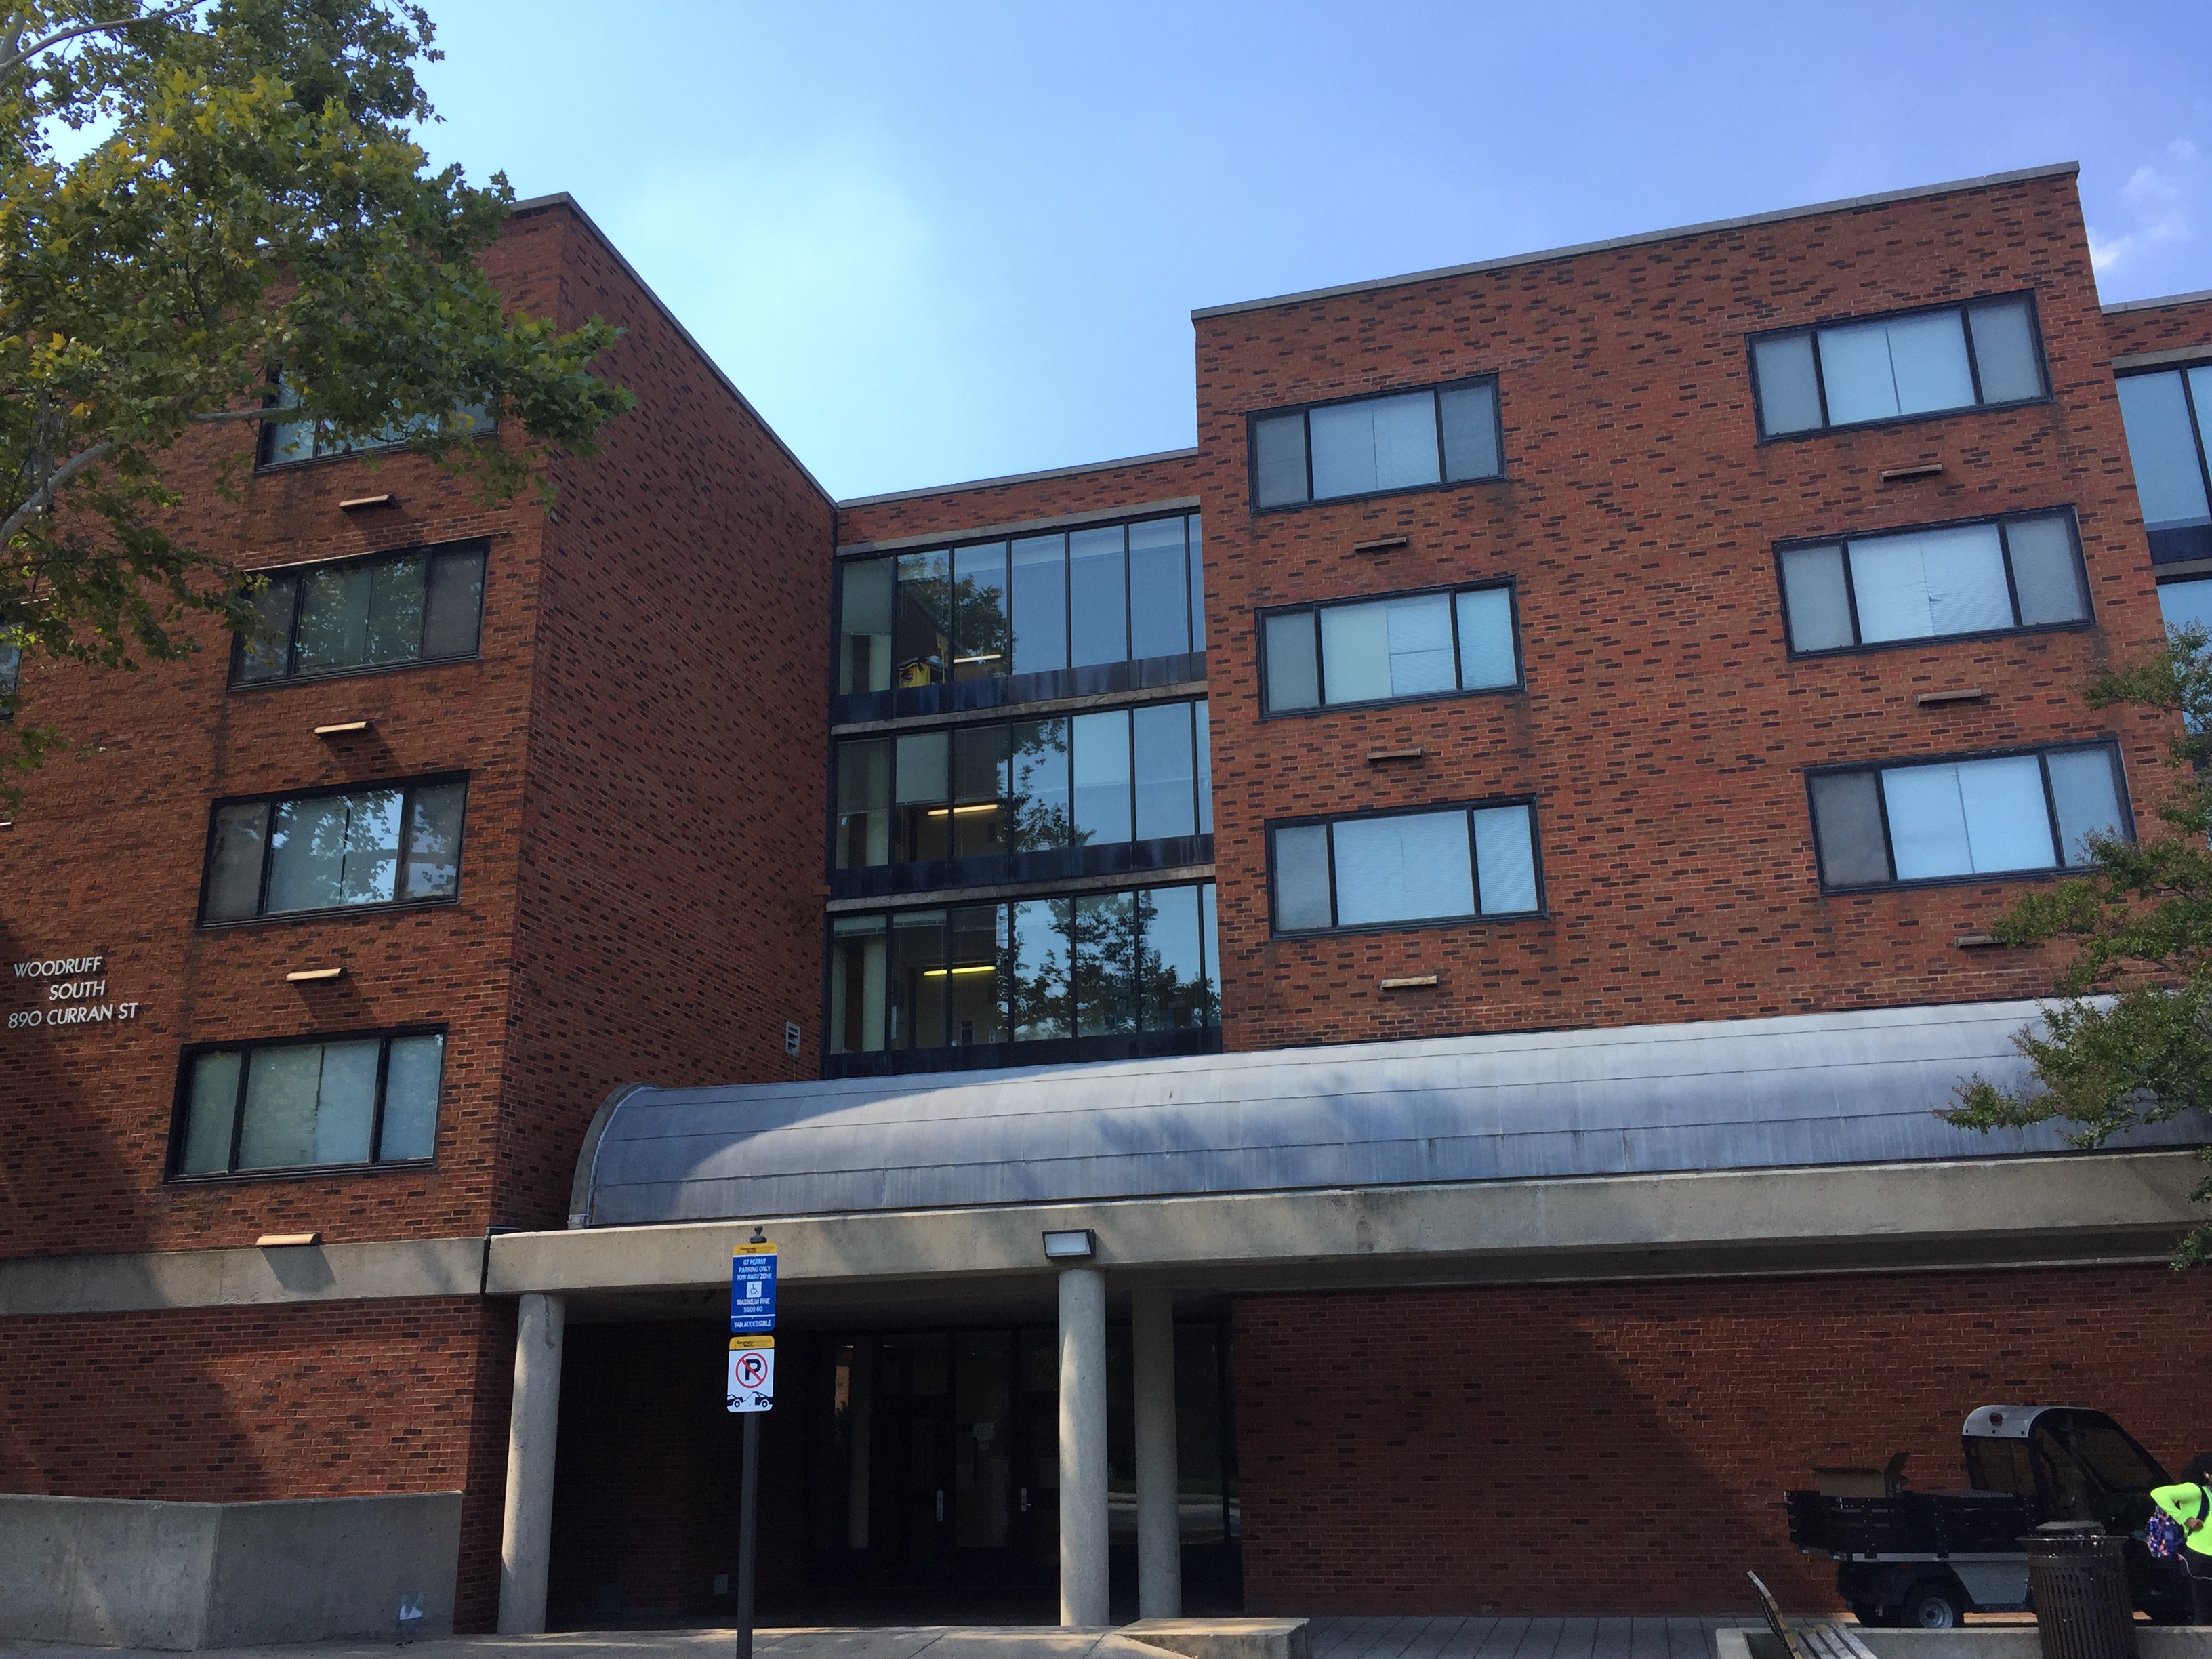
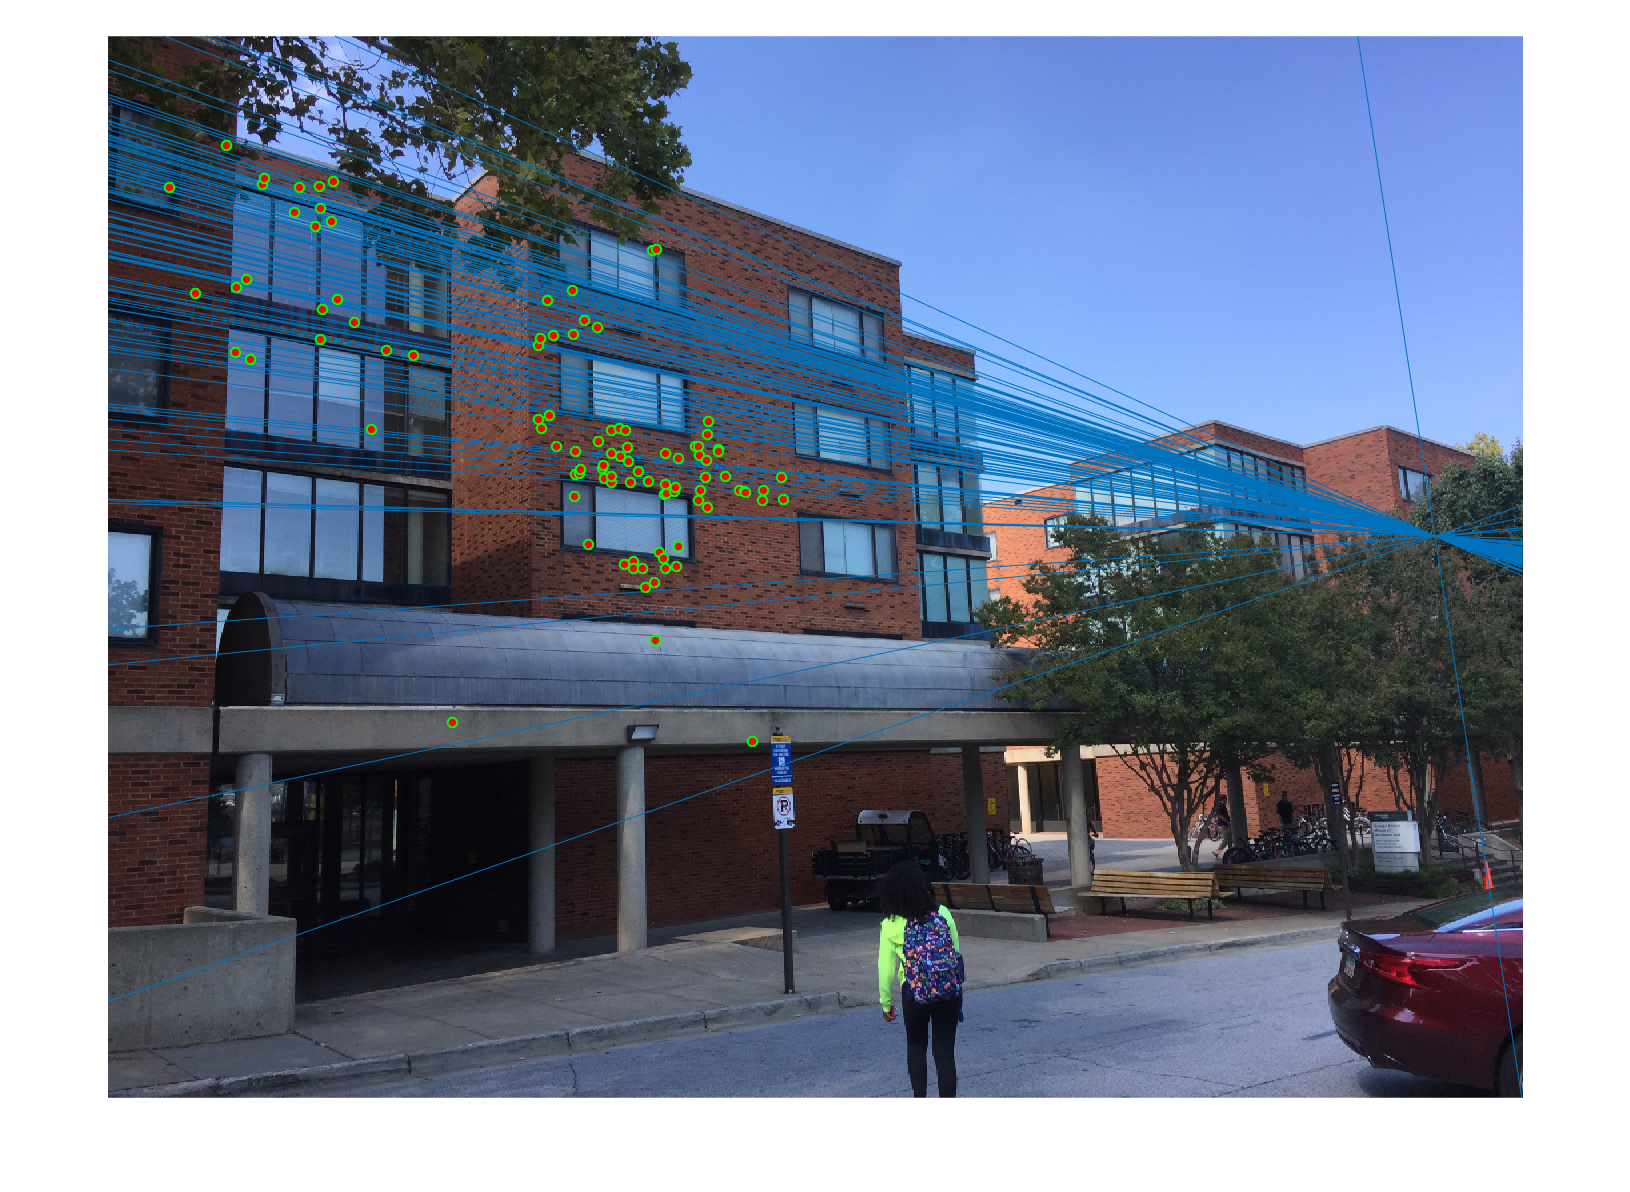
Woodruff Dorm
We first run our algorithm on the following Woodruff Dorm pair of images.
When we run the SIFT implementation, we get the following pairs of correspondances,
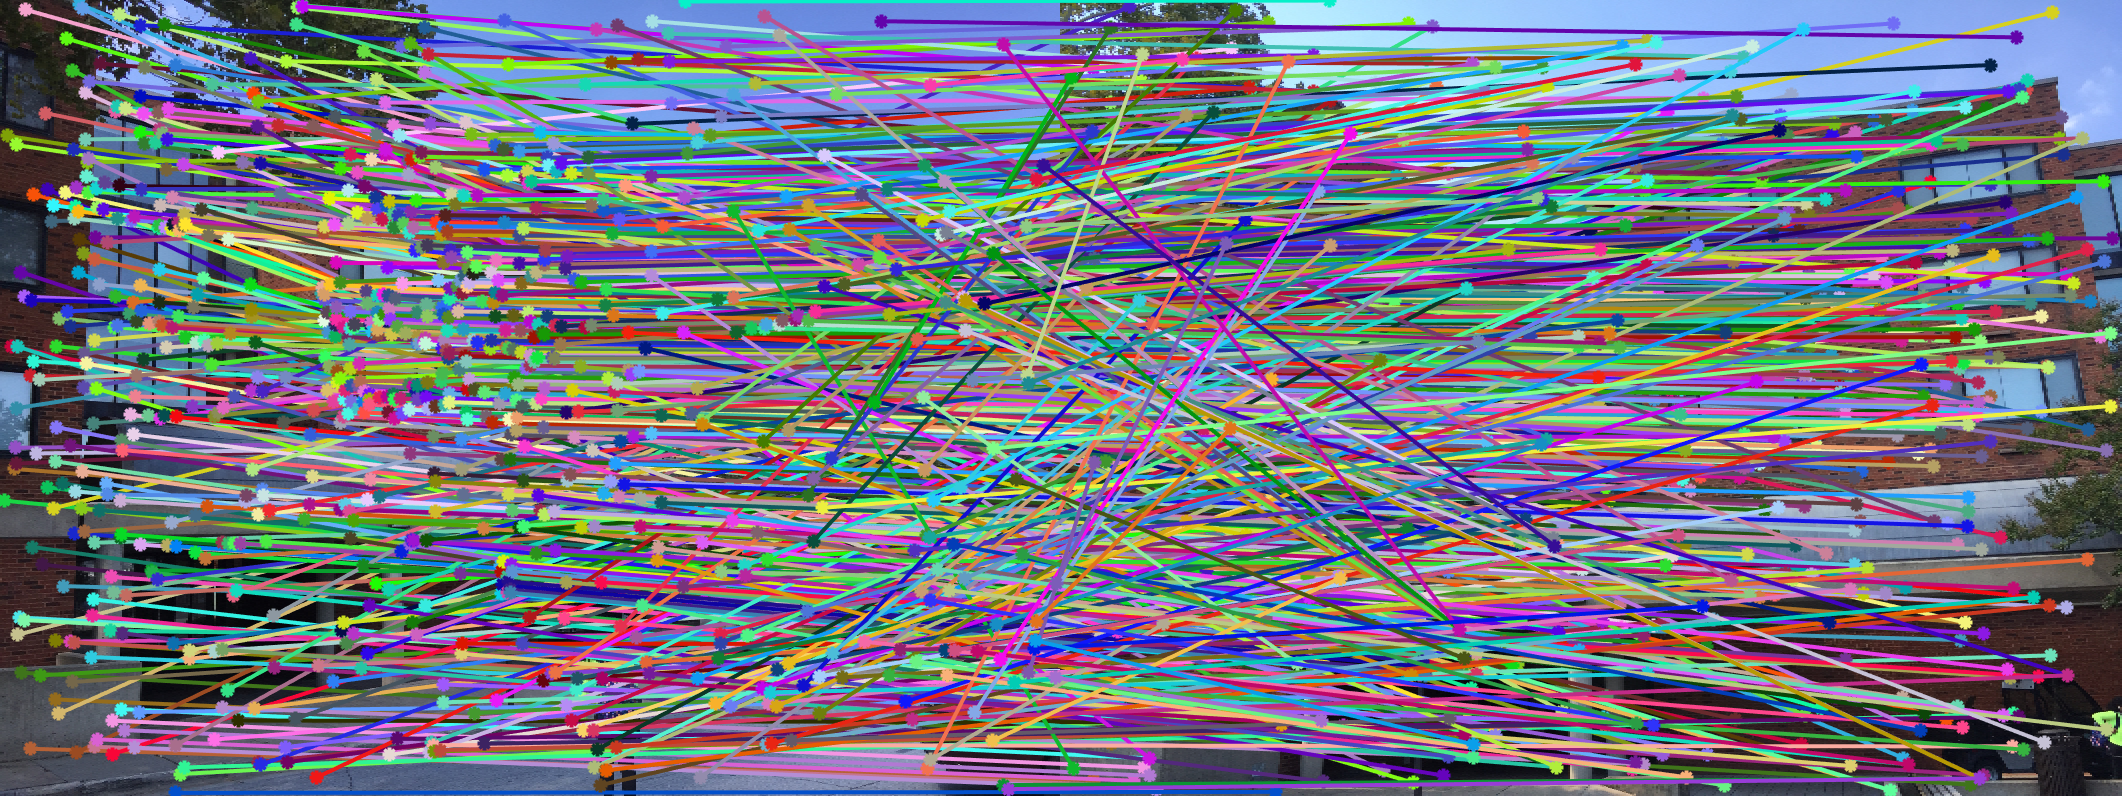
As we can see, there are a lot of matches between the two images. We will use the top 100 inliers based on the Fundamental Matrix equation descirbed above.
We estimate the fundamental matrix using RANSAC and we get the epipolar lines as shown below.
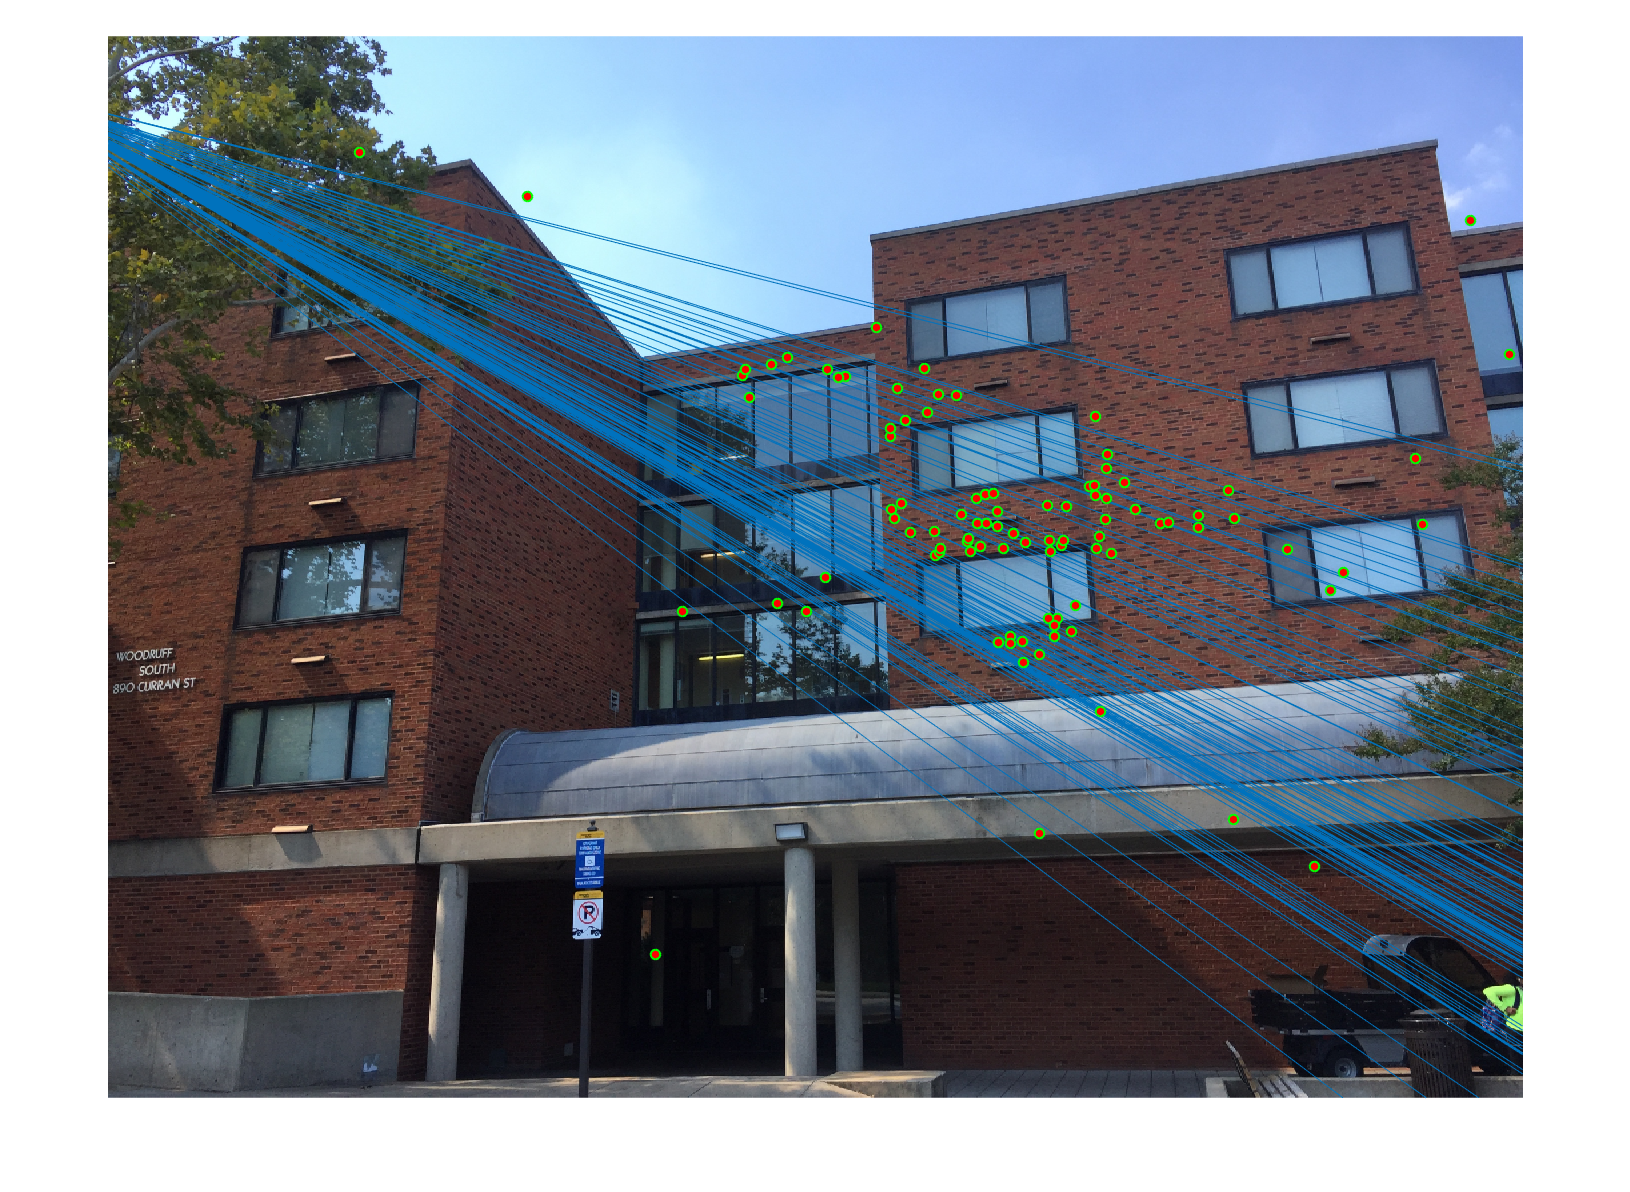
The correspondances that we get using the epipolar lines to search for the points in the other image are as follows,
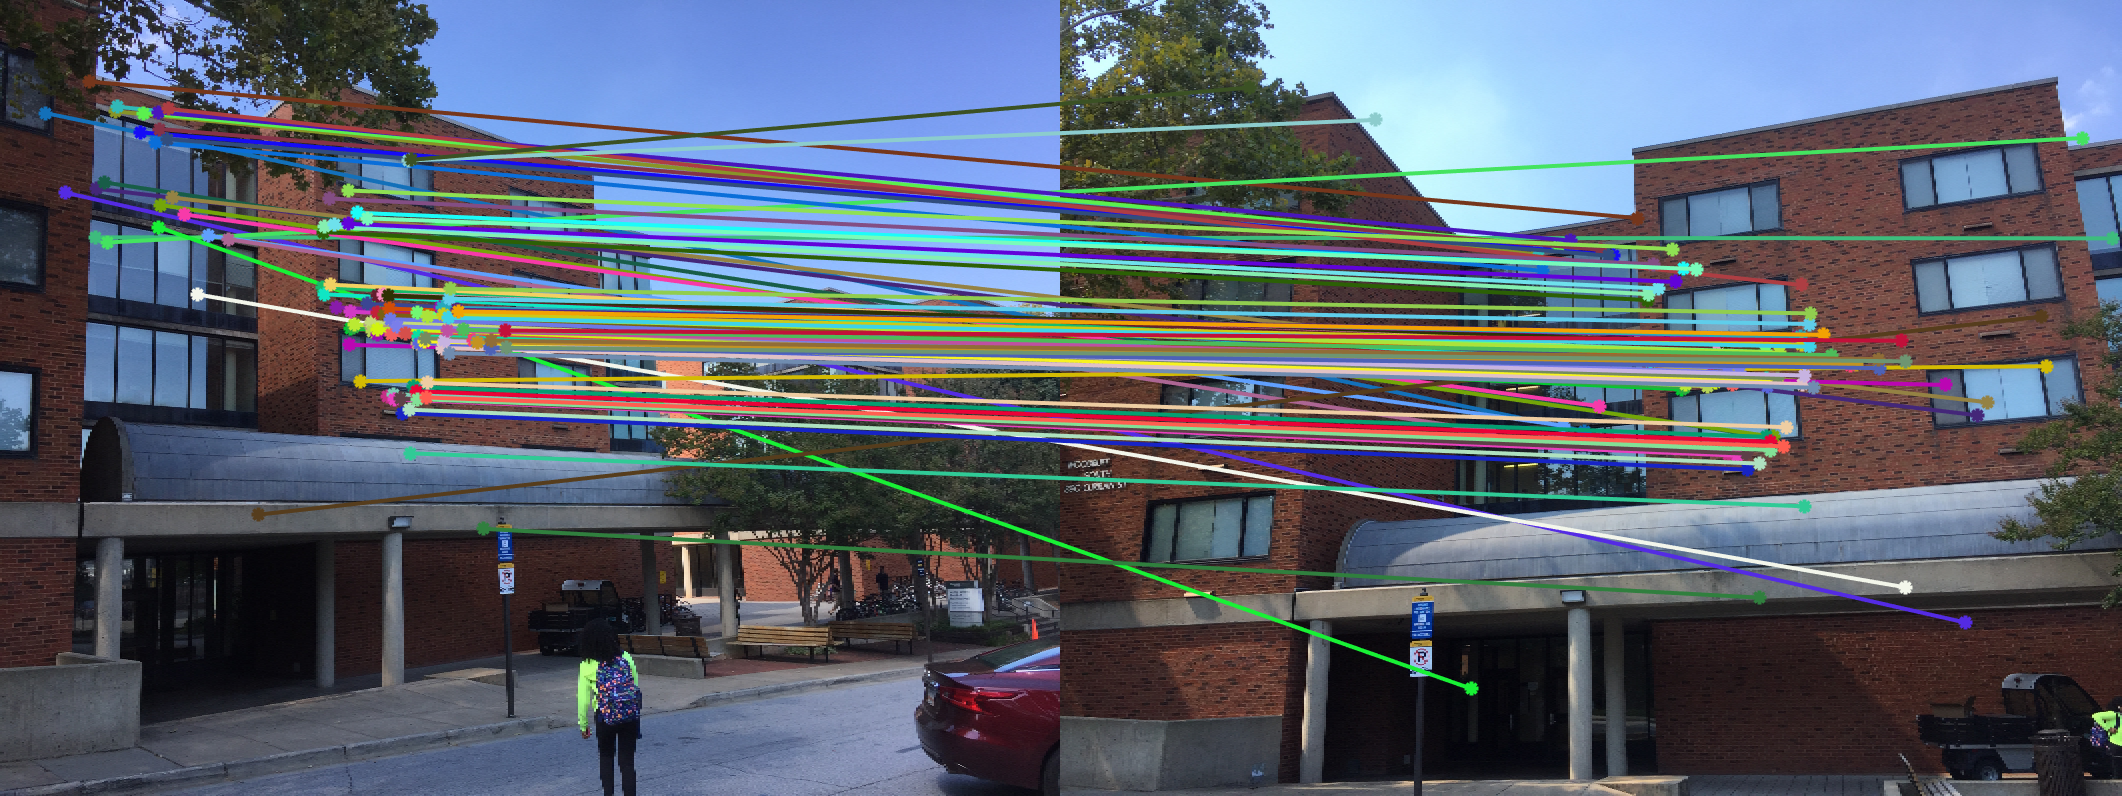
We can see that the correspondances are very accurate between the two images. The epipolar lines restrict our search vastly and the results very clearly benefit from that.