Project 3 / Camera Calibration and Fundamental Matrix Estimation with RANSAC
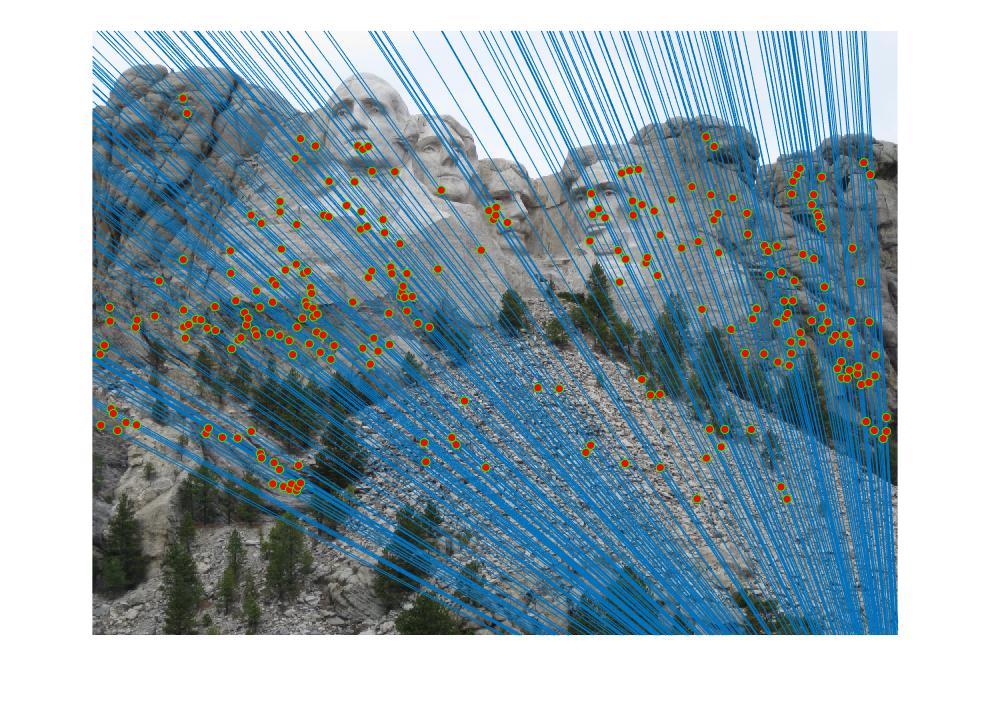
Mount Rushmore epipolar lines
In this project, we explored the use of a projection matrix to map 3D world coordinates to 2D image coordinates, how the fundamental matrix relates points in one scene to epipolar lines in another, and how these two matrices can be used to estimate point correspondences. I used RANSAC to find the best inliers for the fundamental matrix and solved for the variables in the projection matrix by using SVD on a linear system of equations. The parts of the project that were complete are as follows:
- calculate_projection_matrix
- compute_camera_center
- estimate_fundamental_matrix
- ransac_fundamental_matrix
calculate_projection_matrix.m
In this function, I calculated the projection matrix from real world 3D coordinates to the image's 2D coordinates. The function takes in the 2D and 3D points from an image, and I iterate through the points in each matrix to from a set of homogenous linear equations. I then used SVD to compute the missing variables from the linear equations, which gave the projection matrix.
%forming linear equations
for i = 1: n
    row2D = Points_2D(i, :);
    row3D = Points_3D(i, :);
    u = row2D(1, 1);
    v = row2D(1, 2);
    rows = [row3D 1 0 0 0 0 -u.*row3D -u; 0 0 0 0 row3D 1 -v.*row3D -v];
    A(2*i-1:2*i, :) = rows;
end
compute_camera_center.m
In this function, I took the projection matrix, M, and decomposed it into its intrinsic and extrinsic parts. I used the intrinsic matrix to get the camera center coordinates.
%computing camera center
Q = M(:, 1: 3);
m4 = M(:, 4);
Center = -inv(Q) * m4;
Projection Matrix and Camera Center

estimate_fundamental_matrix.m
This function took in corresponding points from two different images and computed the fundamental matrix between thoes images. It once again creates a set of linear equations that are then solved by using SVD to get the values of the fundamental matrix. The fundamental matrix that was calculated is:

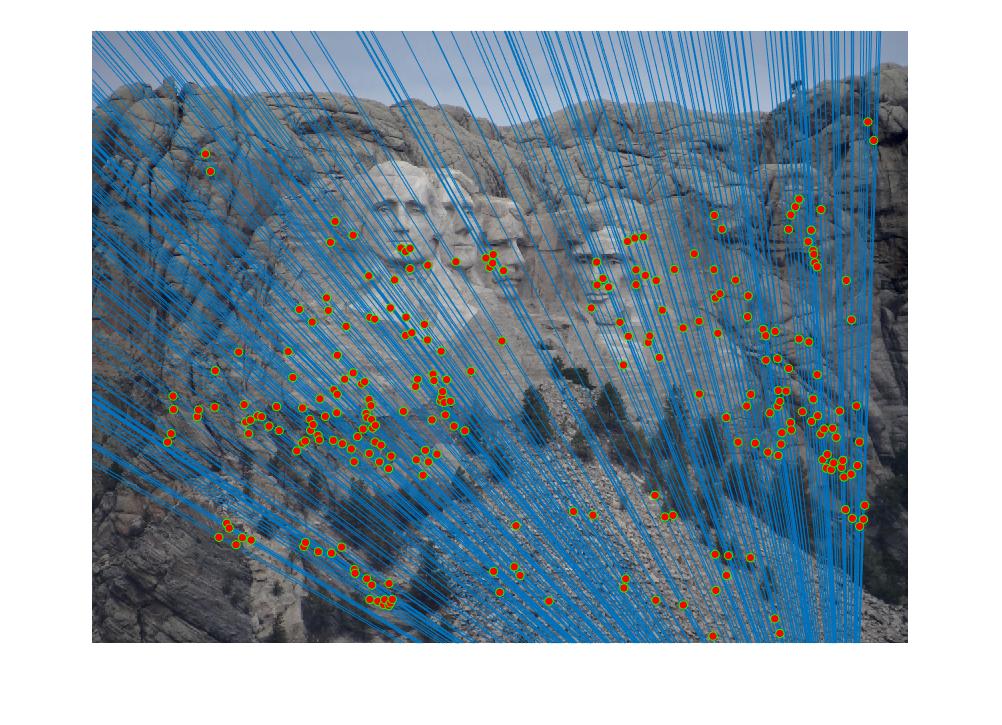
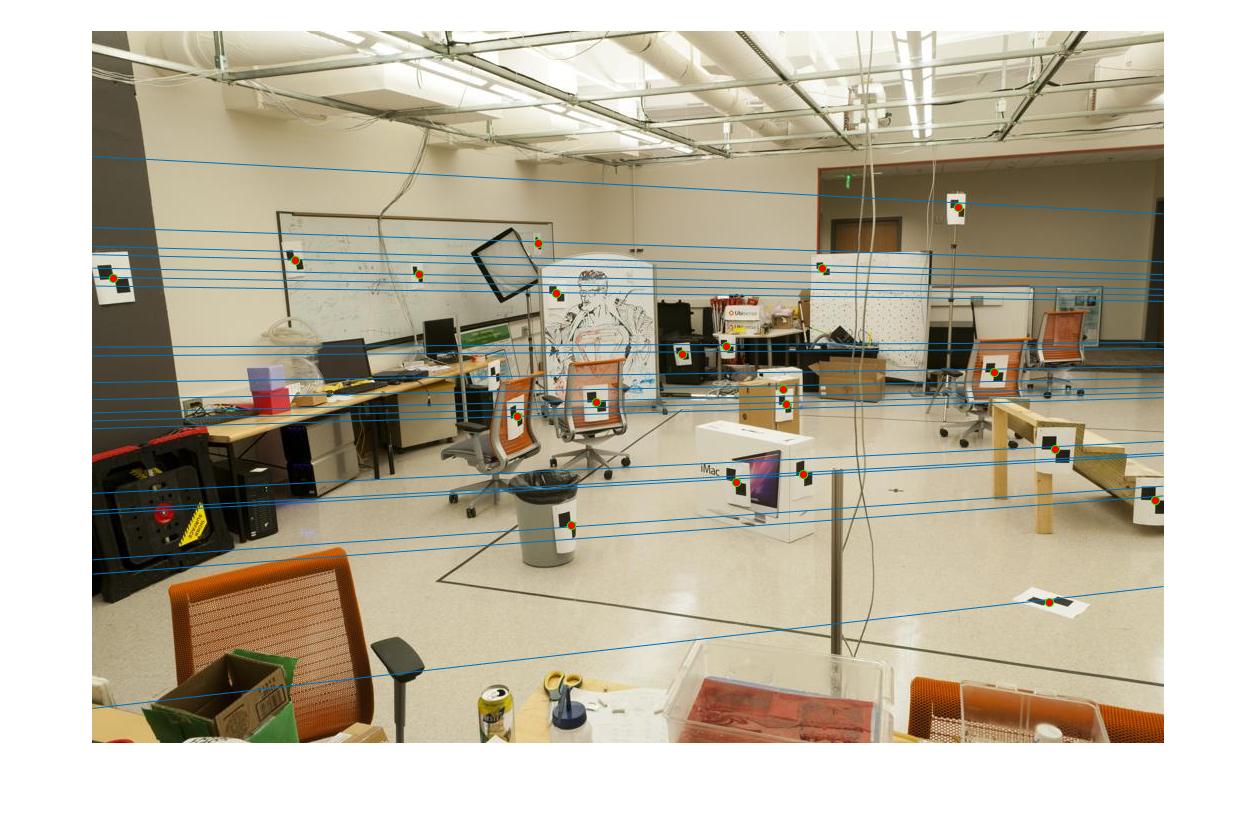
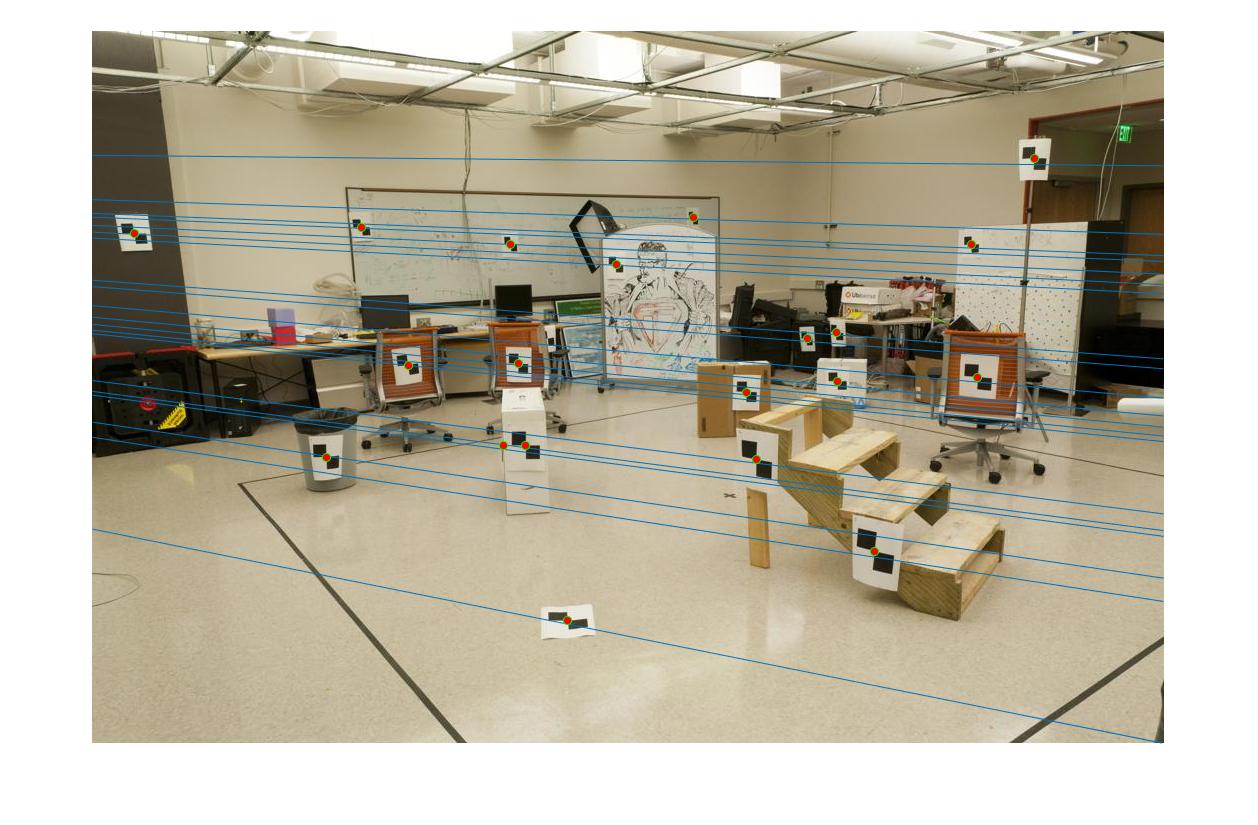
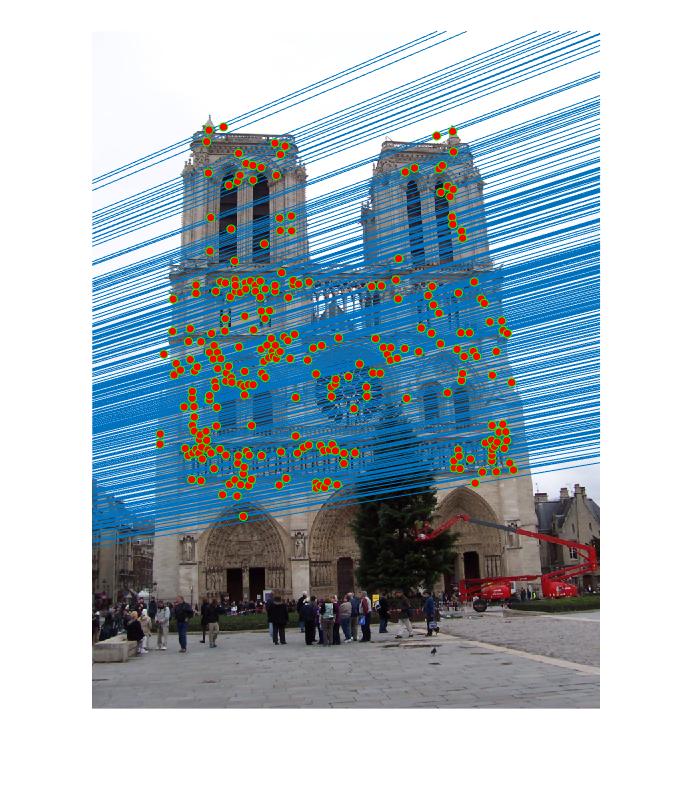
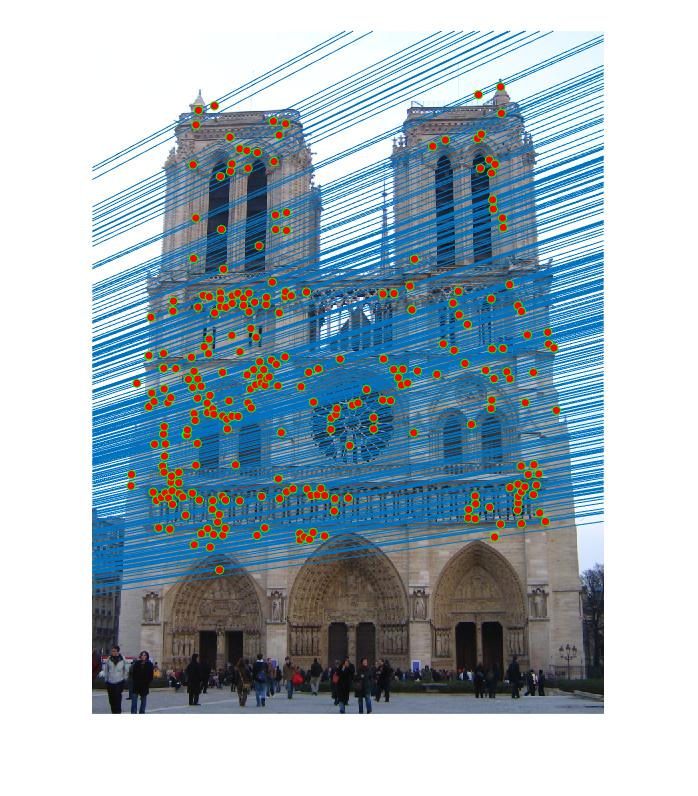
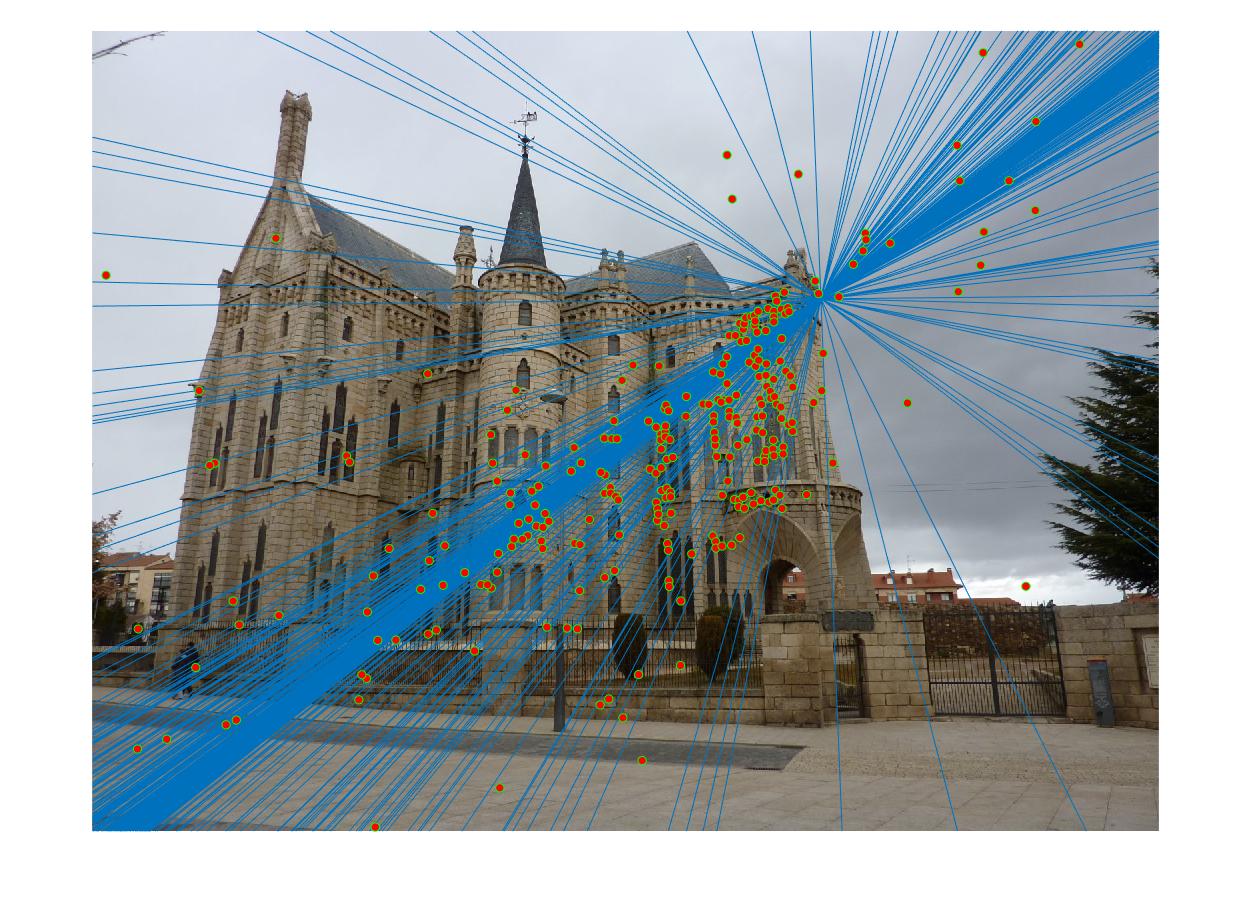
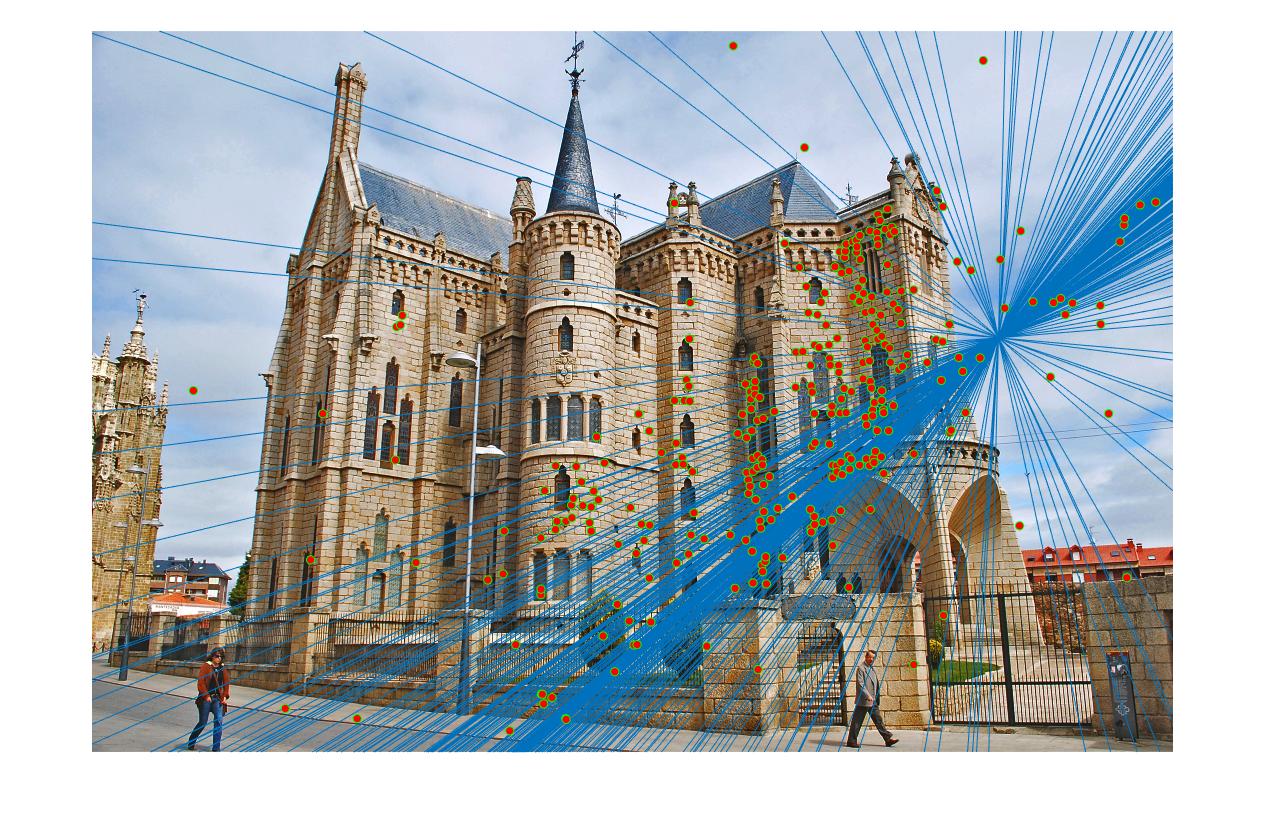
The epipolar lines that were generated are as follows:
ransac_fundamental_matrix.m
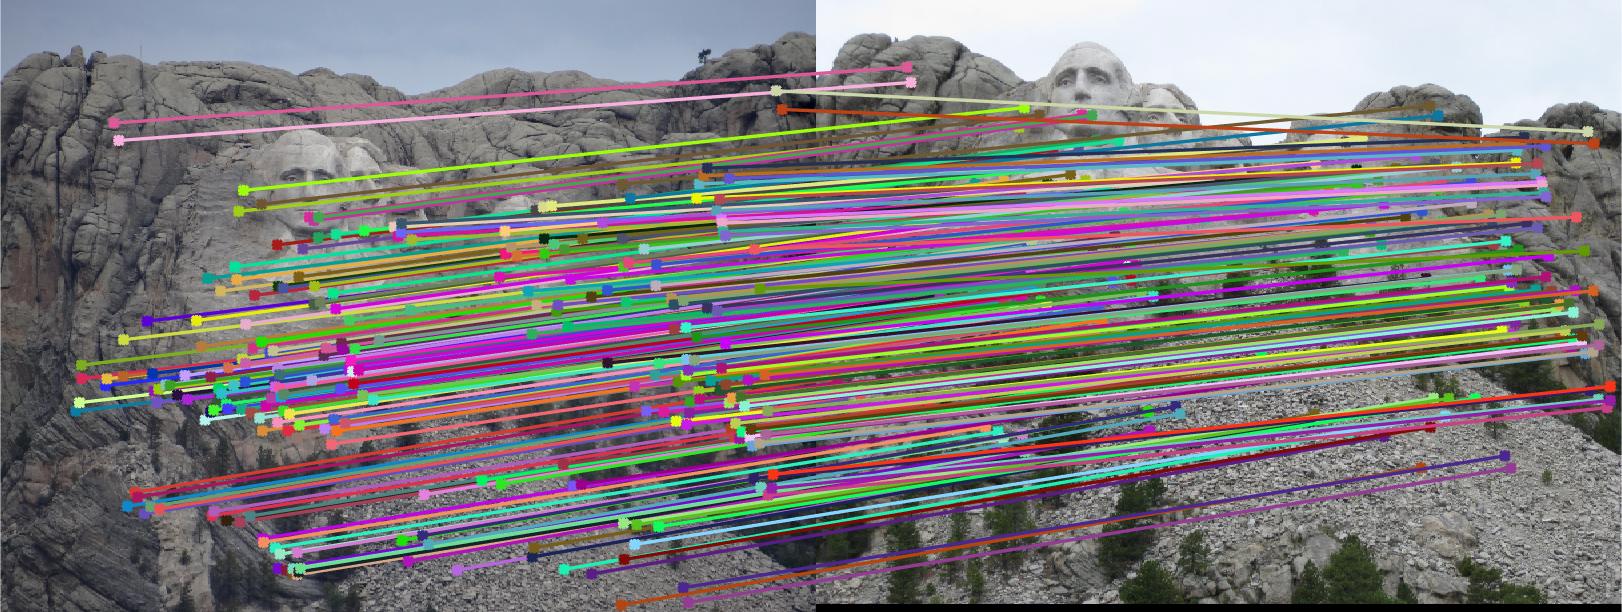
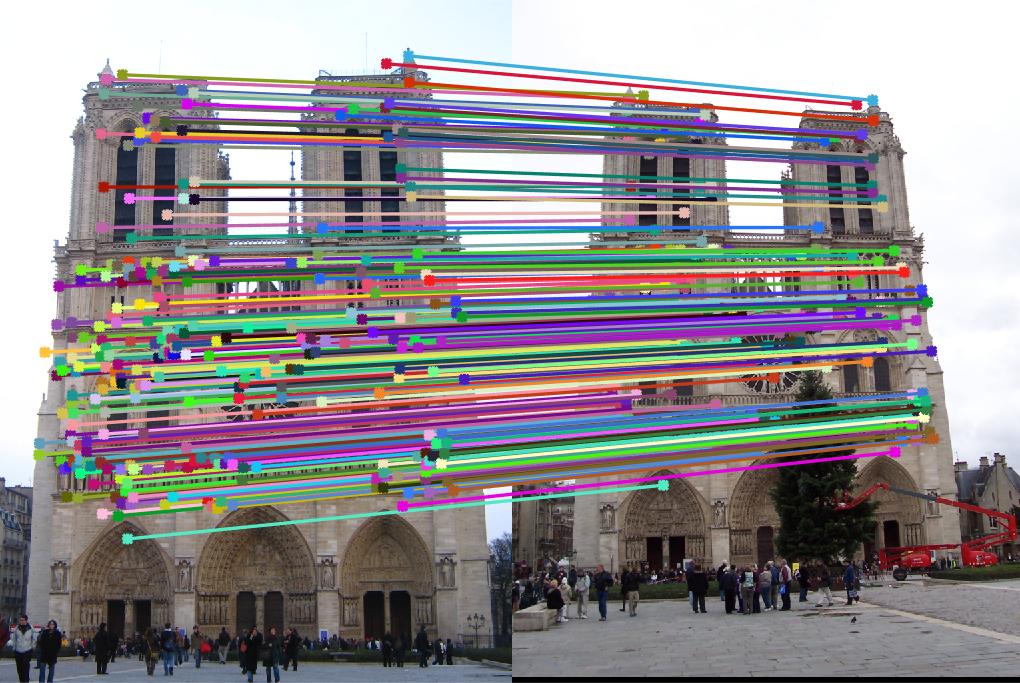
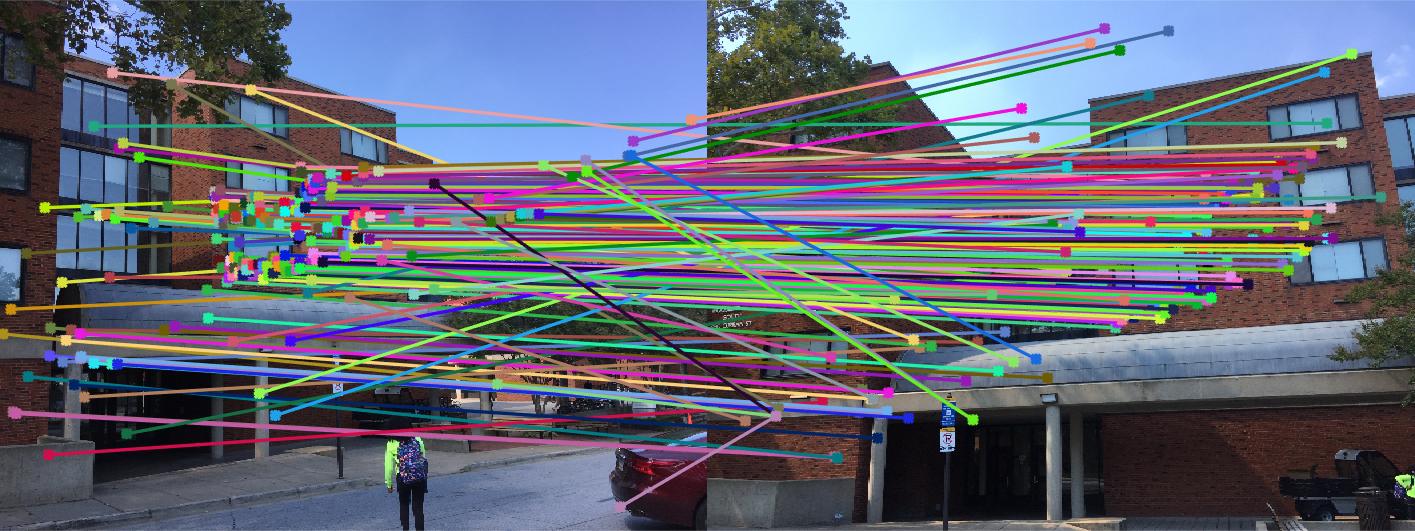
In this function, I took corresponding matches between two images and randomly sampled 8 matching points in order to use them in the fundamental matrix. Using that fundamental matrix, i estimated a score for each of the matching points, and if that score was less than some threshold, it was added to a list of inliers. The total number of inliers for these randomly sampled points was recorded. Then, following RANSAC procedure, I repeat this process an arbitrary number of times (10,000) and at each iteration, check the number of inliers recroded. If the number of inliers is greater than the current maximum number of inliers, then the fundamental matrix corresponding to the previous max is replaced by the fundamental matrix with the values that correspond to the new maximum number of outliers. At the end of the 10,000 iterations, the best fundamental matrix will be recorded.
Results in a table
|
|
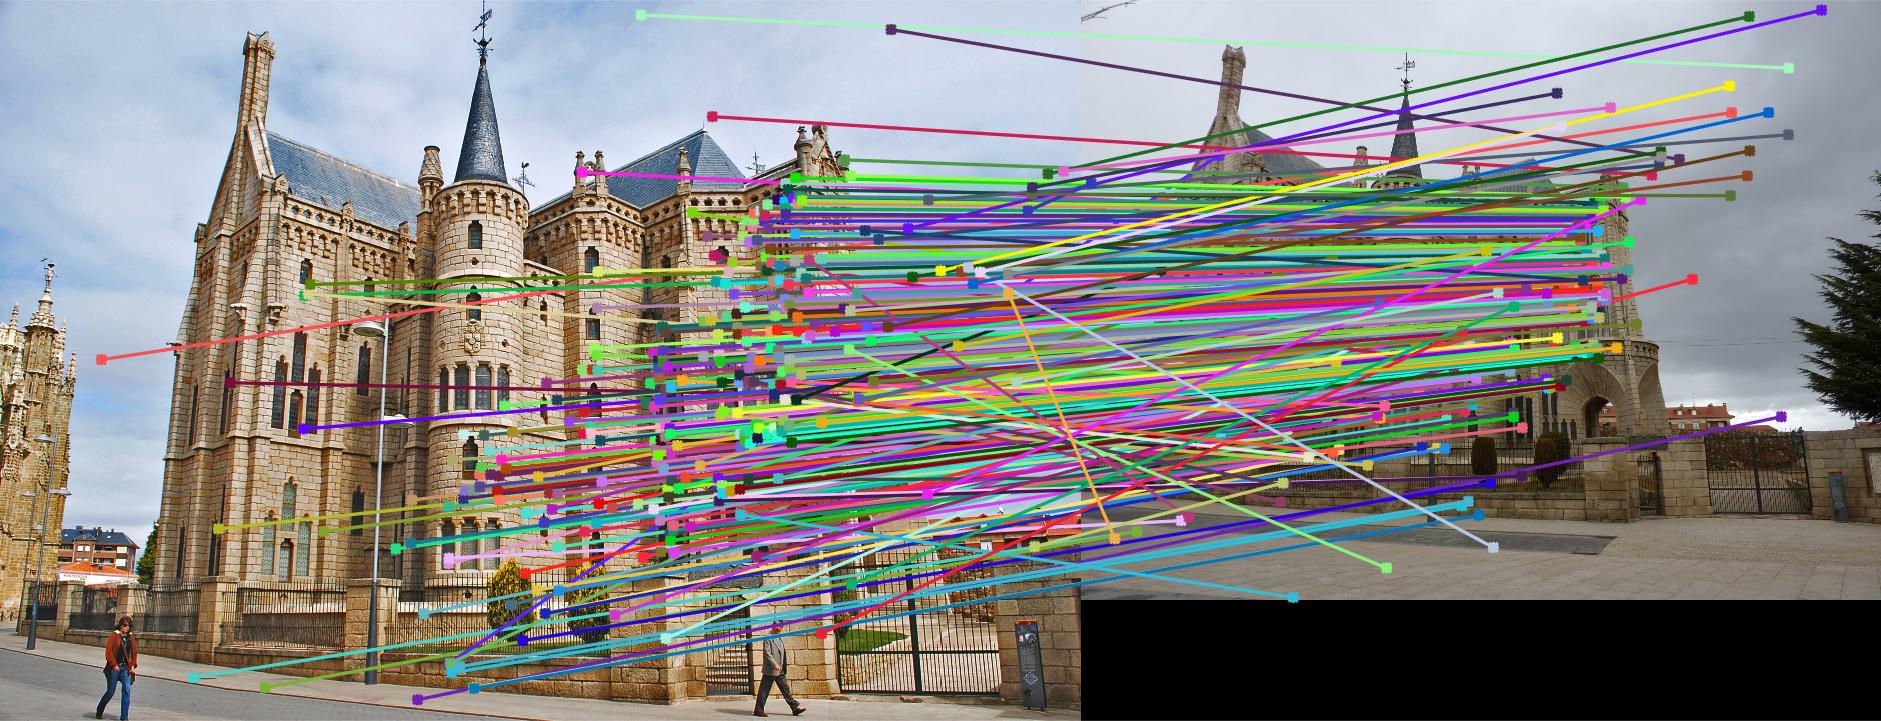
|
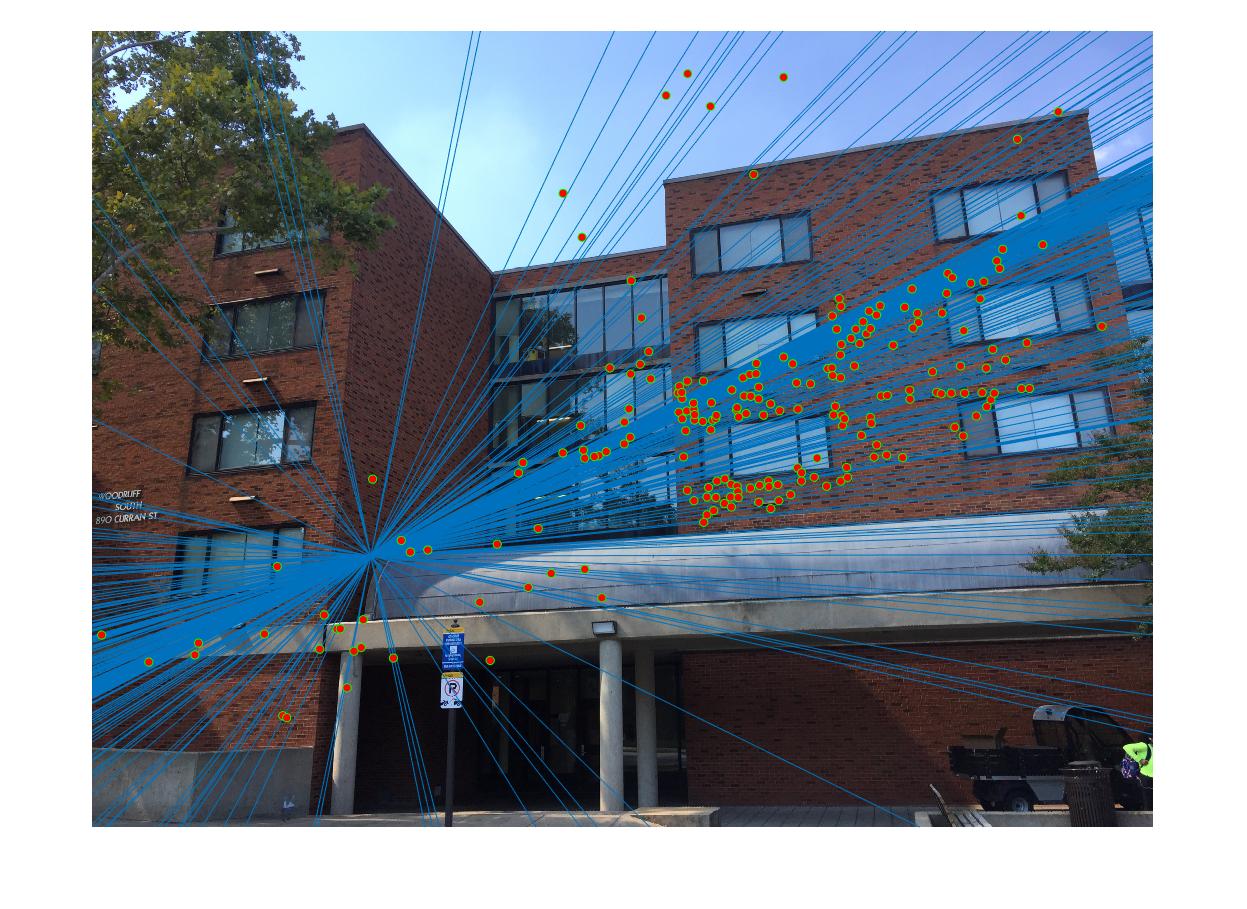
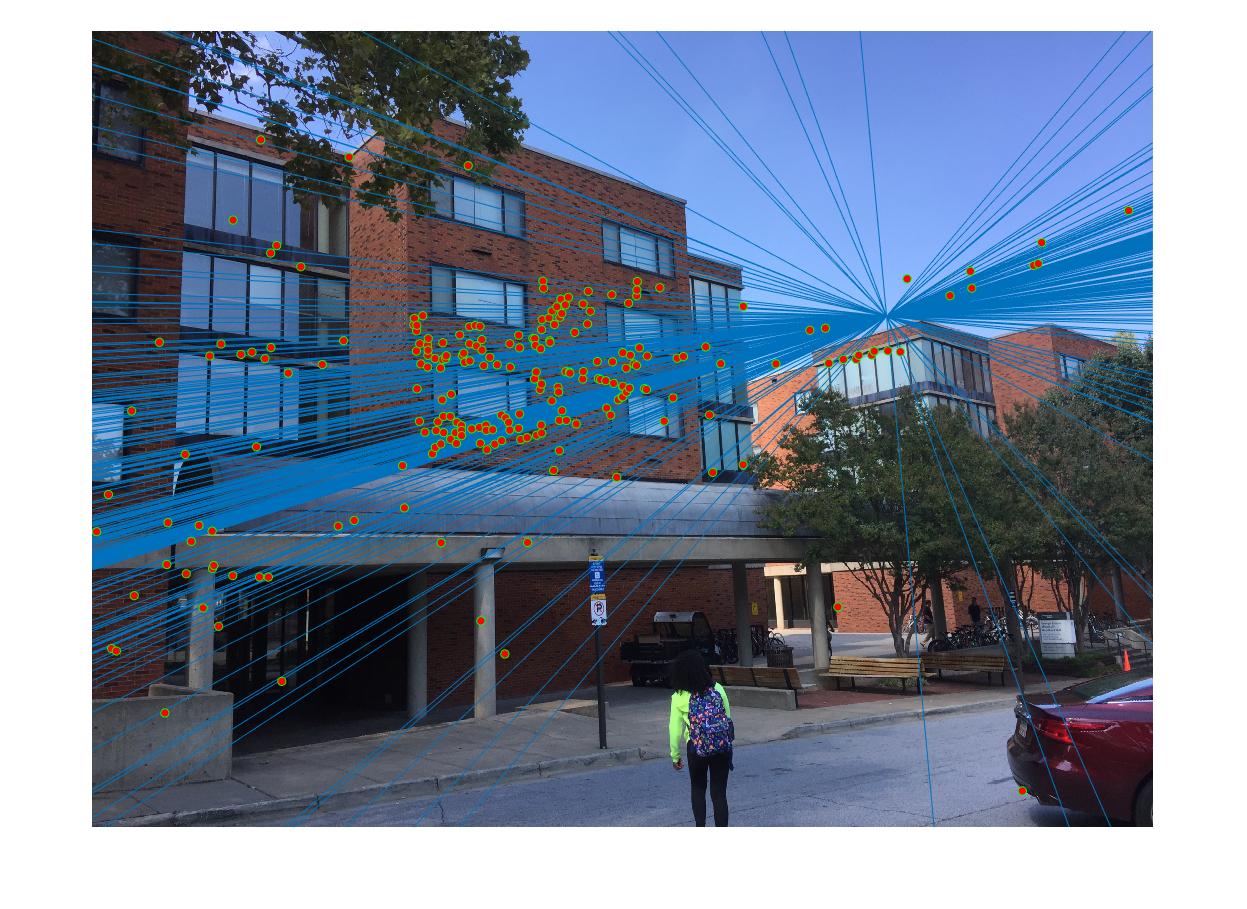
|
The above images show the matching SIFT features, and the epipolar lines from each of the two pictures. The image of all of the SIFT features is not shown as it does not provide any valuable information. From the images above, you can see that there were varying degress of success in terms of finding correct epipolar lines. For Mount Rushmore and Notre Dame, there were surprisingly exact results, as the corresponding points in each image had epipolar lines crossing through most of them. The Episcopal Gaudi proved a much more difficult image. This could possibly be because one picture is brighter than the other. The images of Woodys did not perform poorly, but it also did not perform quite as well as the first two images did.