Project 3 / Camera Calibration and Fundamental Matrix Estimation with RANSAC
This project can be broken into two or three parts. First is the Camera Calibration part. For this task, the goal was to first solve for the projection matrix, using corresponding 2D image and 3D world coordinates. Most of the difficulty in creating the projection matrix honestly came from expressing the system of linear equations as a matrix programmatically. After I got a matrix, A, I was able to use svd method of solving the system as taught in class. After the projection matrix was solved for, finding the camera center was trivial, using the following formula:
\[M = (Q|m_4)\] \[C = -Q^{-1}m_4\]Where M is the projection matrix and C is the vector representing the camera center.
Fundamental Matrix Approximation
The remaining bulk of the project concerned the approximation of the Fundamental Matrix, F, of a pair of two images given a number of potentially corresponding feature locations across each pair. To accomplish this task, first code was written to approximate F given the points. After that part was handled, the RANSAC algorithm was implemented in order to find the best approximation for F. To estimate the fundamental matrix, the corresponding points were assembled into a system of linear equations, which were then solved by Singular Value Decomposition like in the projection matrix code mentioned earlier. However, this solution provides us with a rank 3 matrix, while the fundamental matrix is by definition only rank 2. To correct for this, we recalculate F to be its rank 2 approximation, once again using SVD to do so.
While the above gives us the best approximation for F given the points provided, it is vulnerable to high inaccuracy if the provided points are noisy. This can easily happen as SIFT-like features, which are used to find corresponding points, are not perfect on many images and thus some incorrect pairs will make it into our matrix calculations. To guard against this, Random Sample Consensus (RANSAC) is used to pick the model that most points agree with. It does this by chosing a random 8 points (the number needed to guarantee a unique solution for F) and calculating the ratio of inliers versus outliers for that model. It then repeats this procedure a fixed number of times before finally returning the model with the best ratio. For simplicity, my code actually made a small deviation here in that I only calculated the ratio of inliers to total pairs tested. Ultimately since my ratio is strictly less than the inlier:outlier ratio, the same end results will be found each time. Finally, in addition to the best approximation of F, a random sample of 30 inliers and outliers were returned to be visualized below.
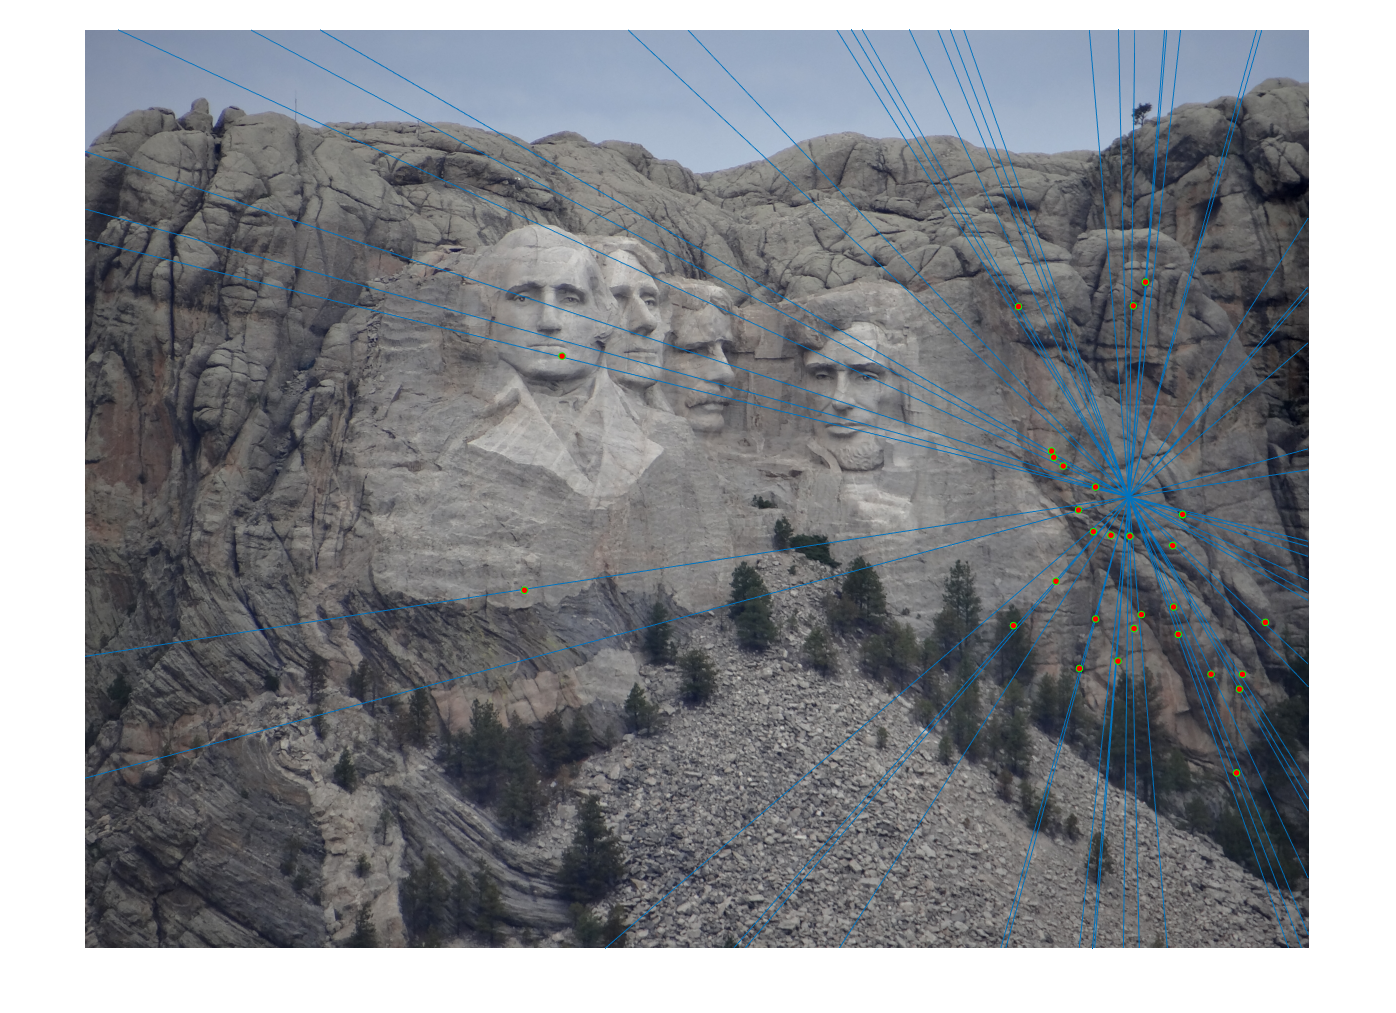
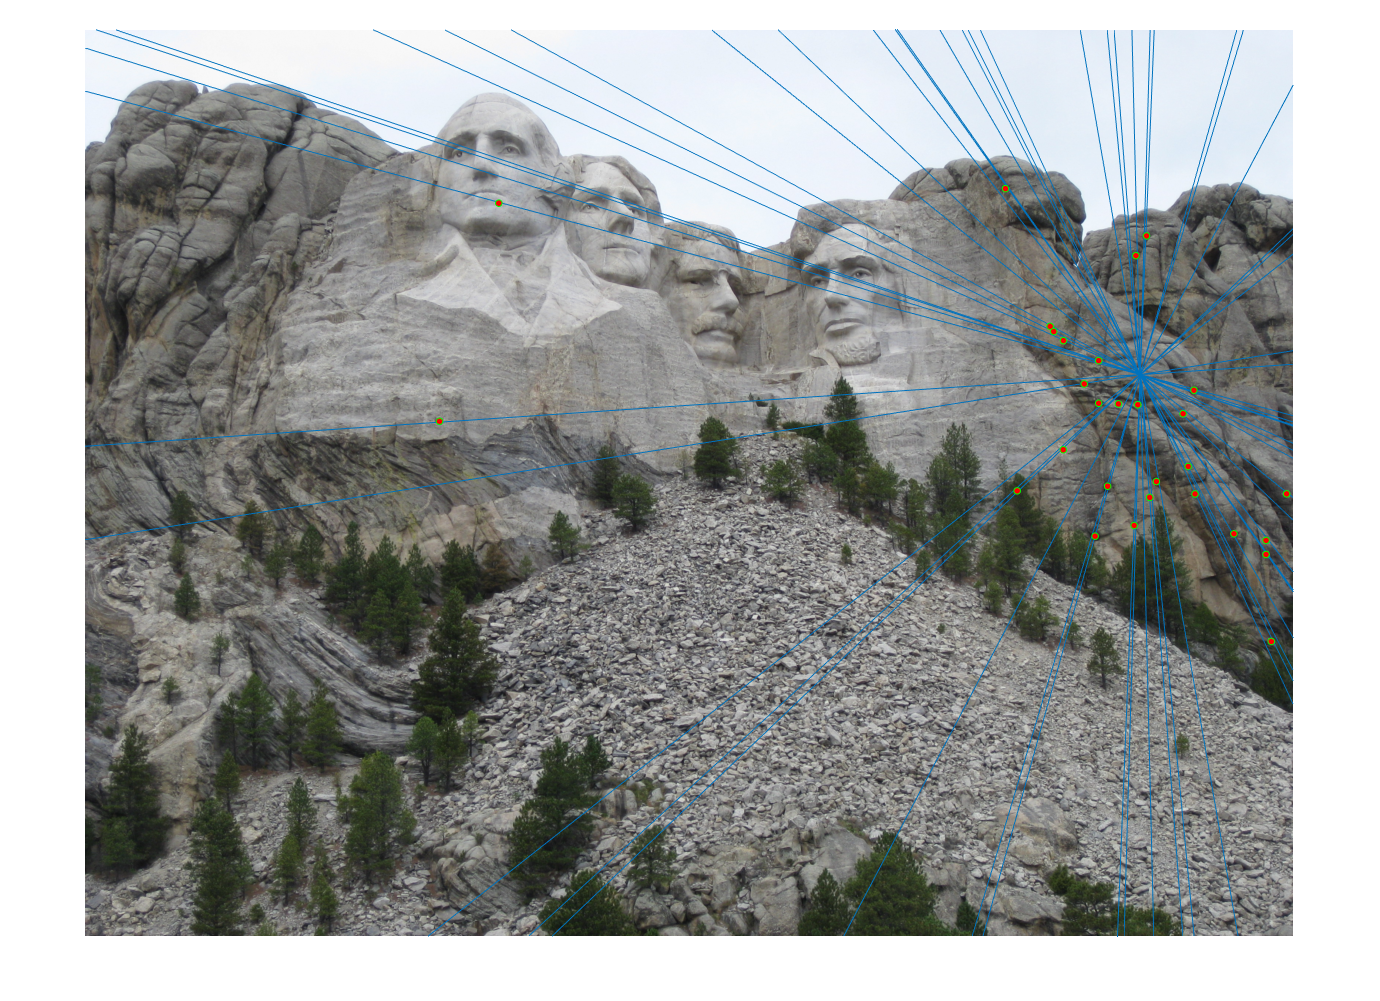
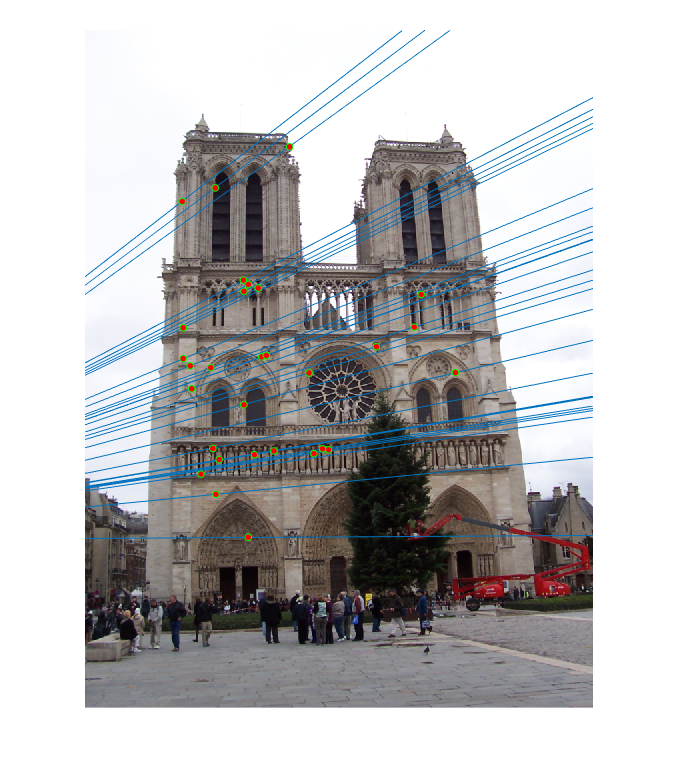
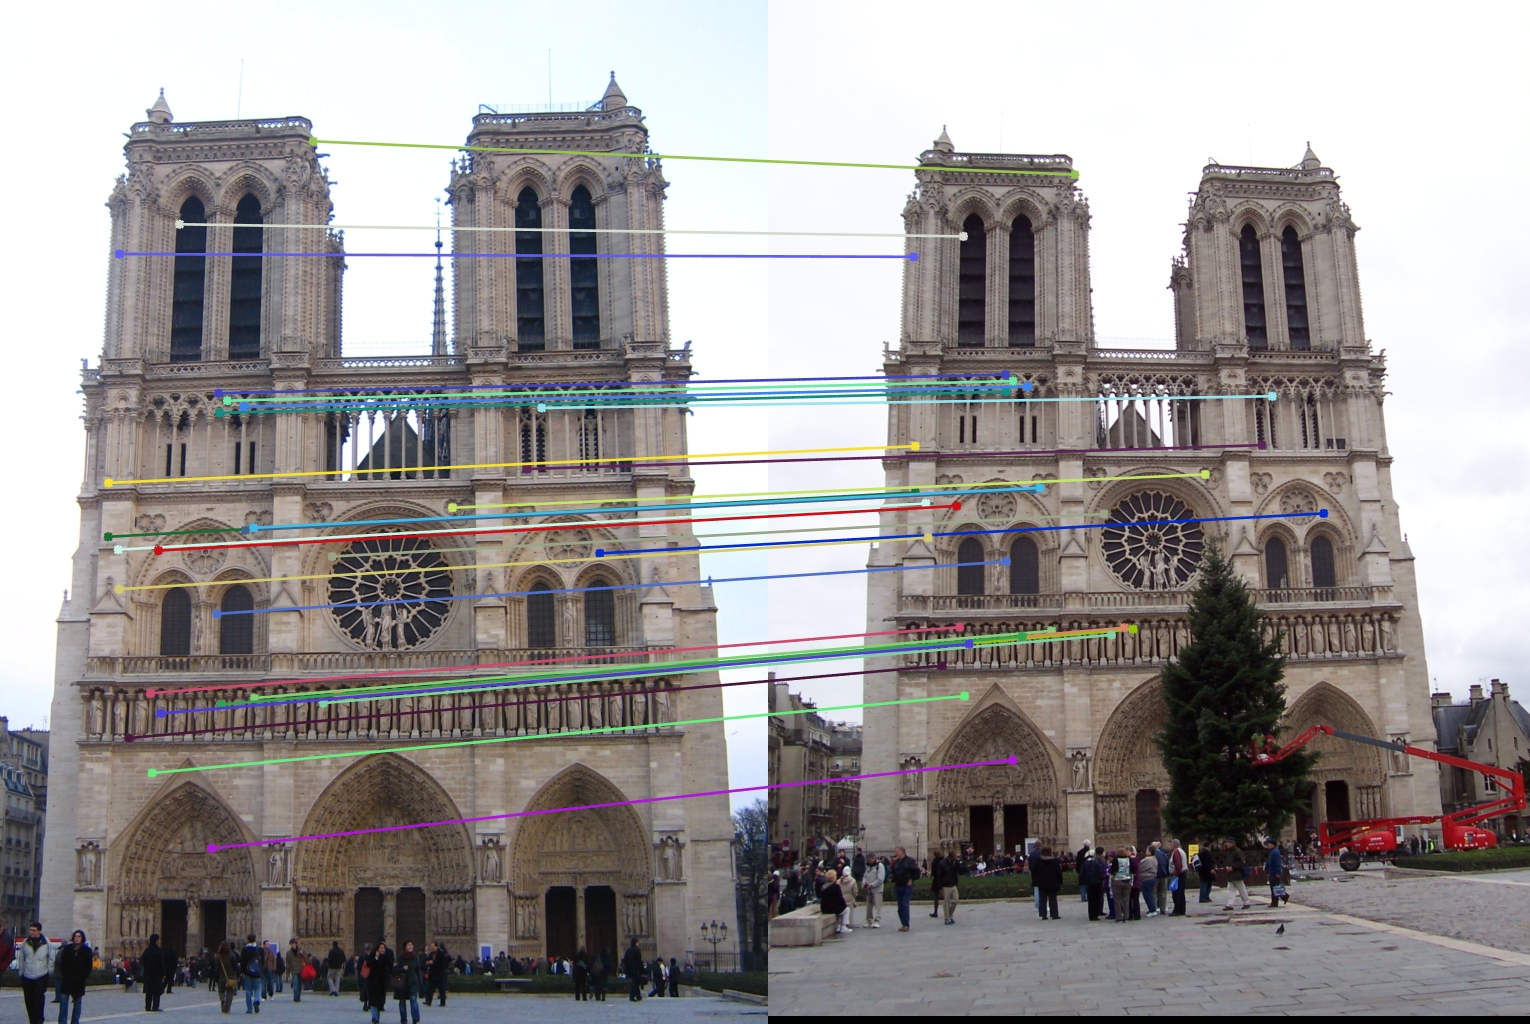
Above you can see the pair of epipolar lines generated by the fundamental matrix for the pair of Rushmore images above. The images above are a bit small (I recommend openning them in a new tab in order to view them in their full size), however close inspection will show that almost every single line appears to pass through one of the matches points for each pair. As such, we should believe that our fundamental matrix approximation is good for the pair. Also, our corresponding features should be very un-noisy. We can confirm this notion by checking whether the points correspond by the same visualization used in the last project:
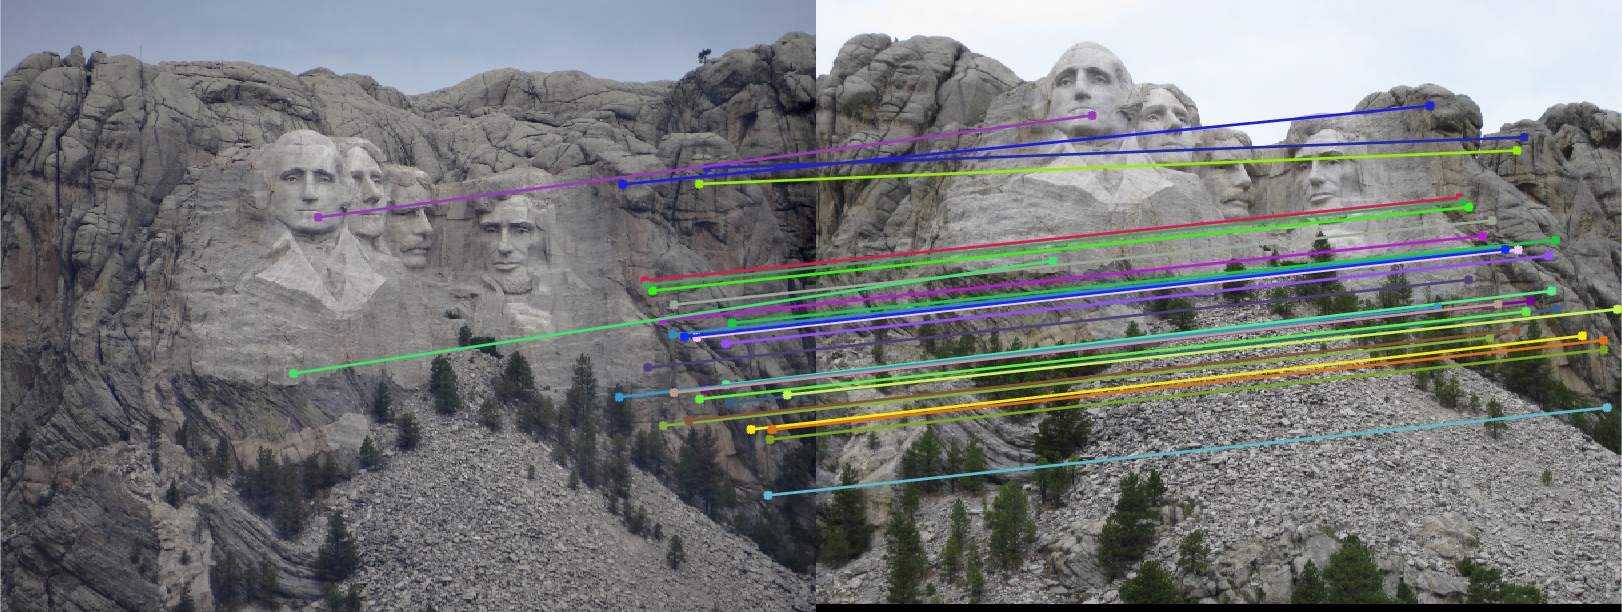
Our assumption seems to be correct as it is hard to discern any errors between the two pairs here.
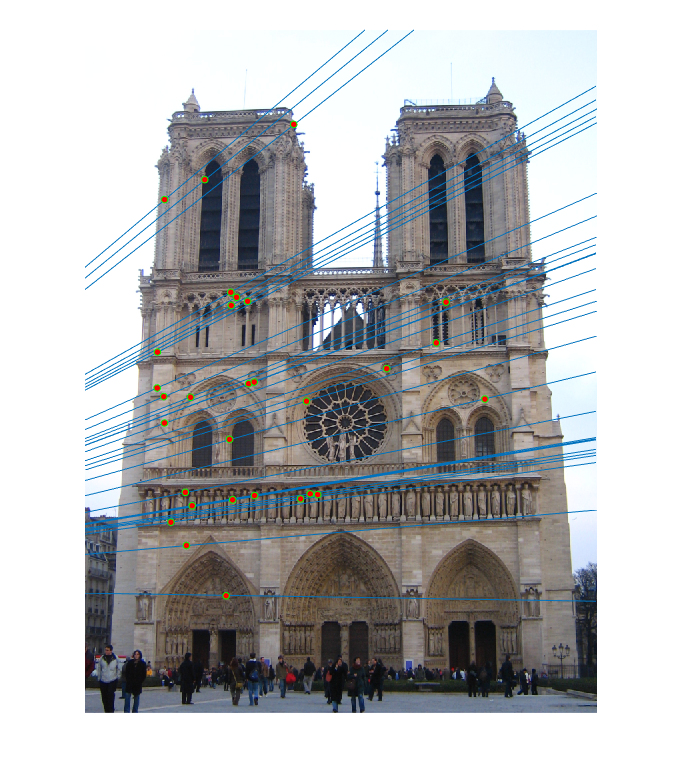
For the other pairs, results were not always as good. While the Notre Dame pair below featured better accuracy than the Rushmore images above, the pair for Gaudi was much worse. As you'll see, there are some clearly wrong epipolar lines on Gaudi, which the pairs before did not have.
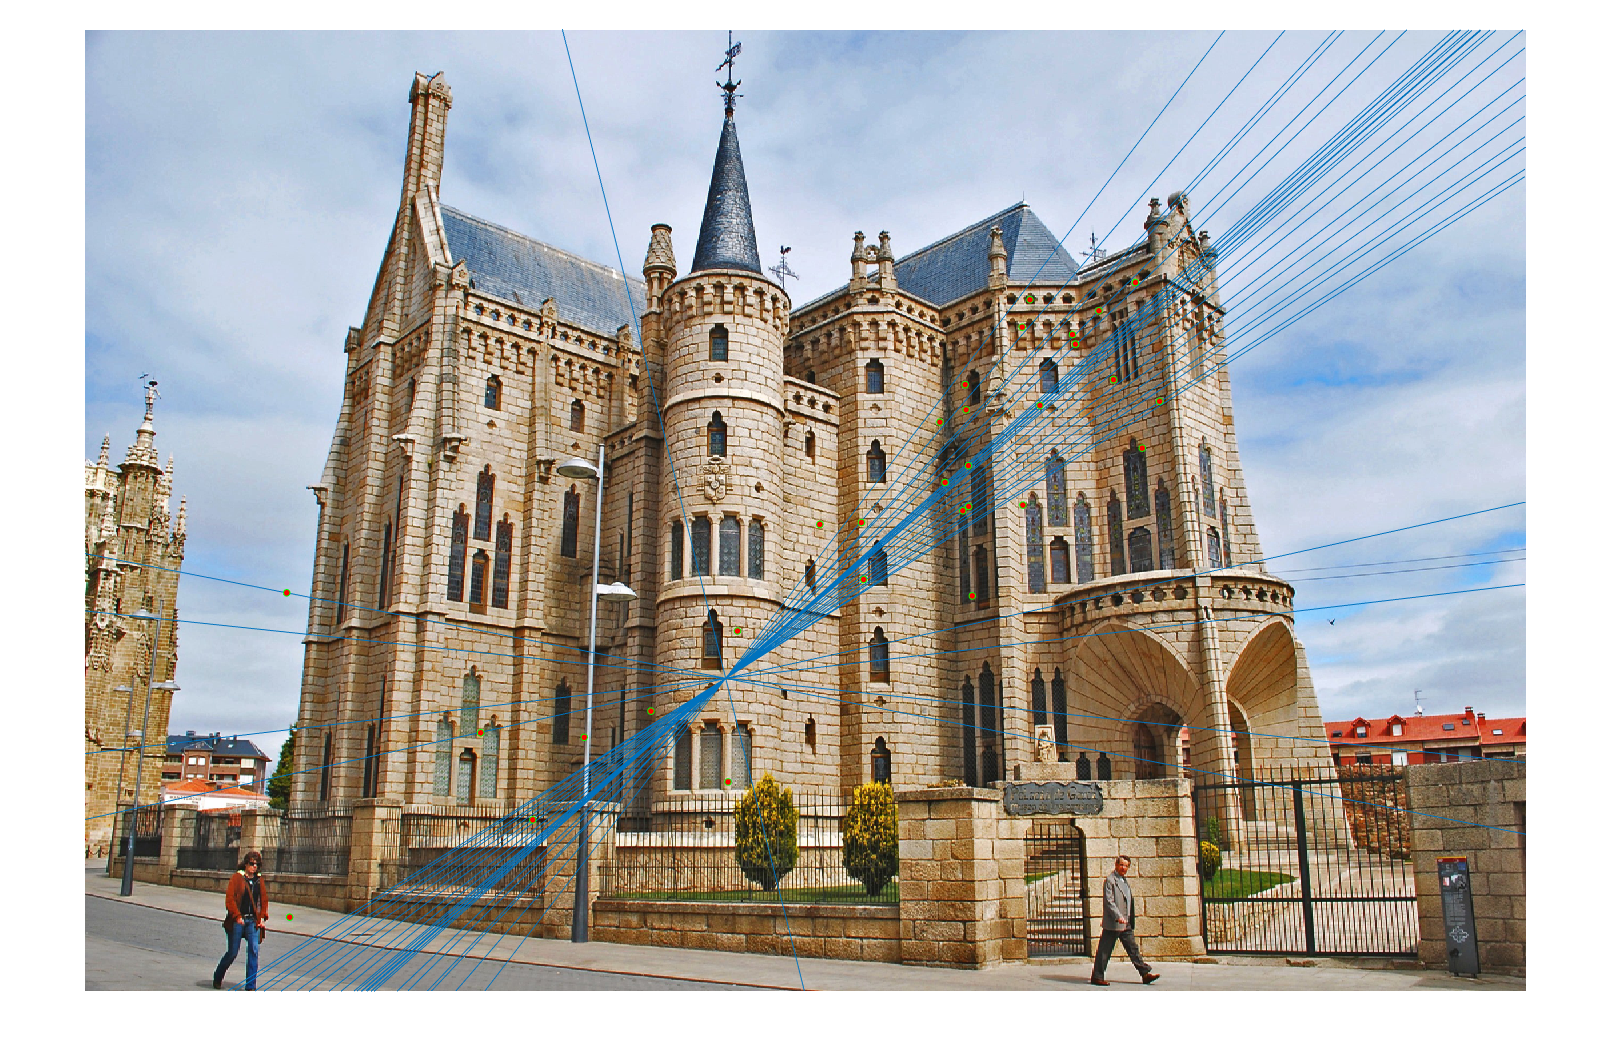
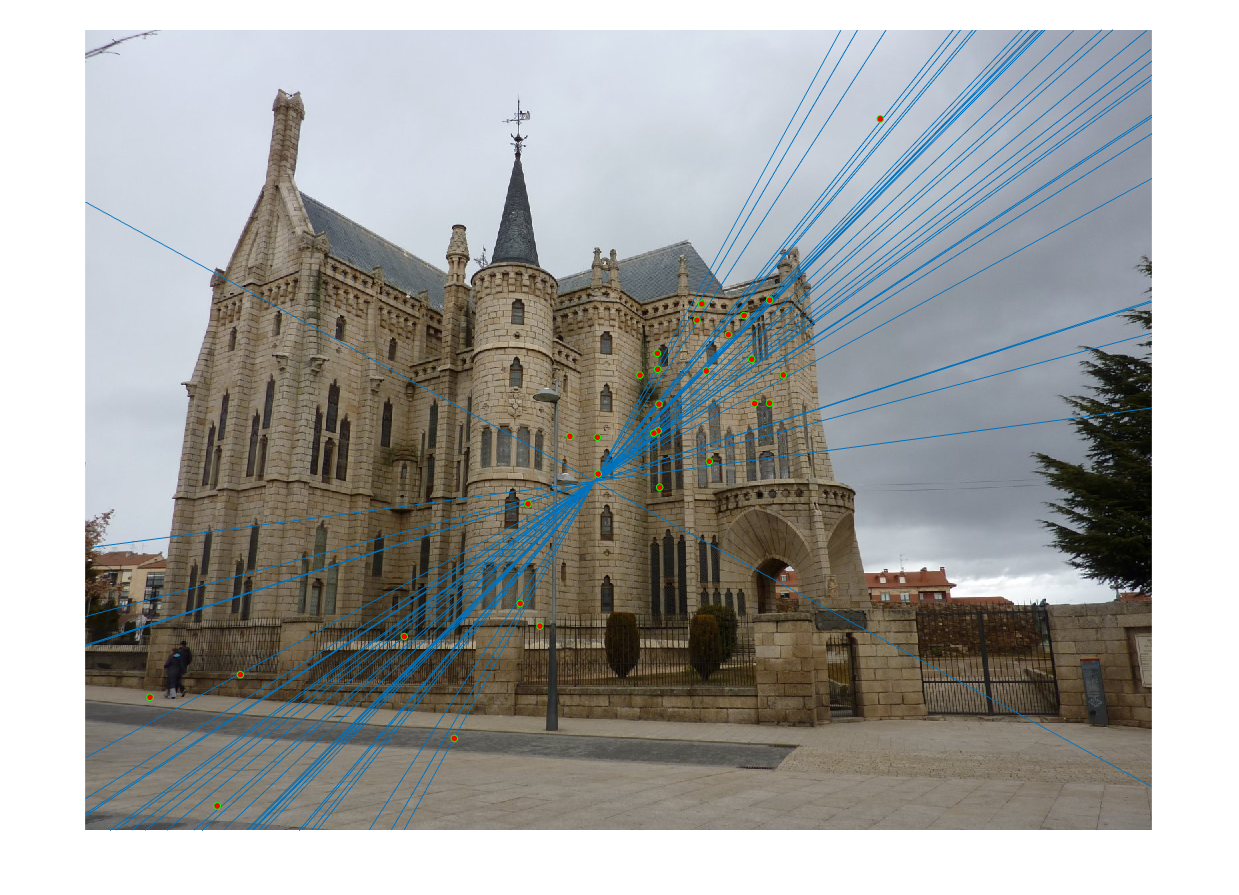
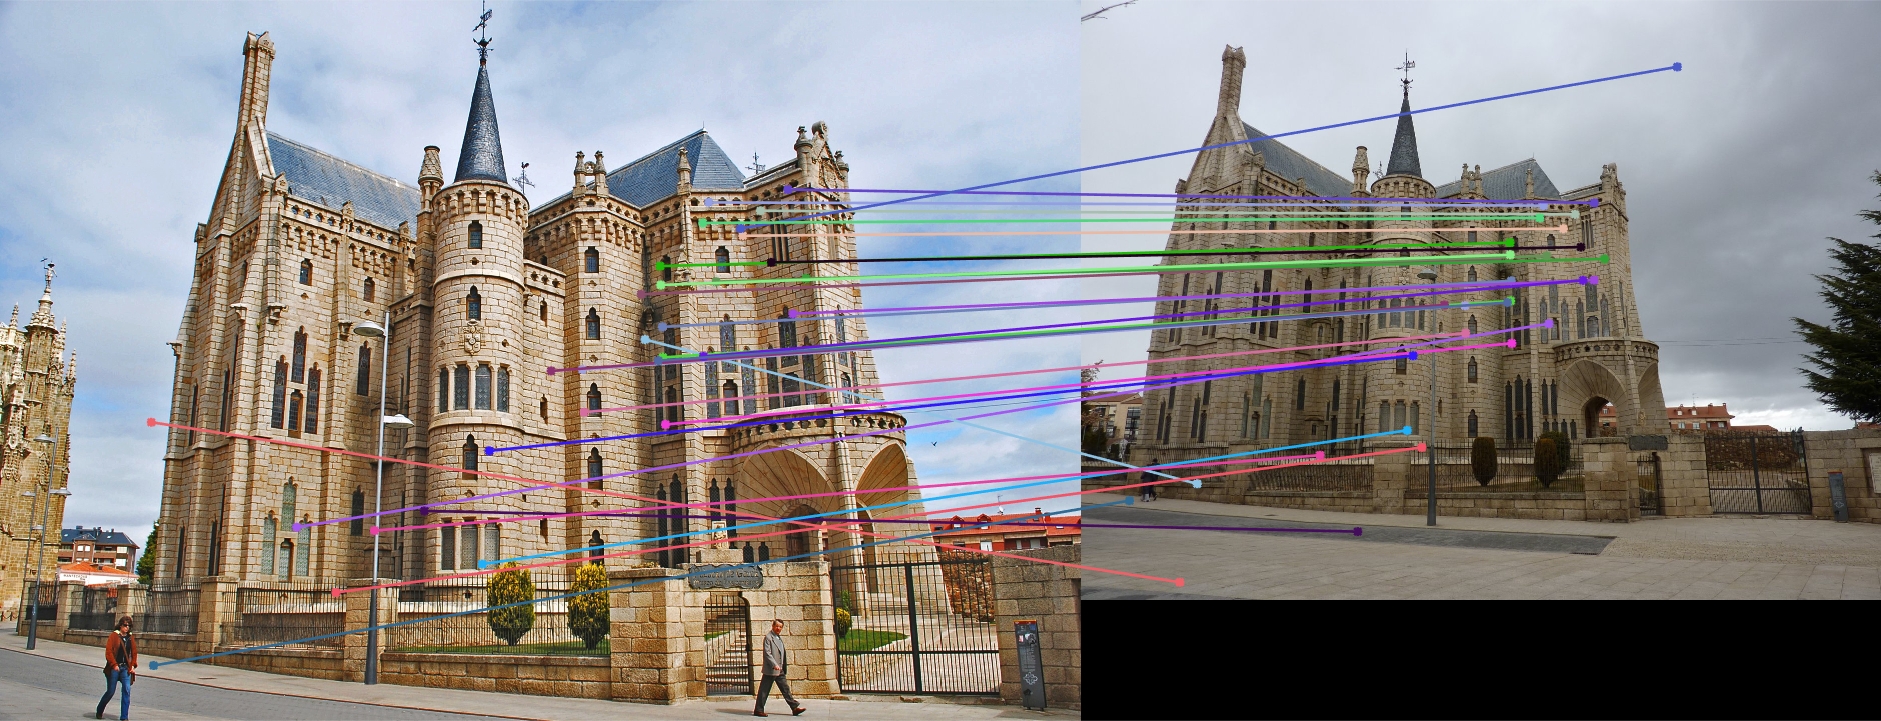
Finally, I'd like to conclude with talking about variance which I observed with RANSAC. Variance, loosely, is a measure of how much the model will change when you run the algorithm multiple times. Generally, as the models get worse accuracy, their variance increases as well. For example, on the Gaudi pair each time the algorithm was run I could get very different final models, some more accurate than others. The RANSAC algorithm ultimately has two different parameters: number of iterations and inlier cut-off point. For the number of iterations, there is a well-defined theoretical number for how many iterations should be run through for a pair of images based on the estimated percentage of outliers. This is because the more outliers there are, the more different "bad" models which will incorporate one or more of these outliers. As such, increasing iterations can reduce variance but at an obvious increase in time. What I discovered during this is that the threshold parameter can actually both increase and decrease variance for models if it's too big or too small. If the threshold is too large, then some noisy points will be unnecessarily labelled as inliers and the model will both suffer and vary highly. However, a small threshold can also mess up variance as it'll become more discriminating of the small noise that necessarily comes from different cameras and different angles. As such, tuning this threshold was a difficult task and optimally should be adapted on an image-by-image basis.