Project 3 / Camera Calibration and Fundamental Matrix Estimation with RANSAC
This computer vision project involved finding both the camera projection matrix which maps 3D world coordinates to image coordinates and the fundamental matrix which maps points to epipolar lines in a pair of images. At first we used points that we assumed were correct to find the fundamental matrix, and then later ran RANSAC over a set of matched points output by a SIFT pipeline similar to what we implemented in project 2. The final part (which was extra credit) involved modifying part 2 to normalize the points to get better results when calculating fundamental matrices.
Part I: Camera Projection Matrix:
The first part of the project involved finding the Camera Project Matrix. This part was fairly straightforward, as I was simply implementing the algorithm as described in the book and slides. Finding the camera projection matrix just boils down to solving a linear regression problem once everything is set up. As you can see below, the results from this step are fairly good, with the difference between actual and projected points being very small. The small inaccuracies here may be due to distortion, which occurs because the pinhole camera model is not accurate for modern cameras. Overall the results are very good. I've included the numerical results below.
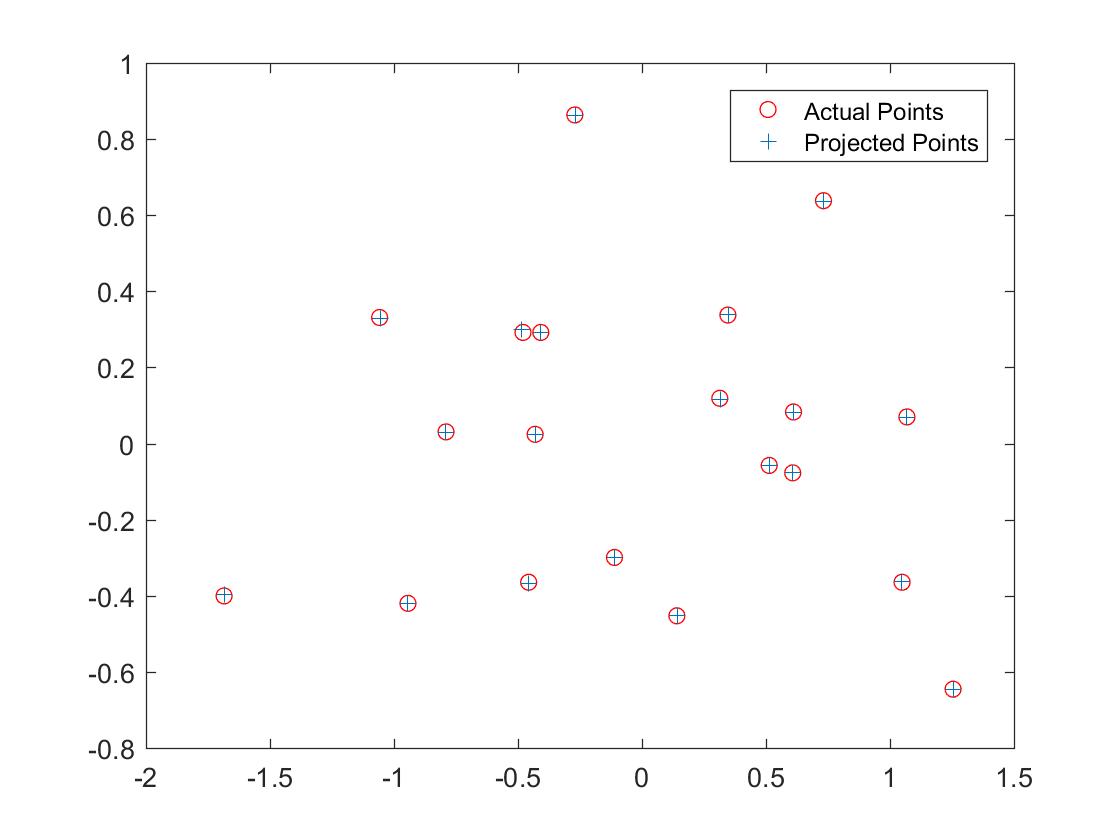
The projection matrix was estimated to be the following:
< 0.4583, -0.2947, -0.0140, 0.0040;-0.0509, -0.0546, -0.5411, -0.0524;
0.1090, 0.1783, -0.0443, 0.5968;>
The camera center was estimated to be the following:
<-1.5127, -2.3517, 0.2826>Part II: Fundamental Matrix Estimation:
The second part of the project, much like the first, was relatively straightforward, and not very open to interpretation. This part of the project involved mapping the points in one image to lines in another by using the fundamental matrix. Given a set of (at least 8) corresponding input points in two images, I just set up a linear regression as described in the book and slides to find the solution. The results here are near perfect (because the input points were guaranteed to all be correct), so I will refrain from including an image here. Here are the numerical results:
The fundamental matrix was estimated to be the following (for the base image pair (pic_a.jpg and pic_b.jpg):
< -0.0000, 0.0000, -0.0006;0.0000, -0.0000, 0.0045;
-0.0000, -0.0062, 0.1446;>
Part III: Fundamental Matrix with RANSAC:
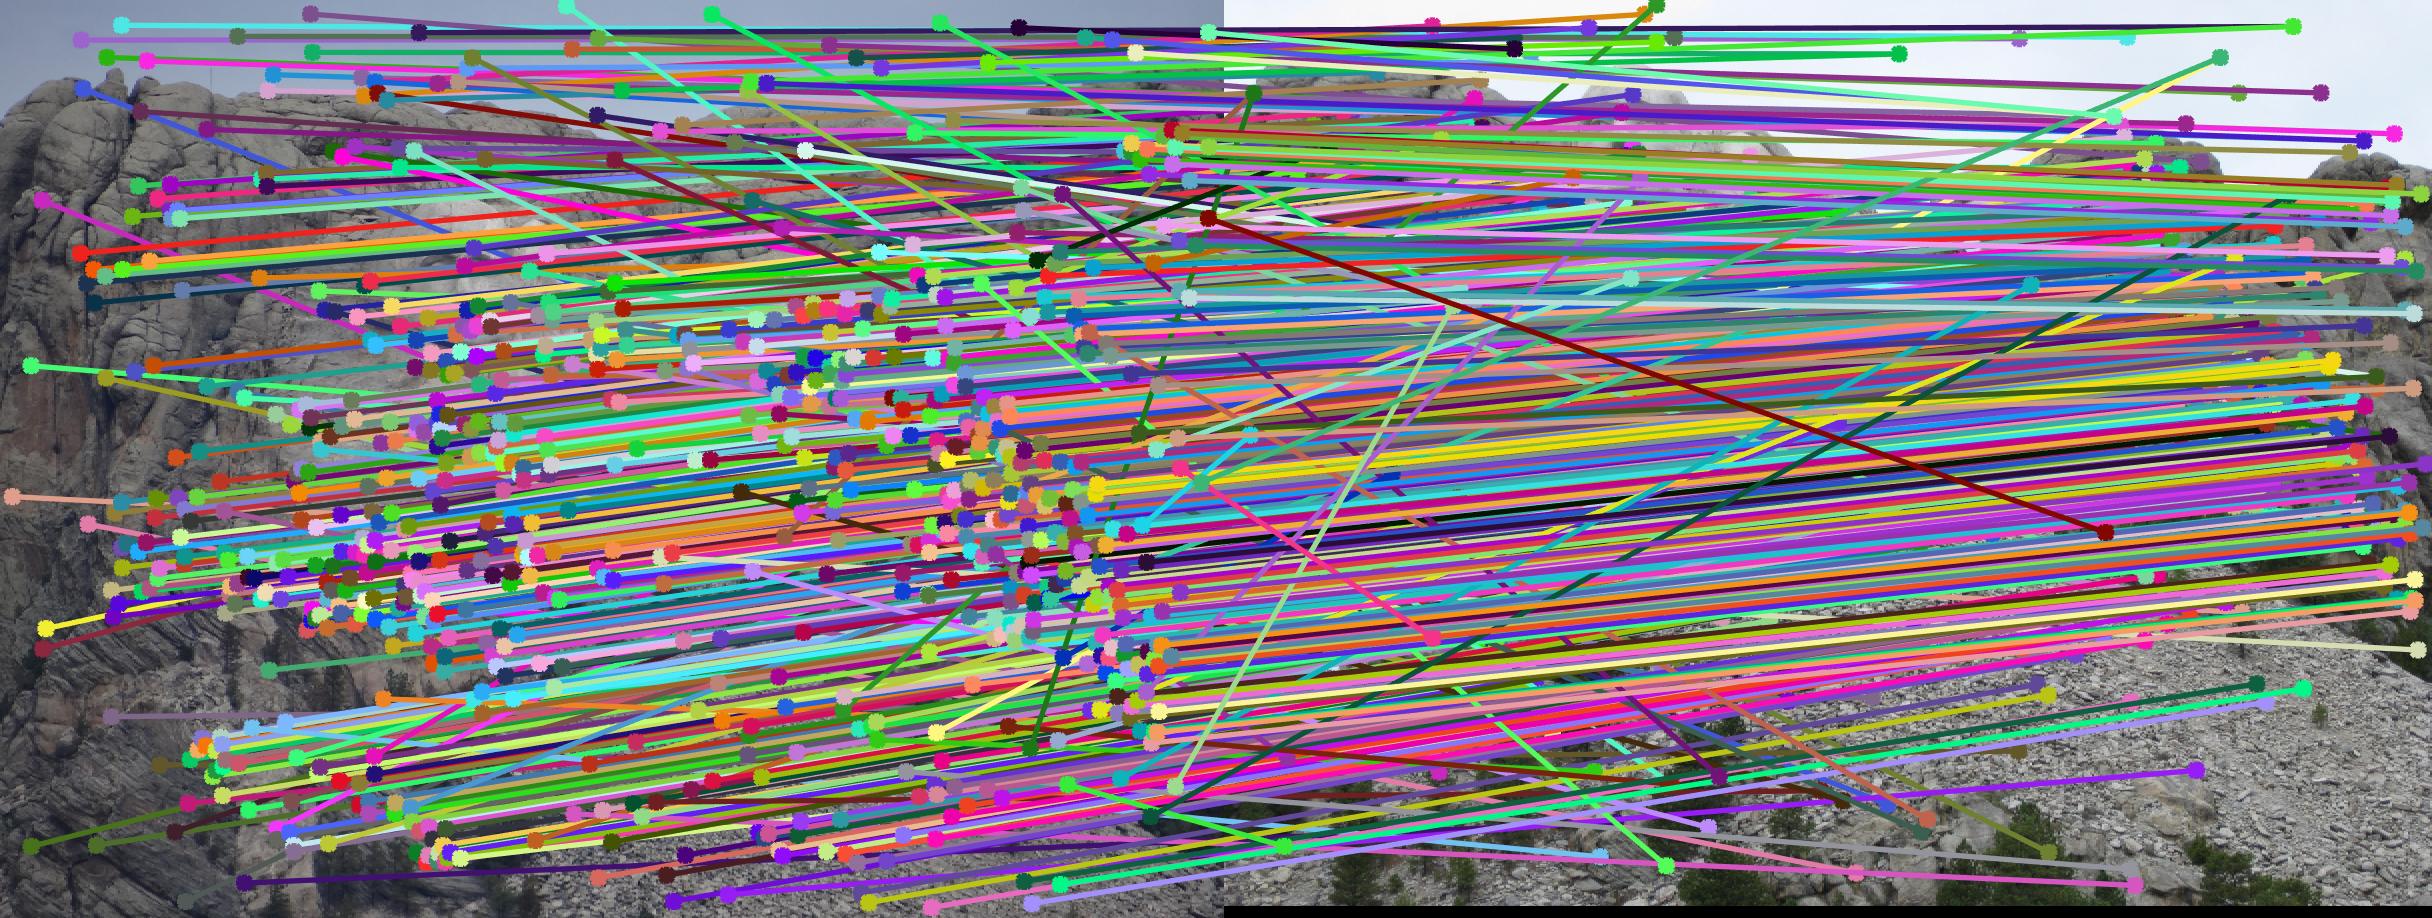
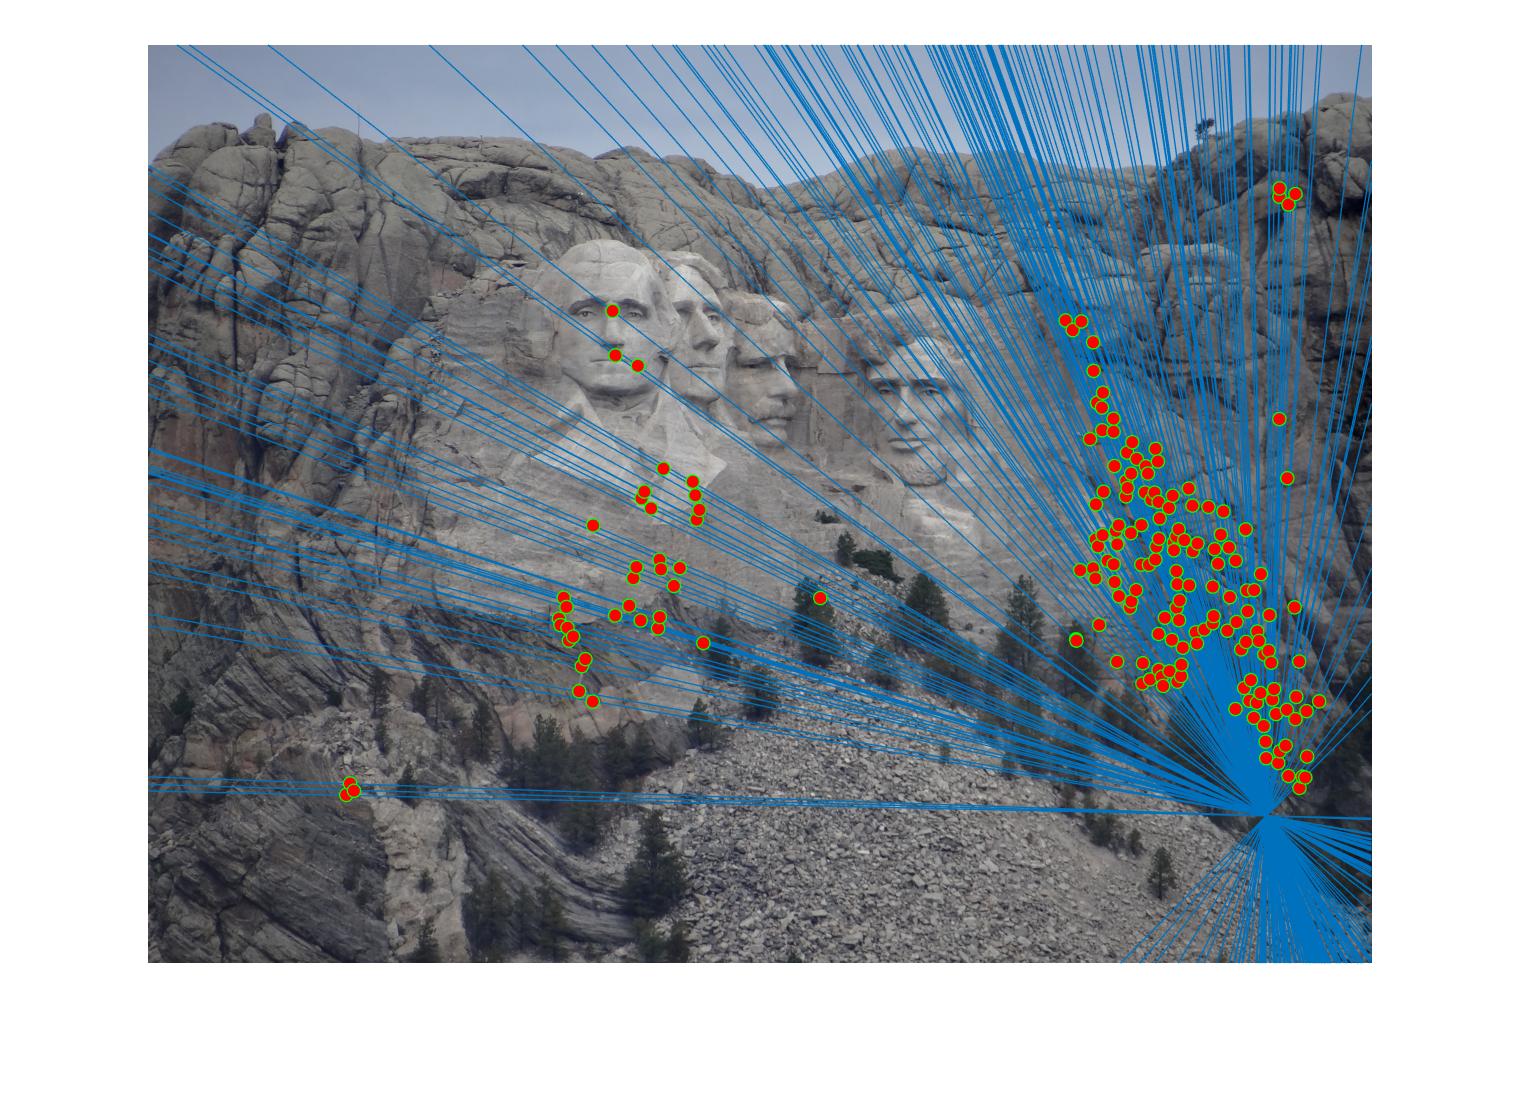
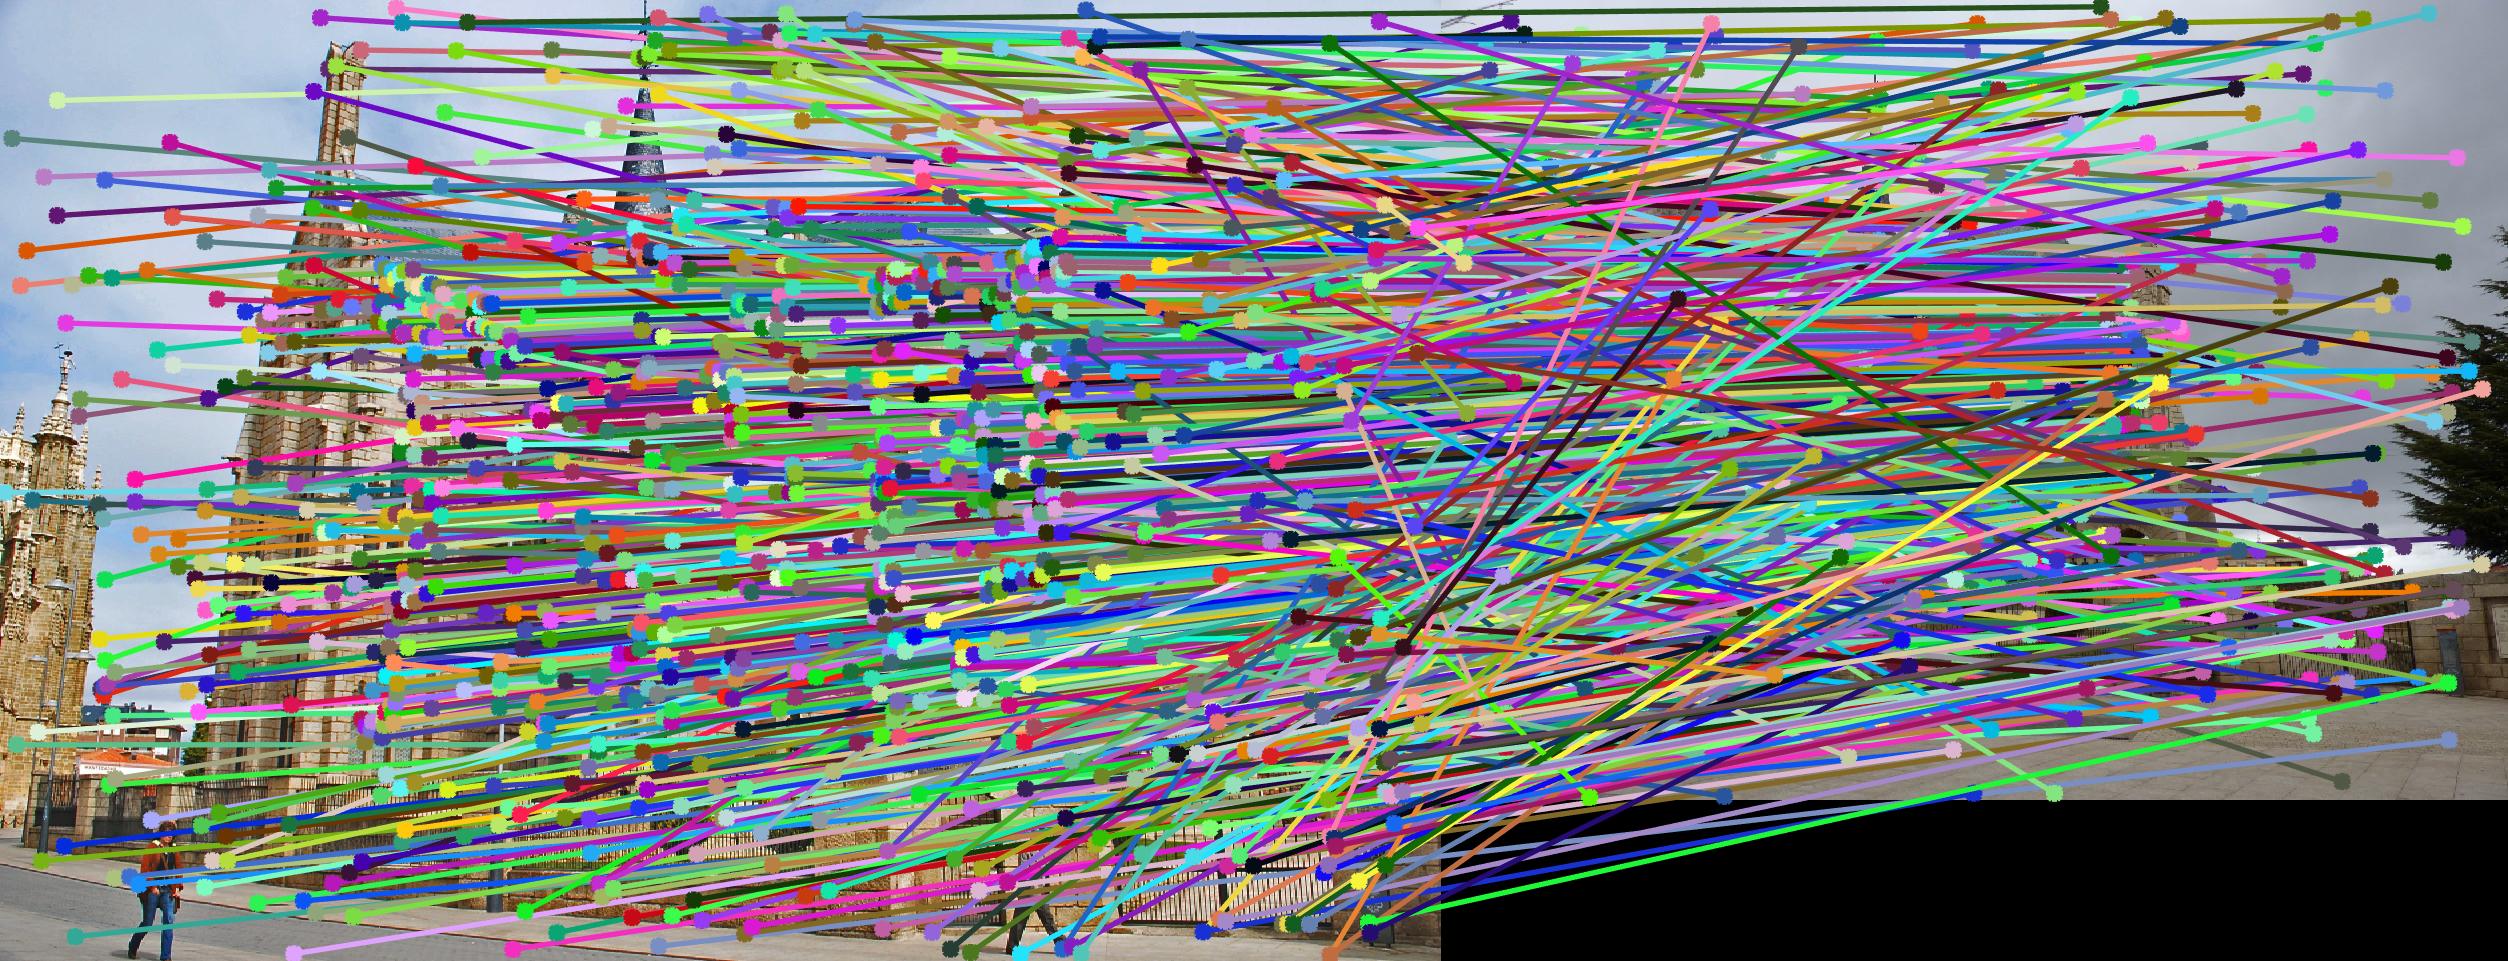
Part three of the project was the most open to interpretation. Given that for two pictures of a scene, a given SIFT pipeline is unlikely to output perfect results, it is necessary to run some kind of algorithm to get rid of outliers (in this case, RANSAC). Implementing RANSAC involved sampling 8 corresponding points from the outputs of a SIFT pipeline and calculating a fundamental matrix. This fundamental matrix is then used to see how many outliers there are in the full set of corresponding points assuming that the fundamental matrix is correct. This is done repeatedly (5000 times in my implementation) and the fundamental matrix with the highest number of inliers is kept and returned. There was mostly just one parameter that I had to find a value for, and that was the cutoff for outliers vs inliers. I experimented and found that setting .005 as the cutoff lead to a good tradeoff between including outliers and excluding too much. Below are the results after part 3 (pre-extra credit).
|

|
|
|
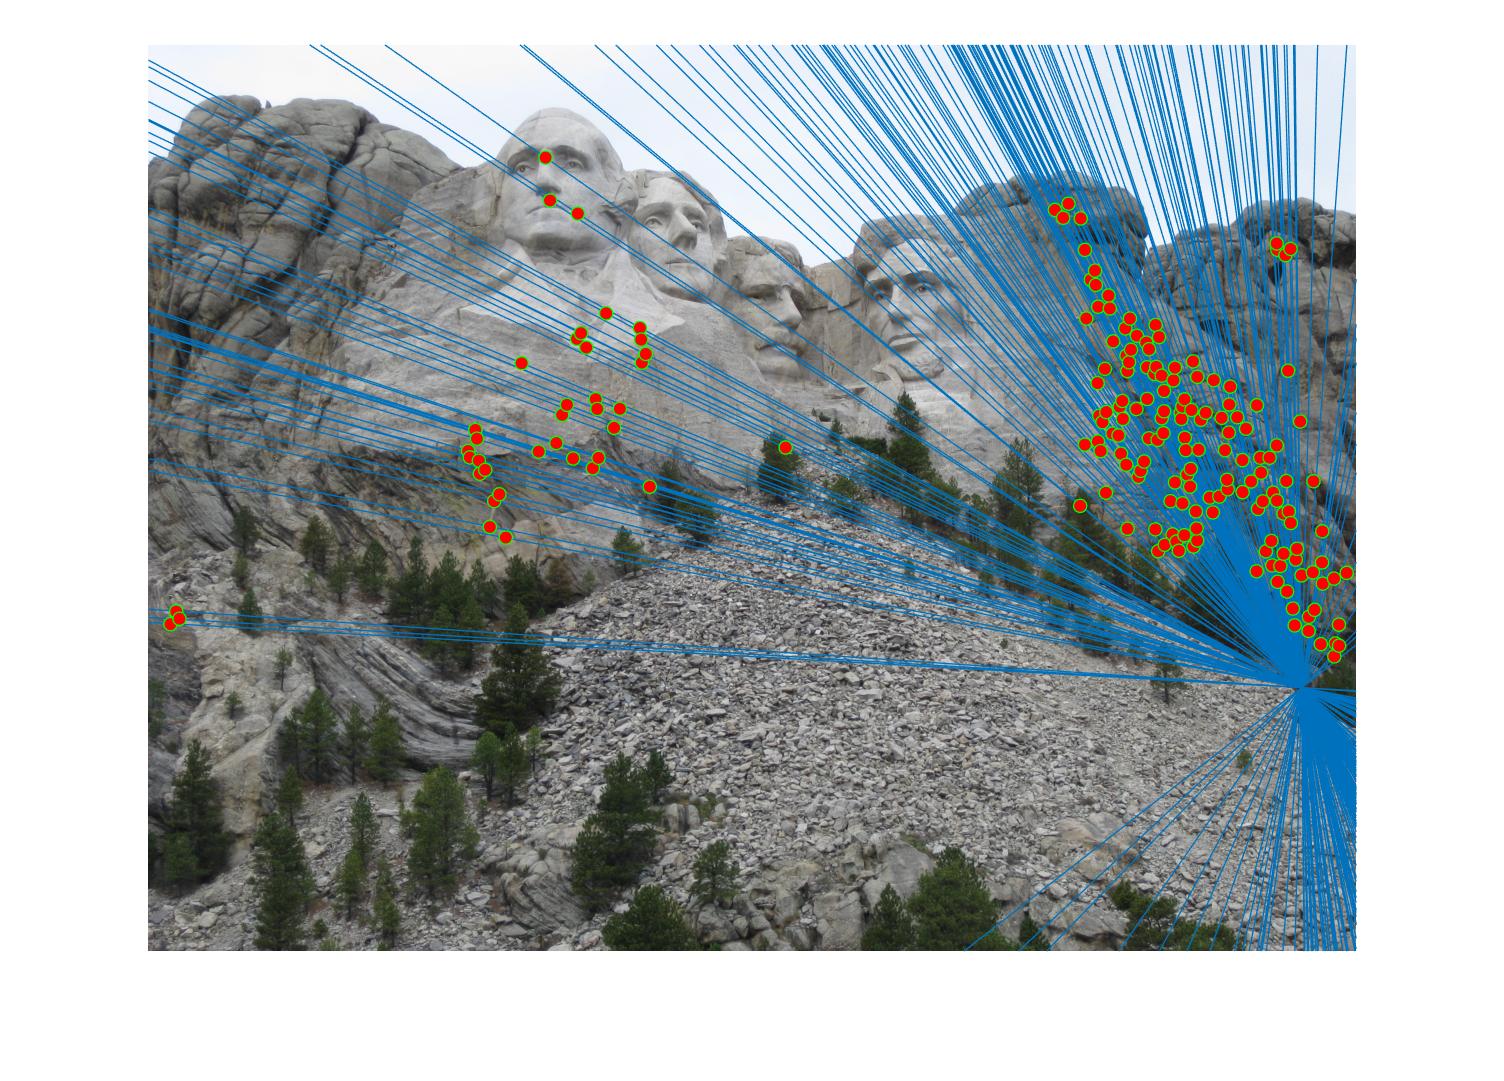
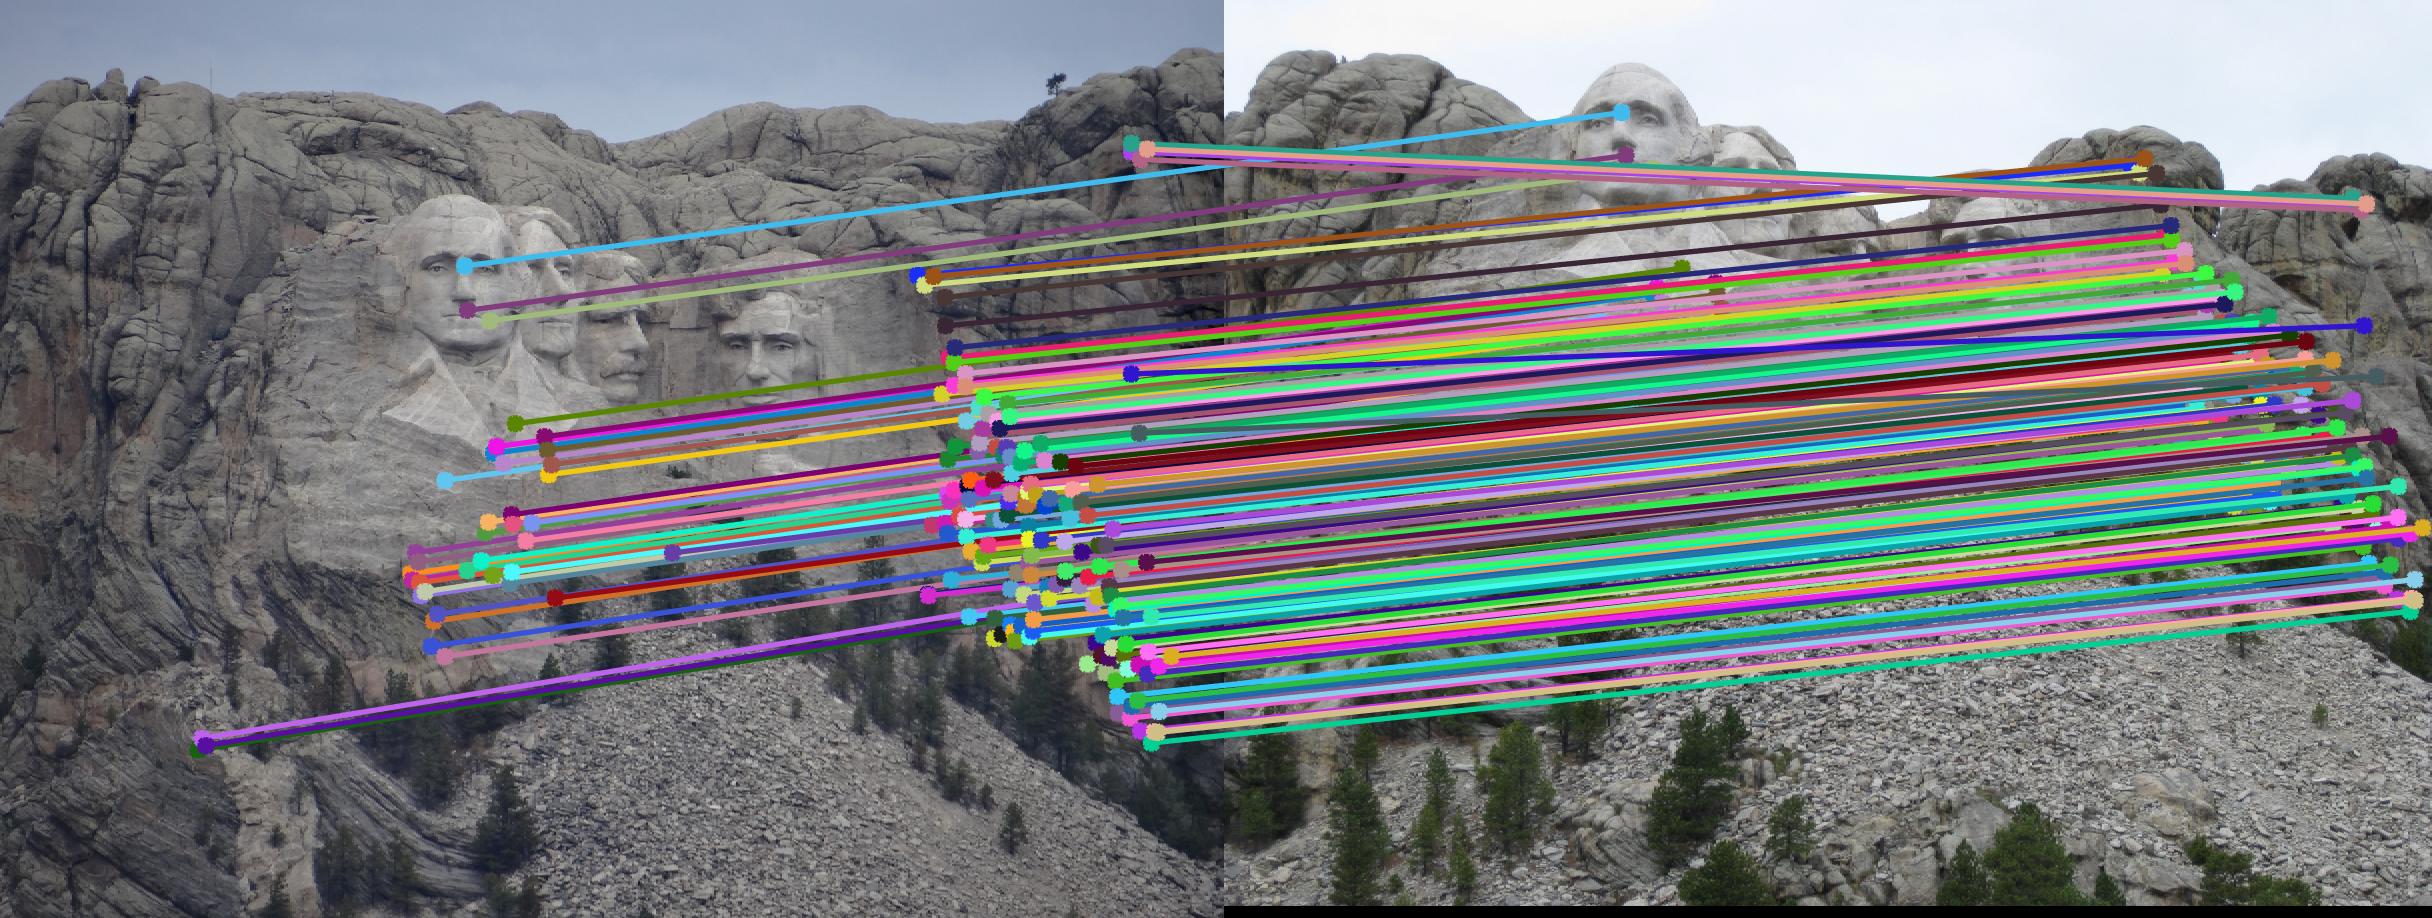
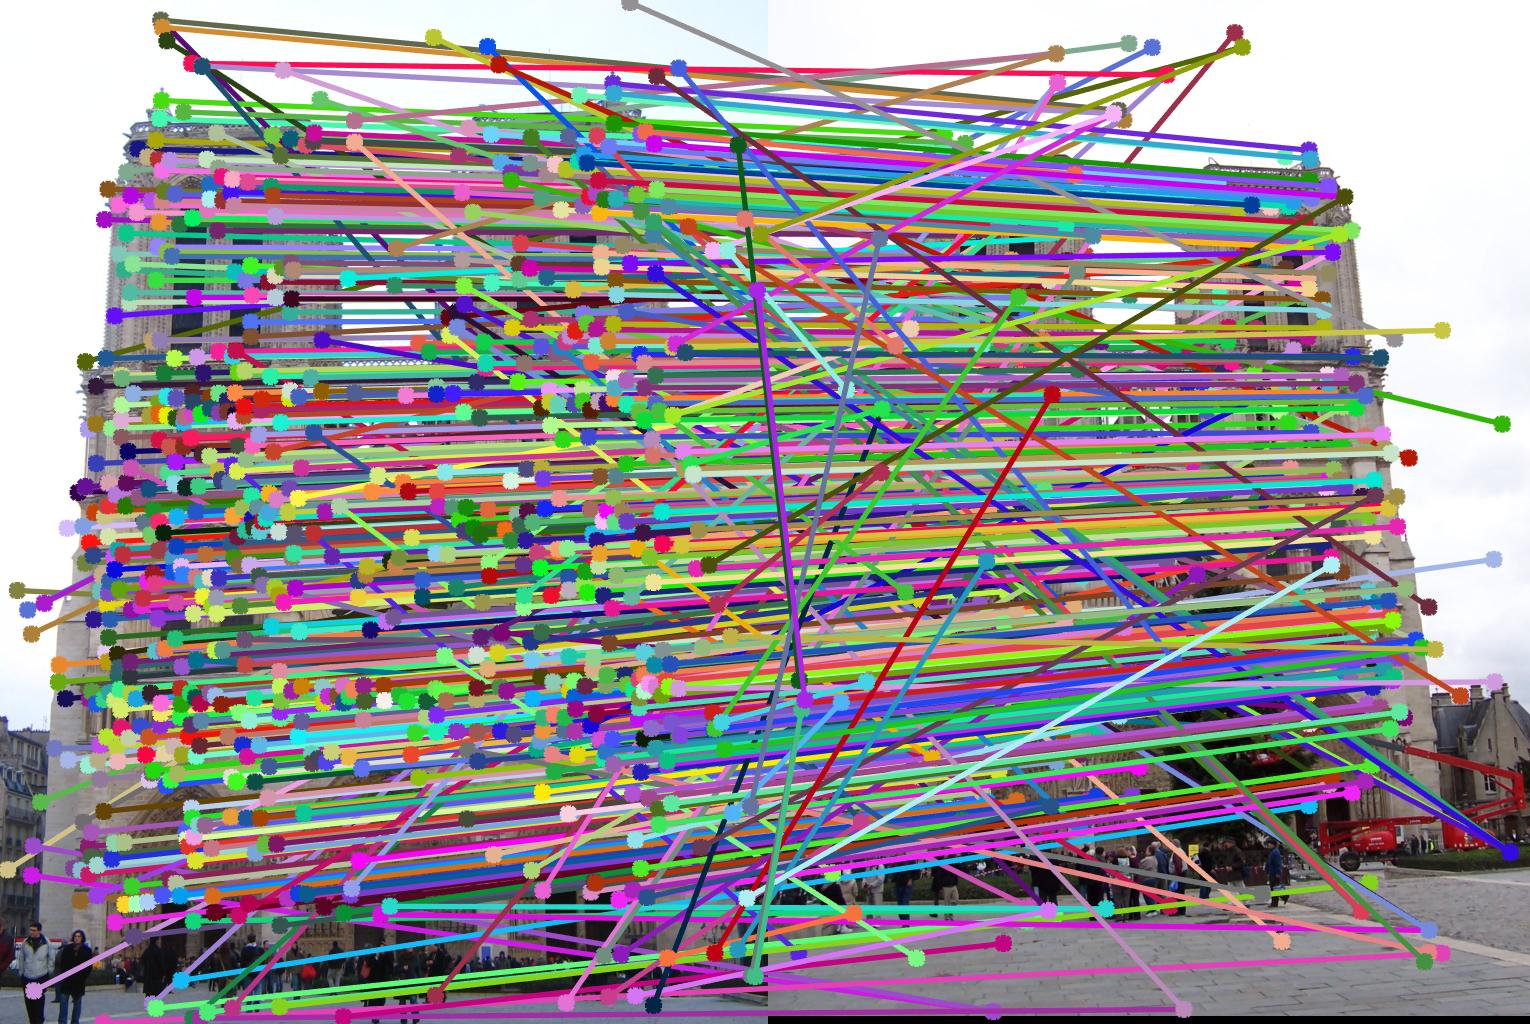
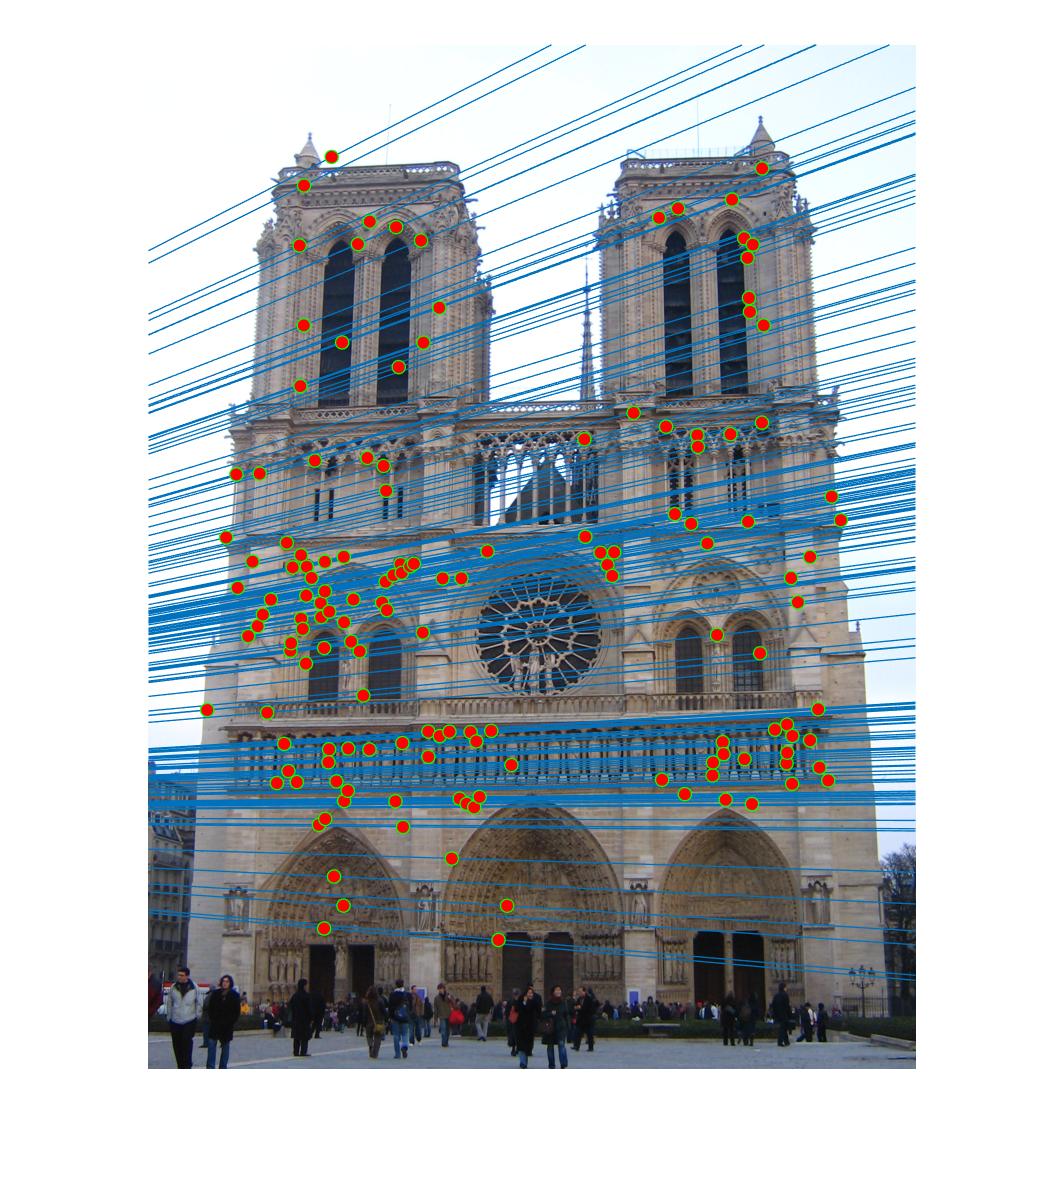
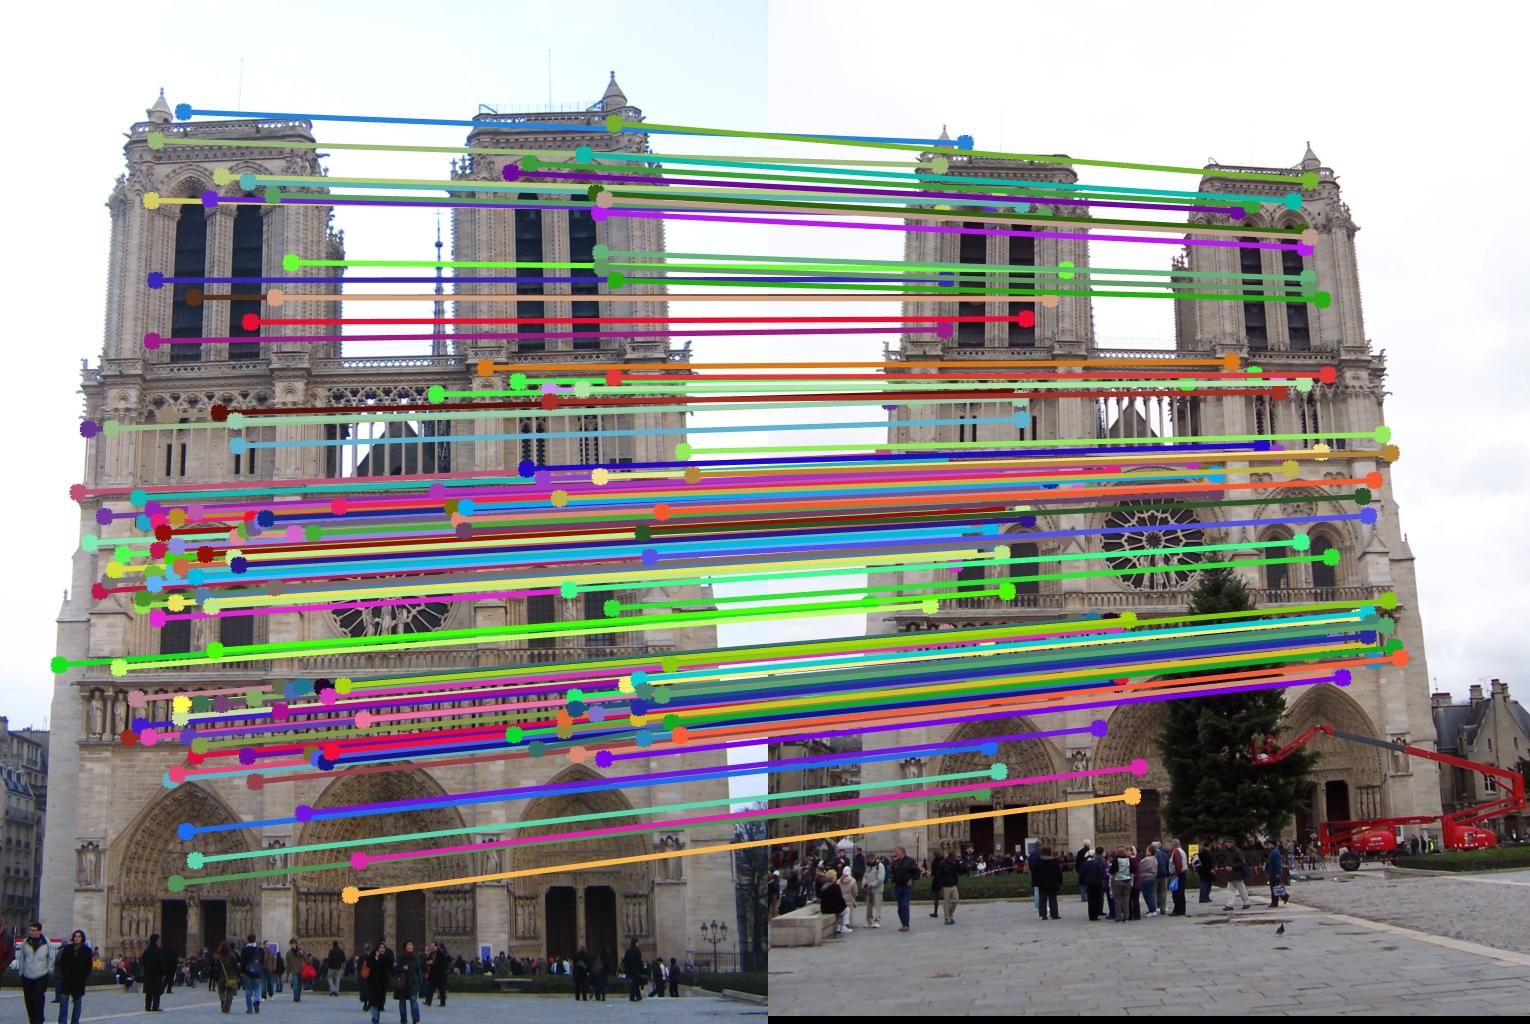
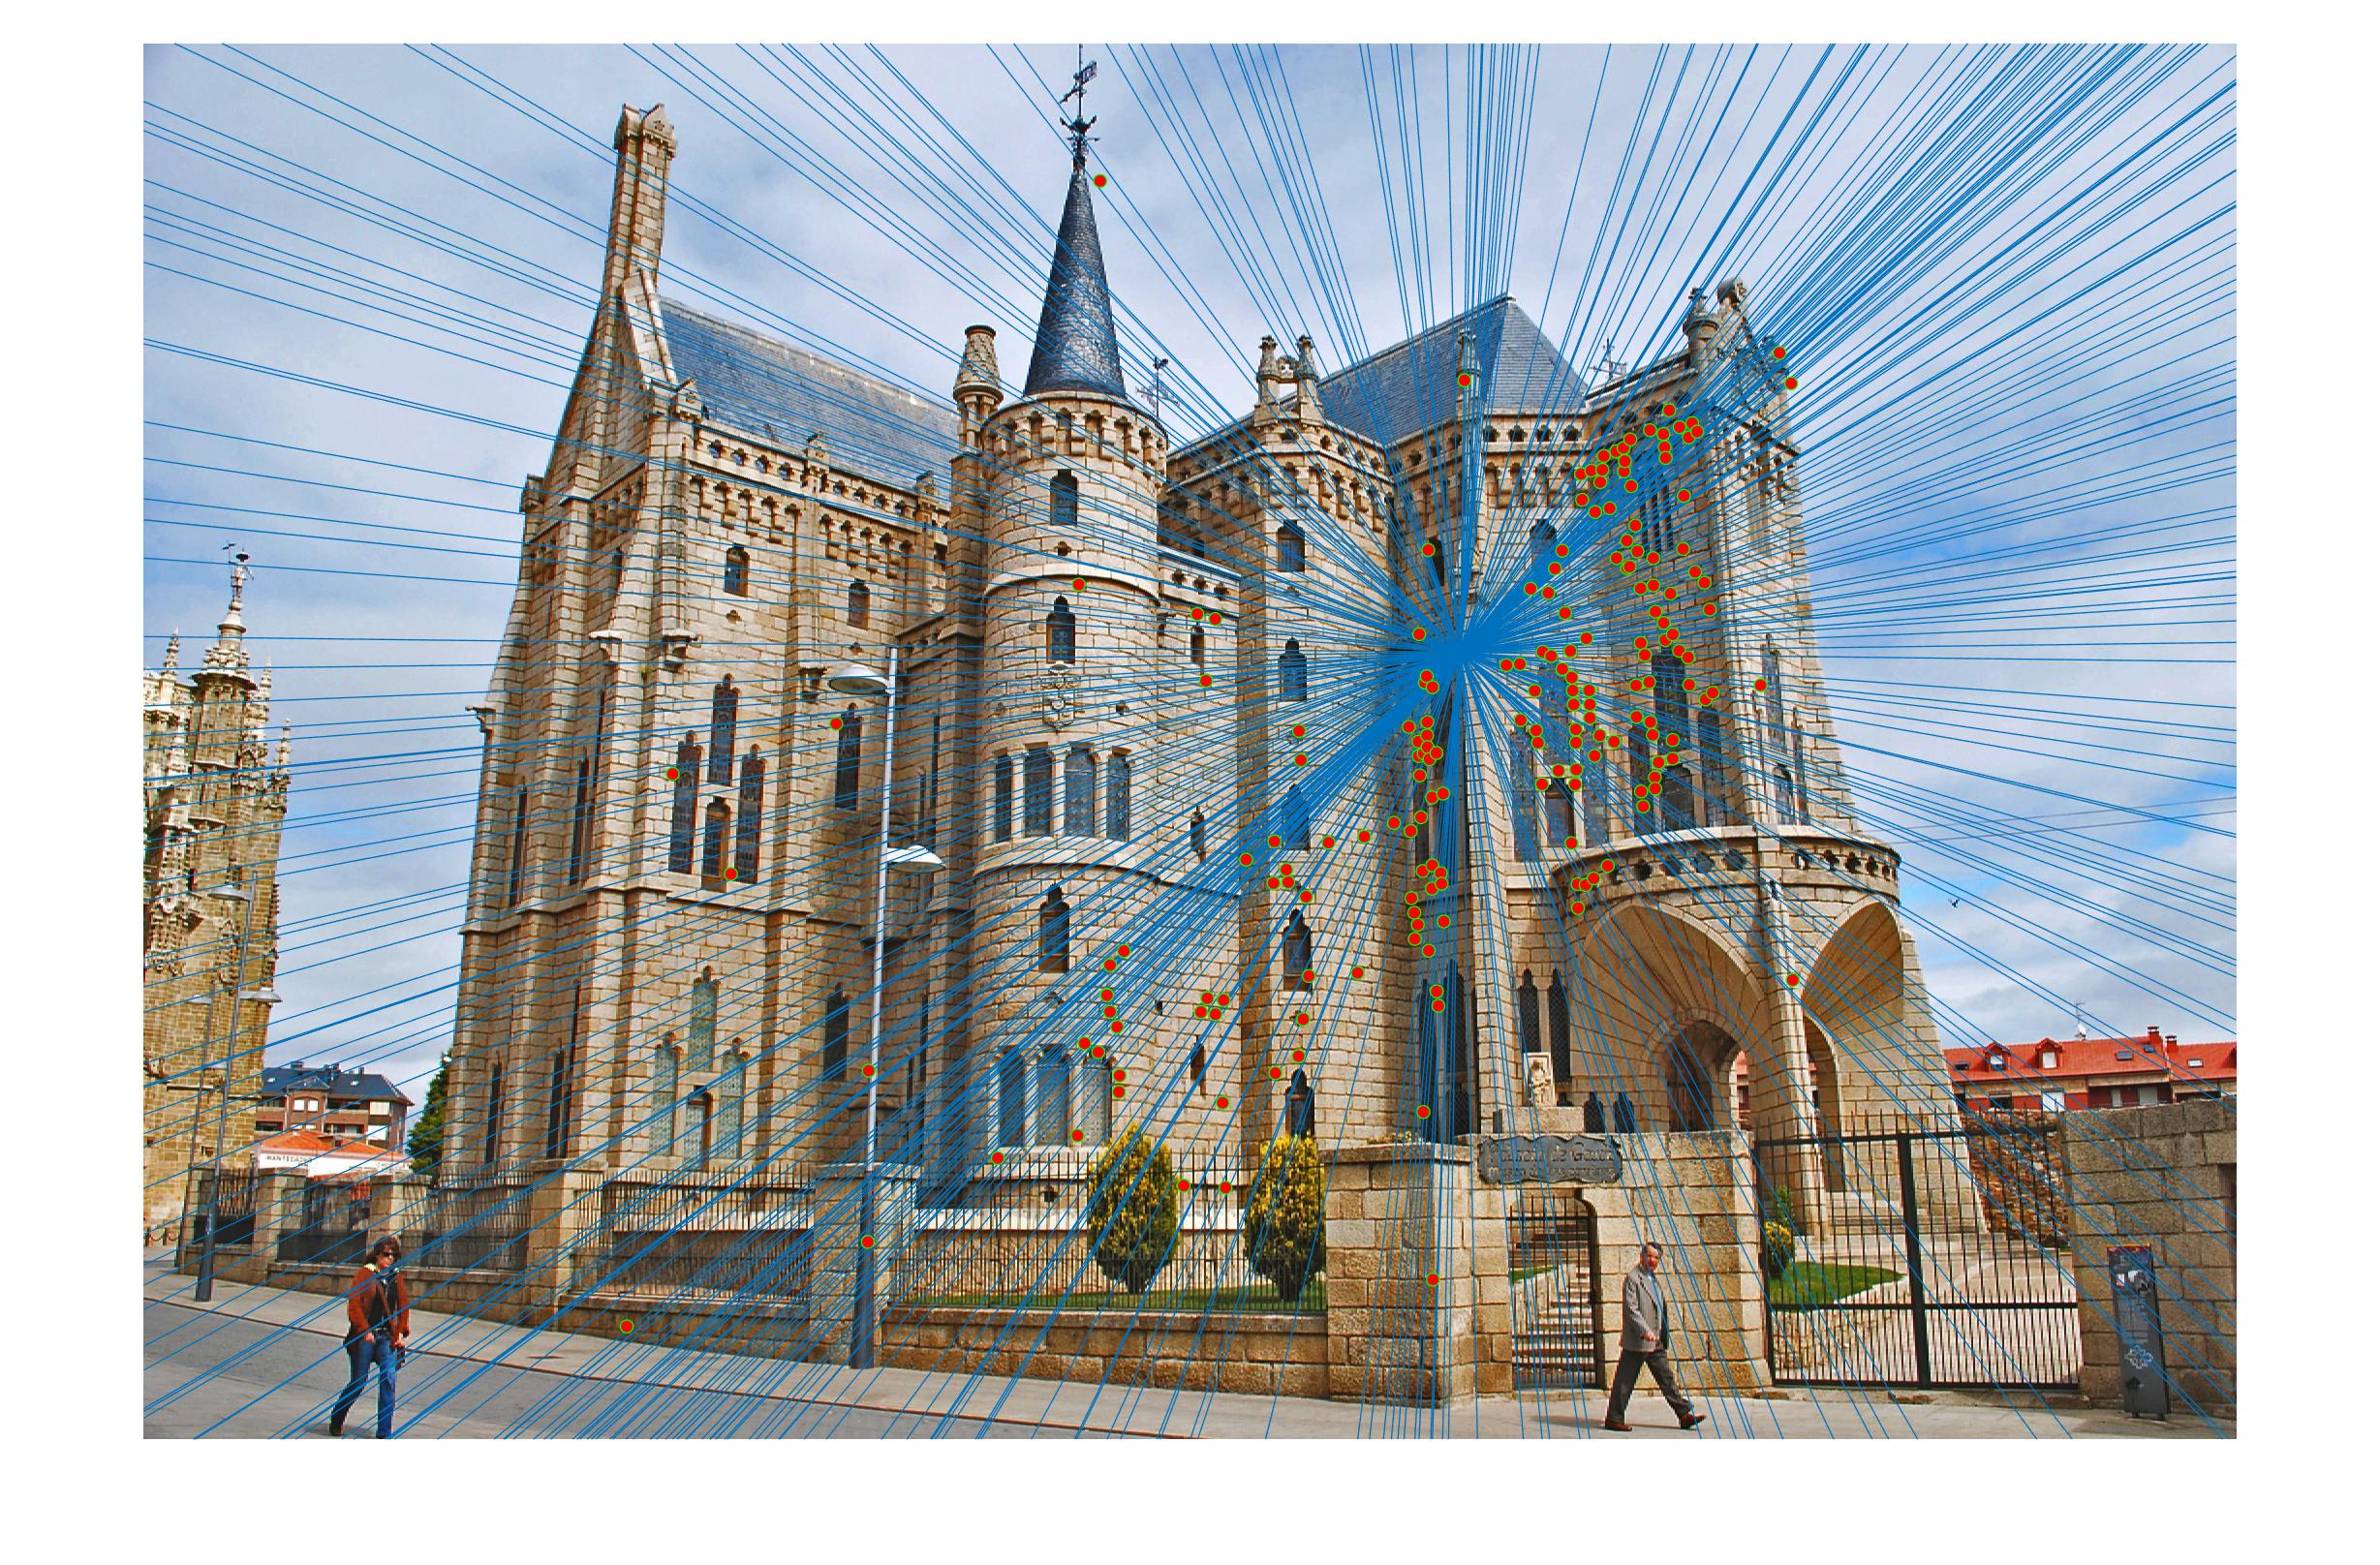
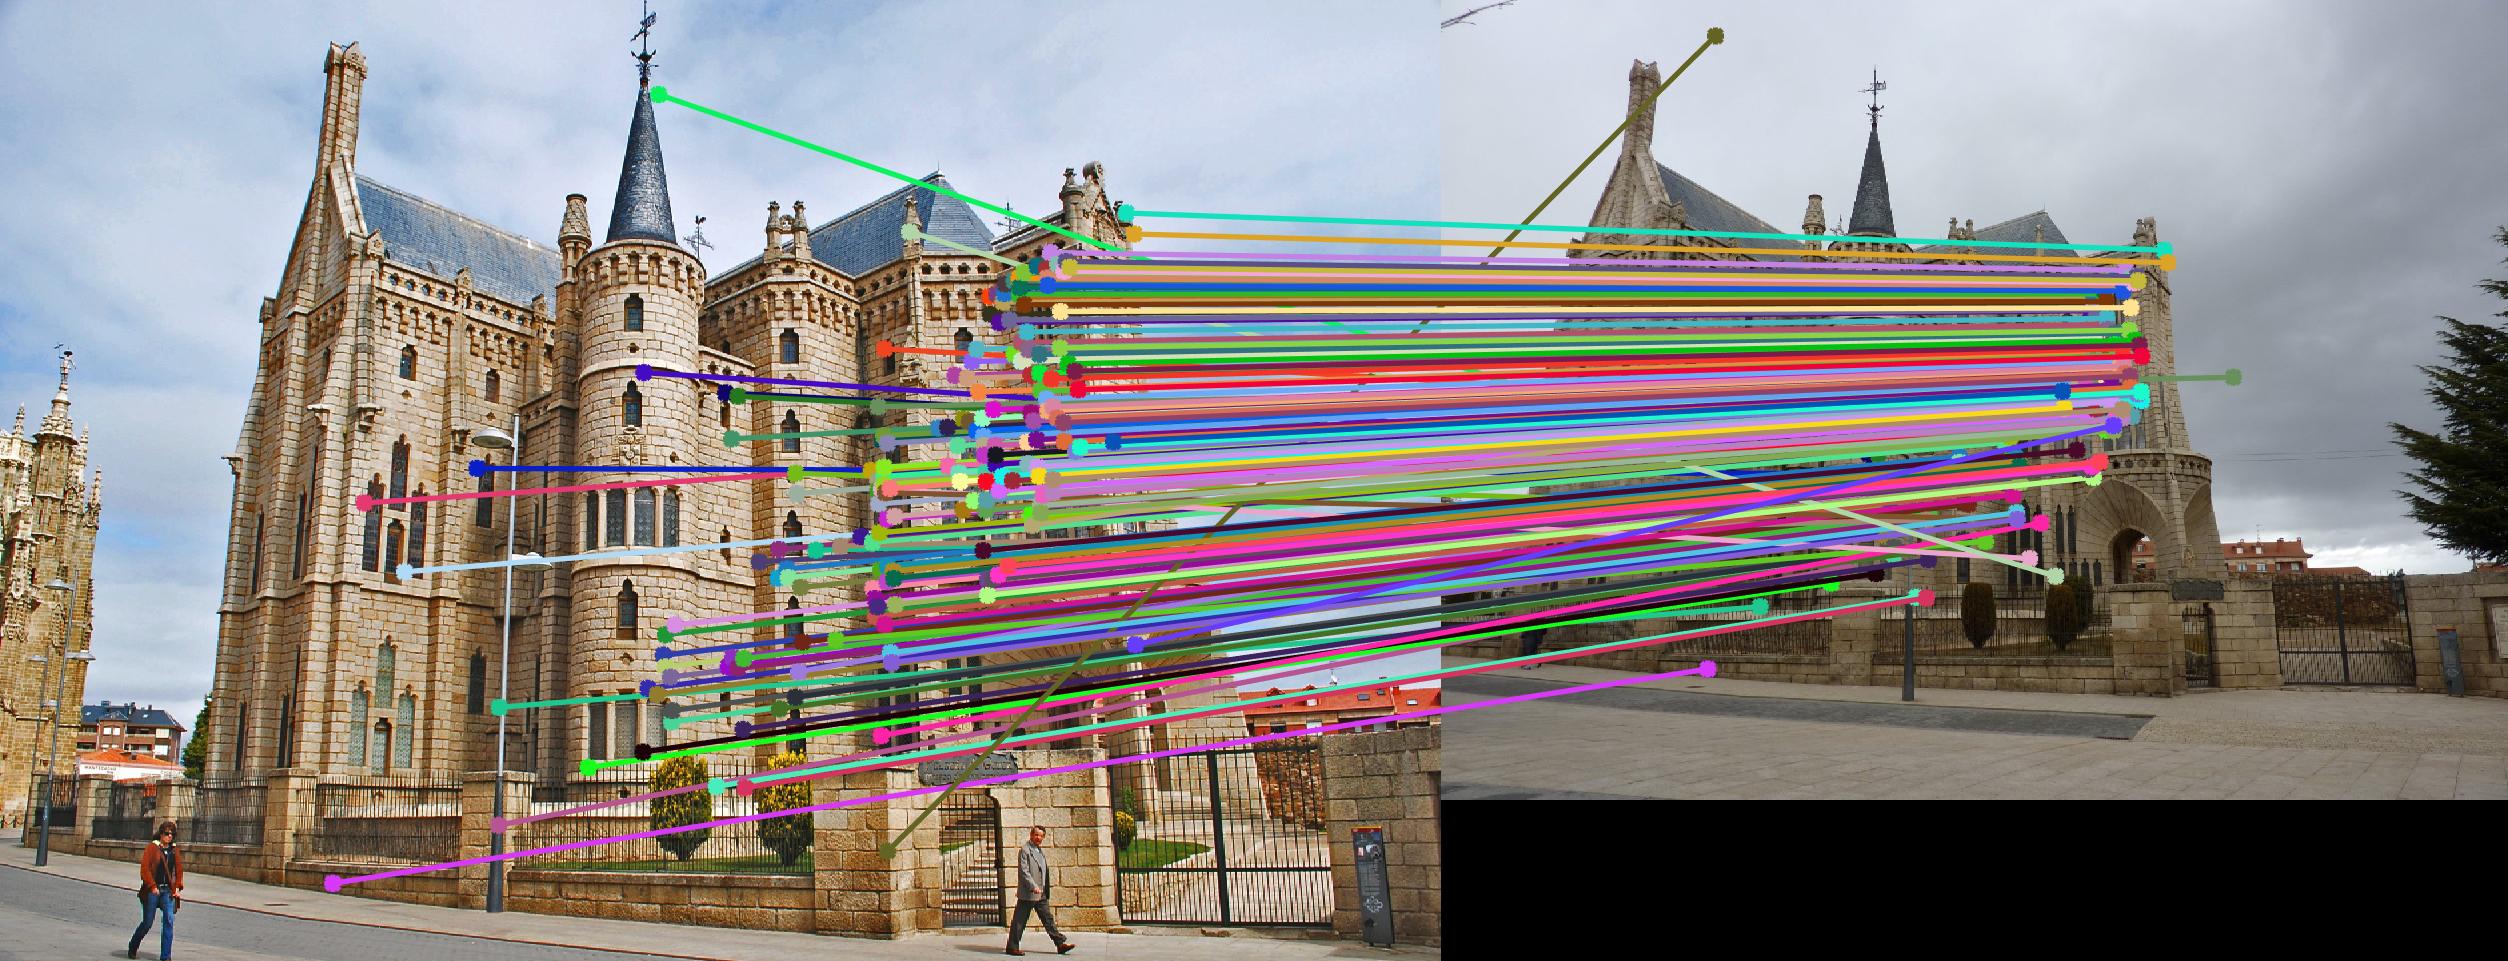
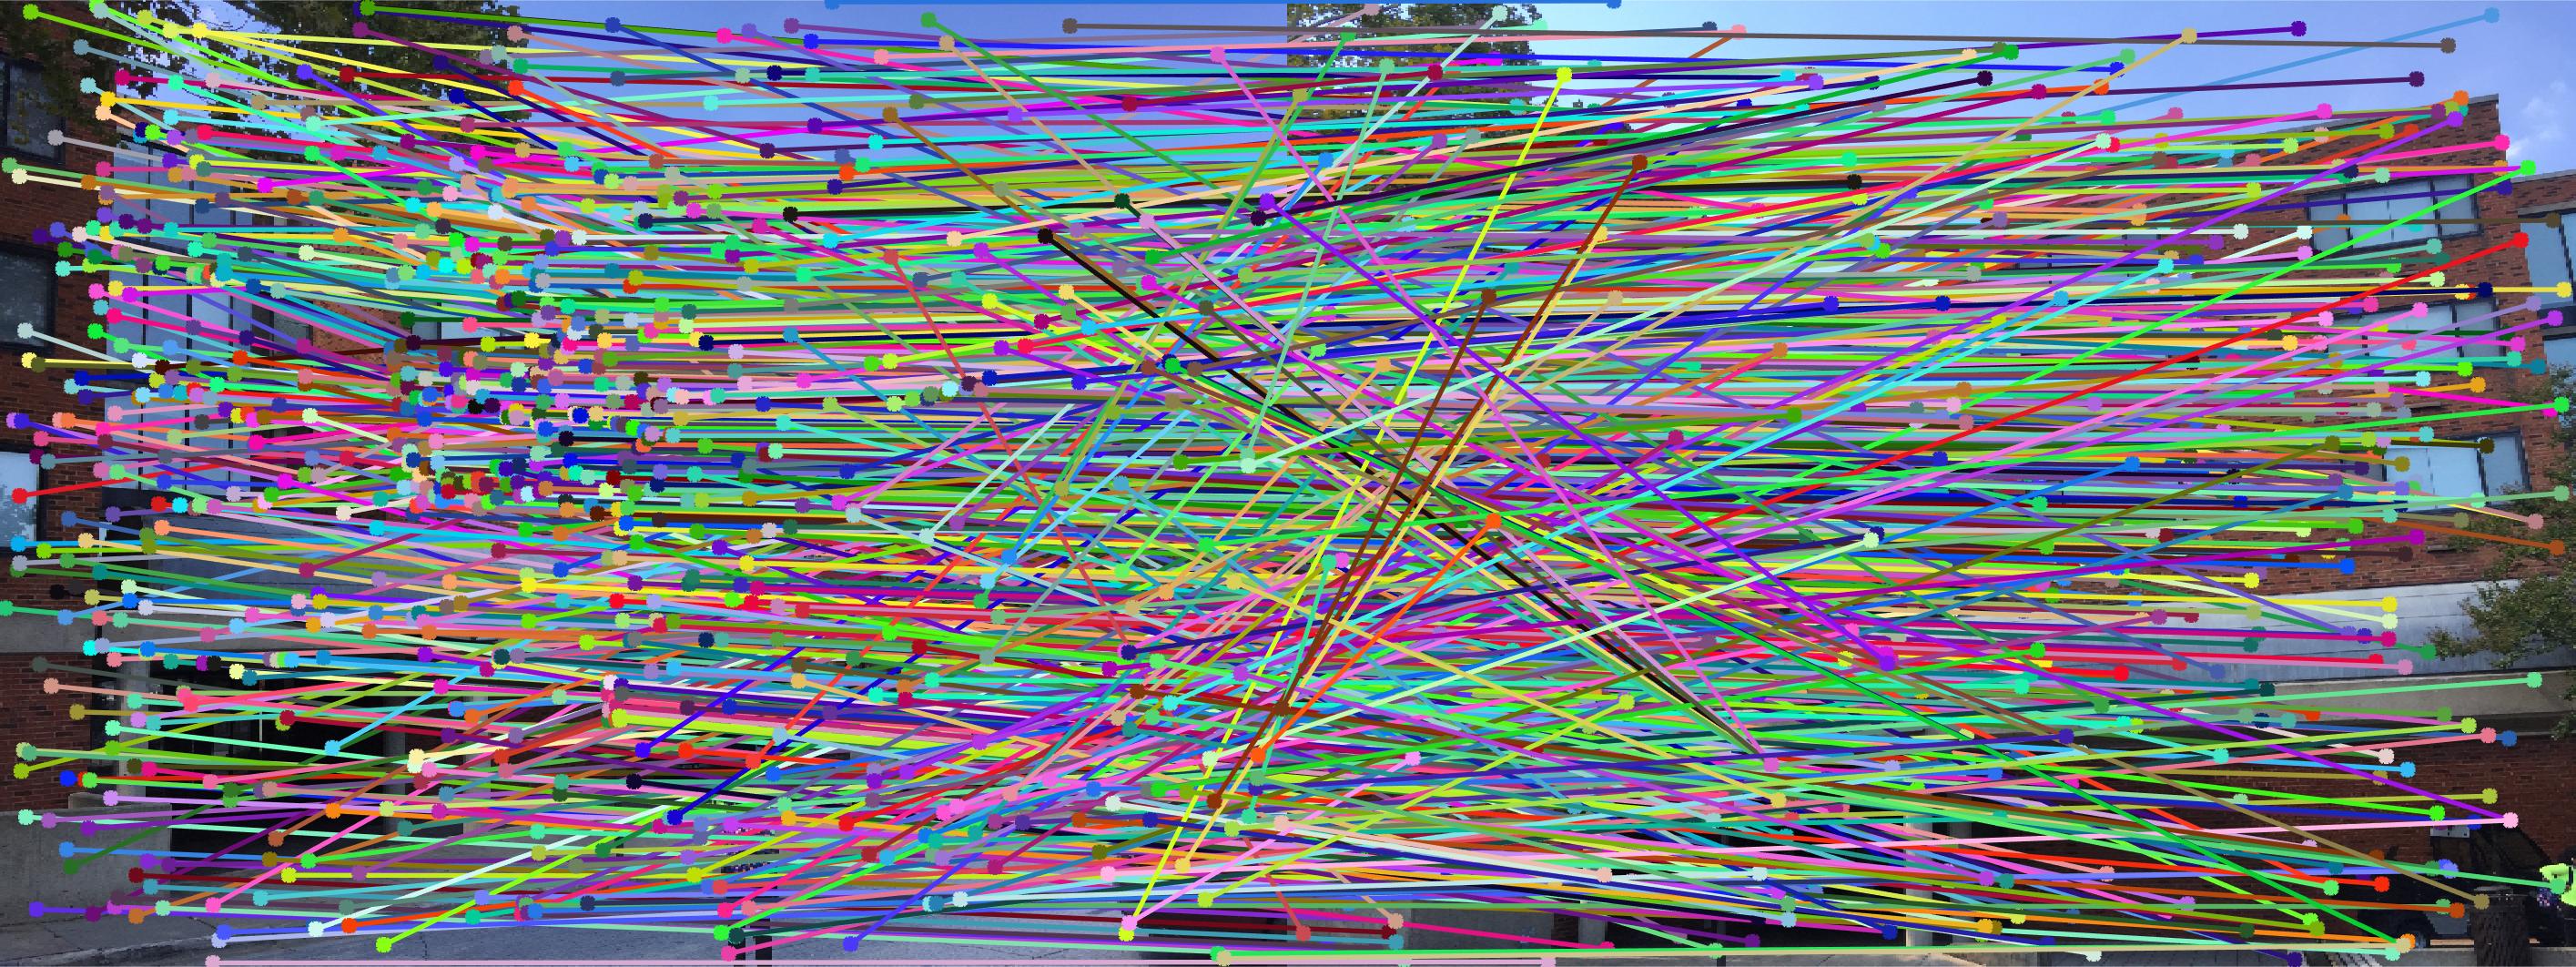
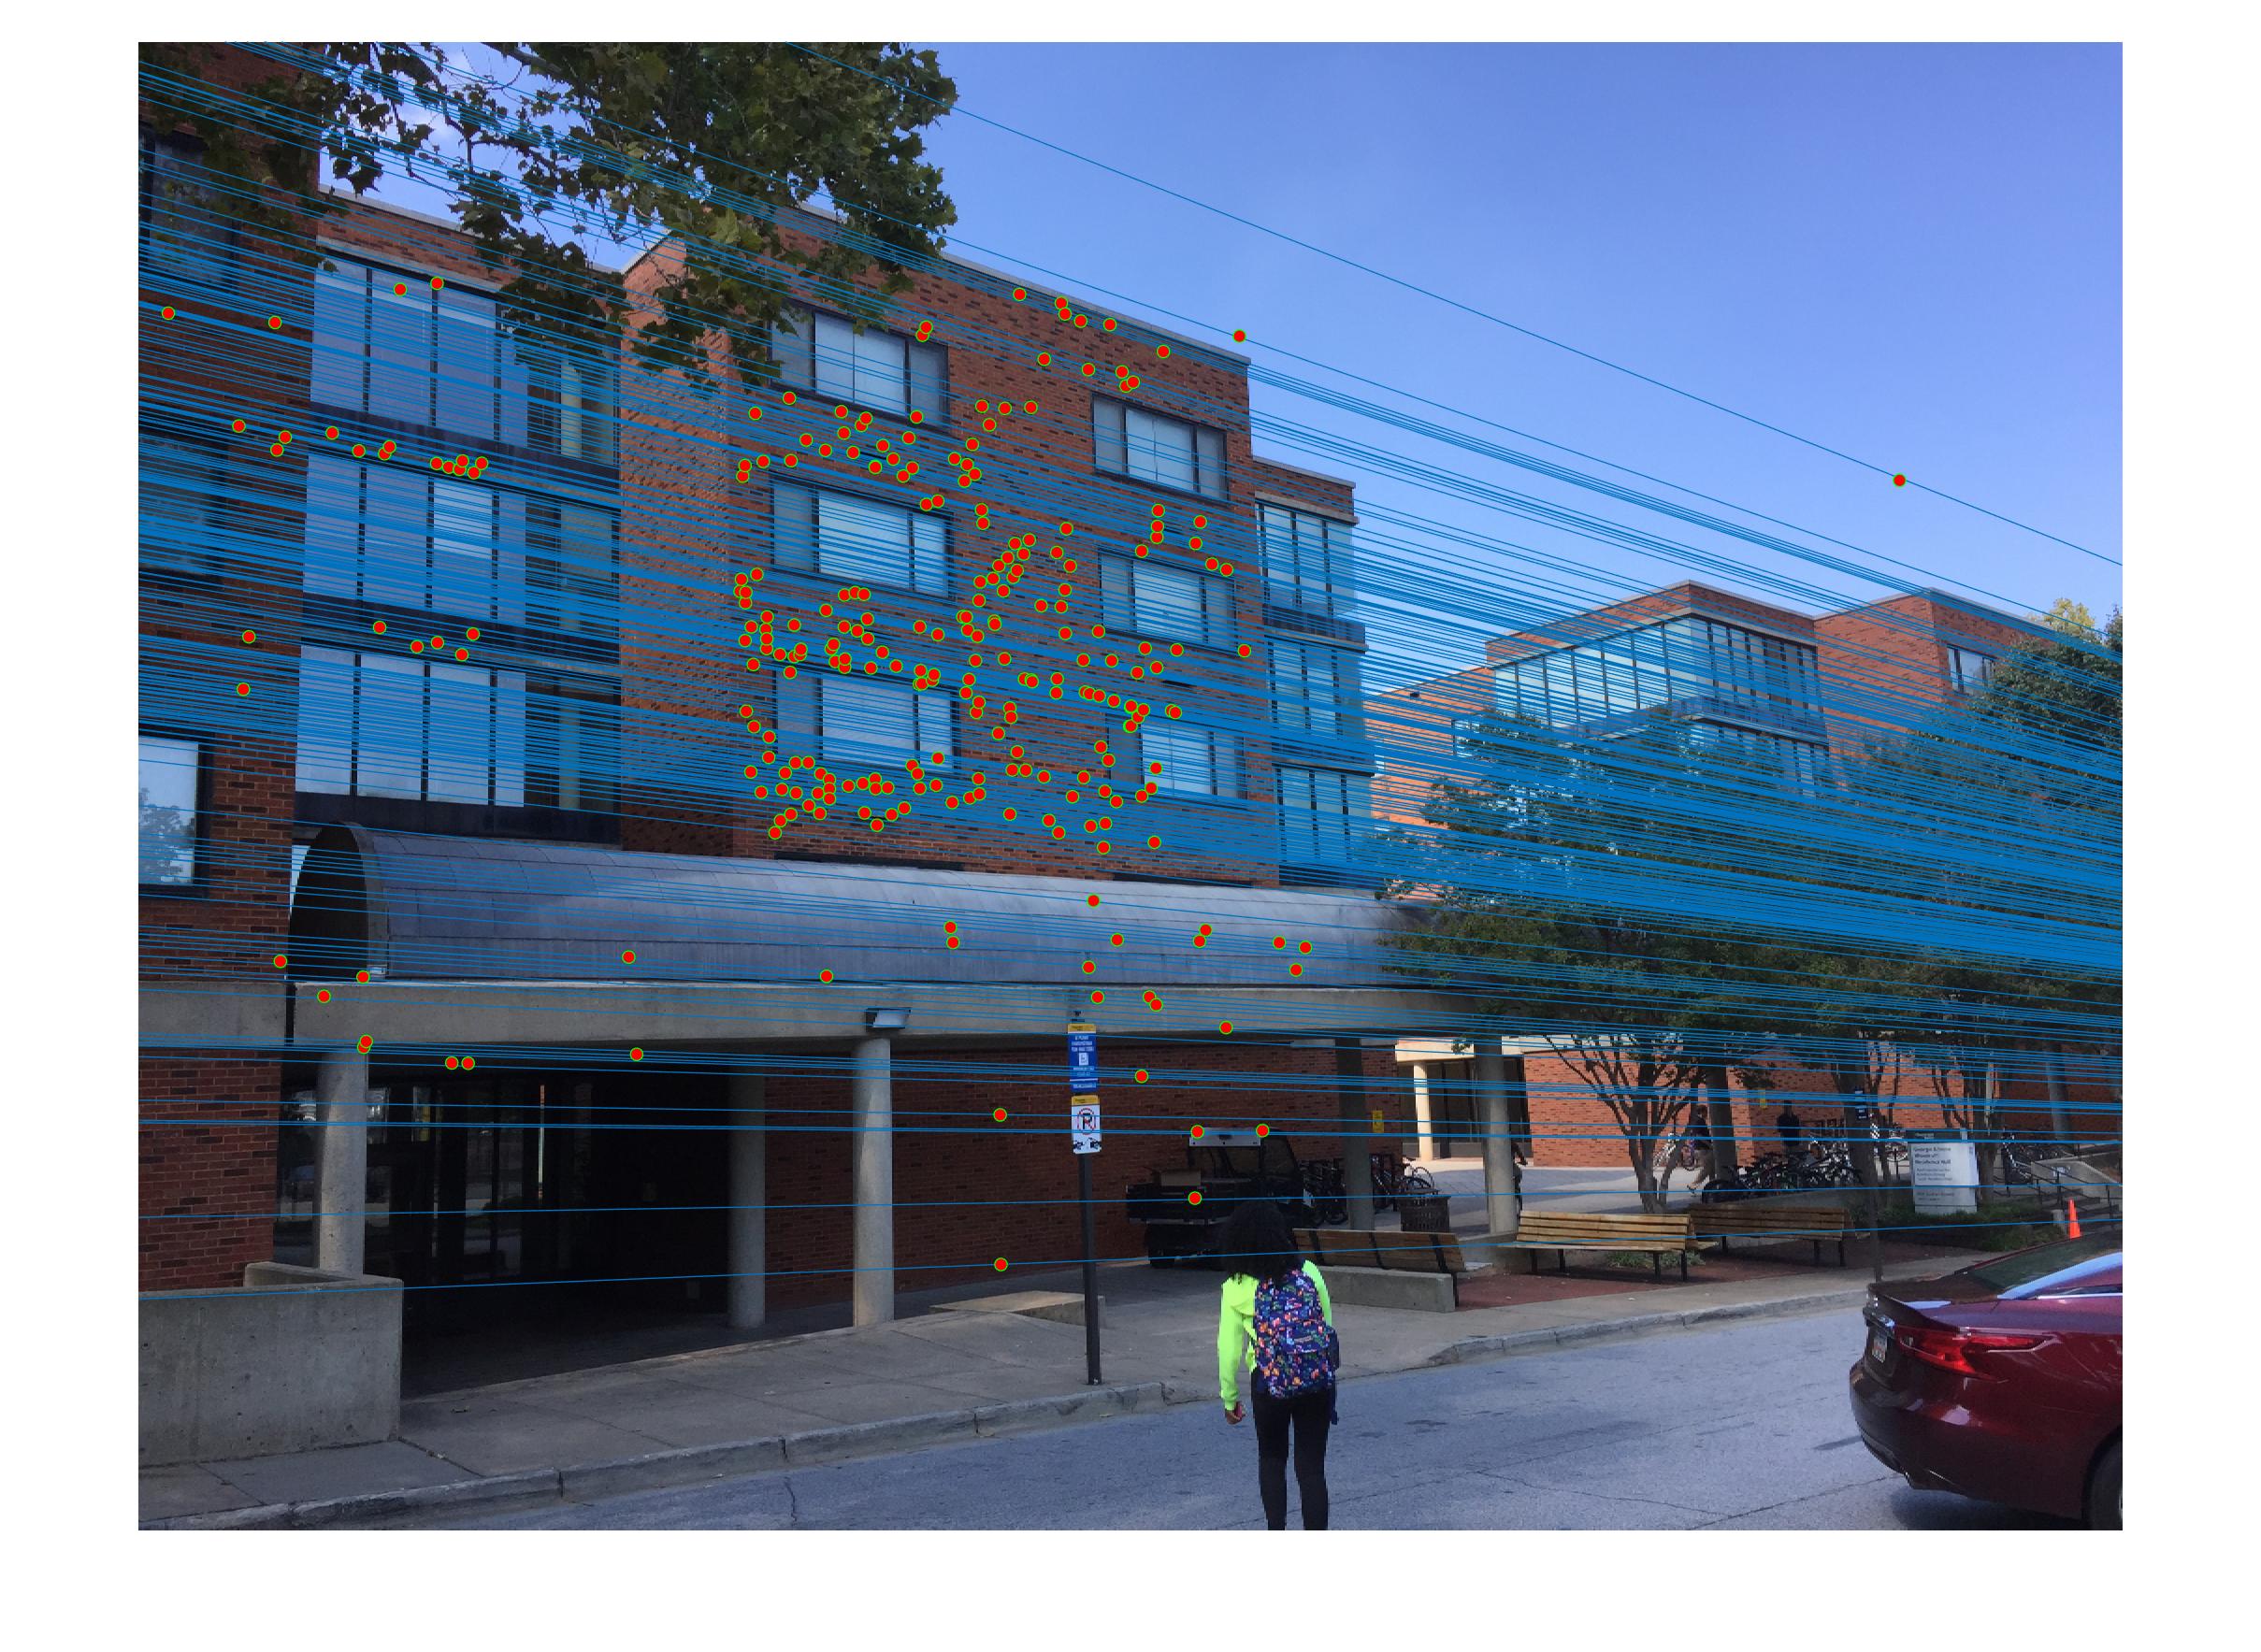
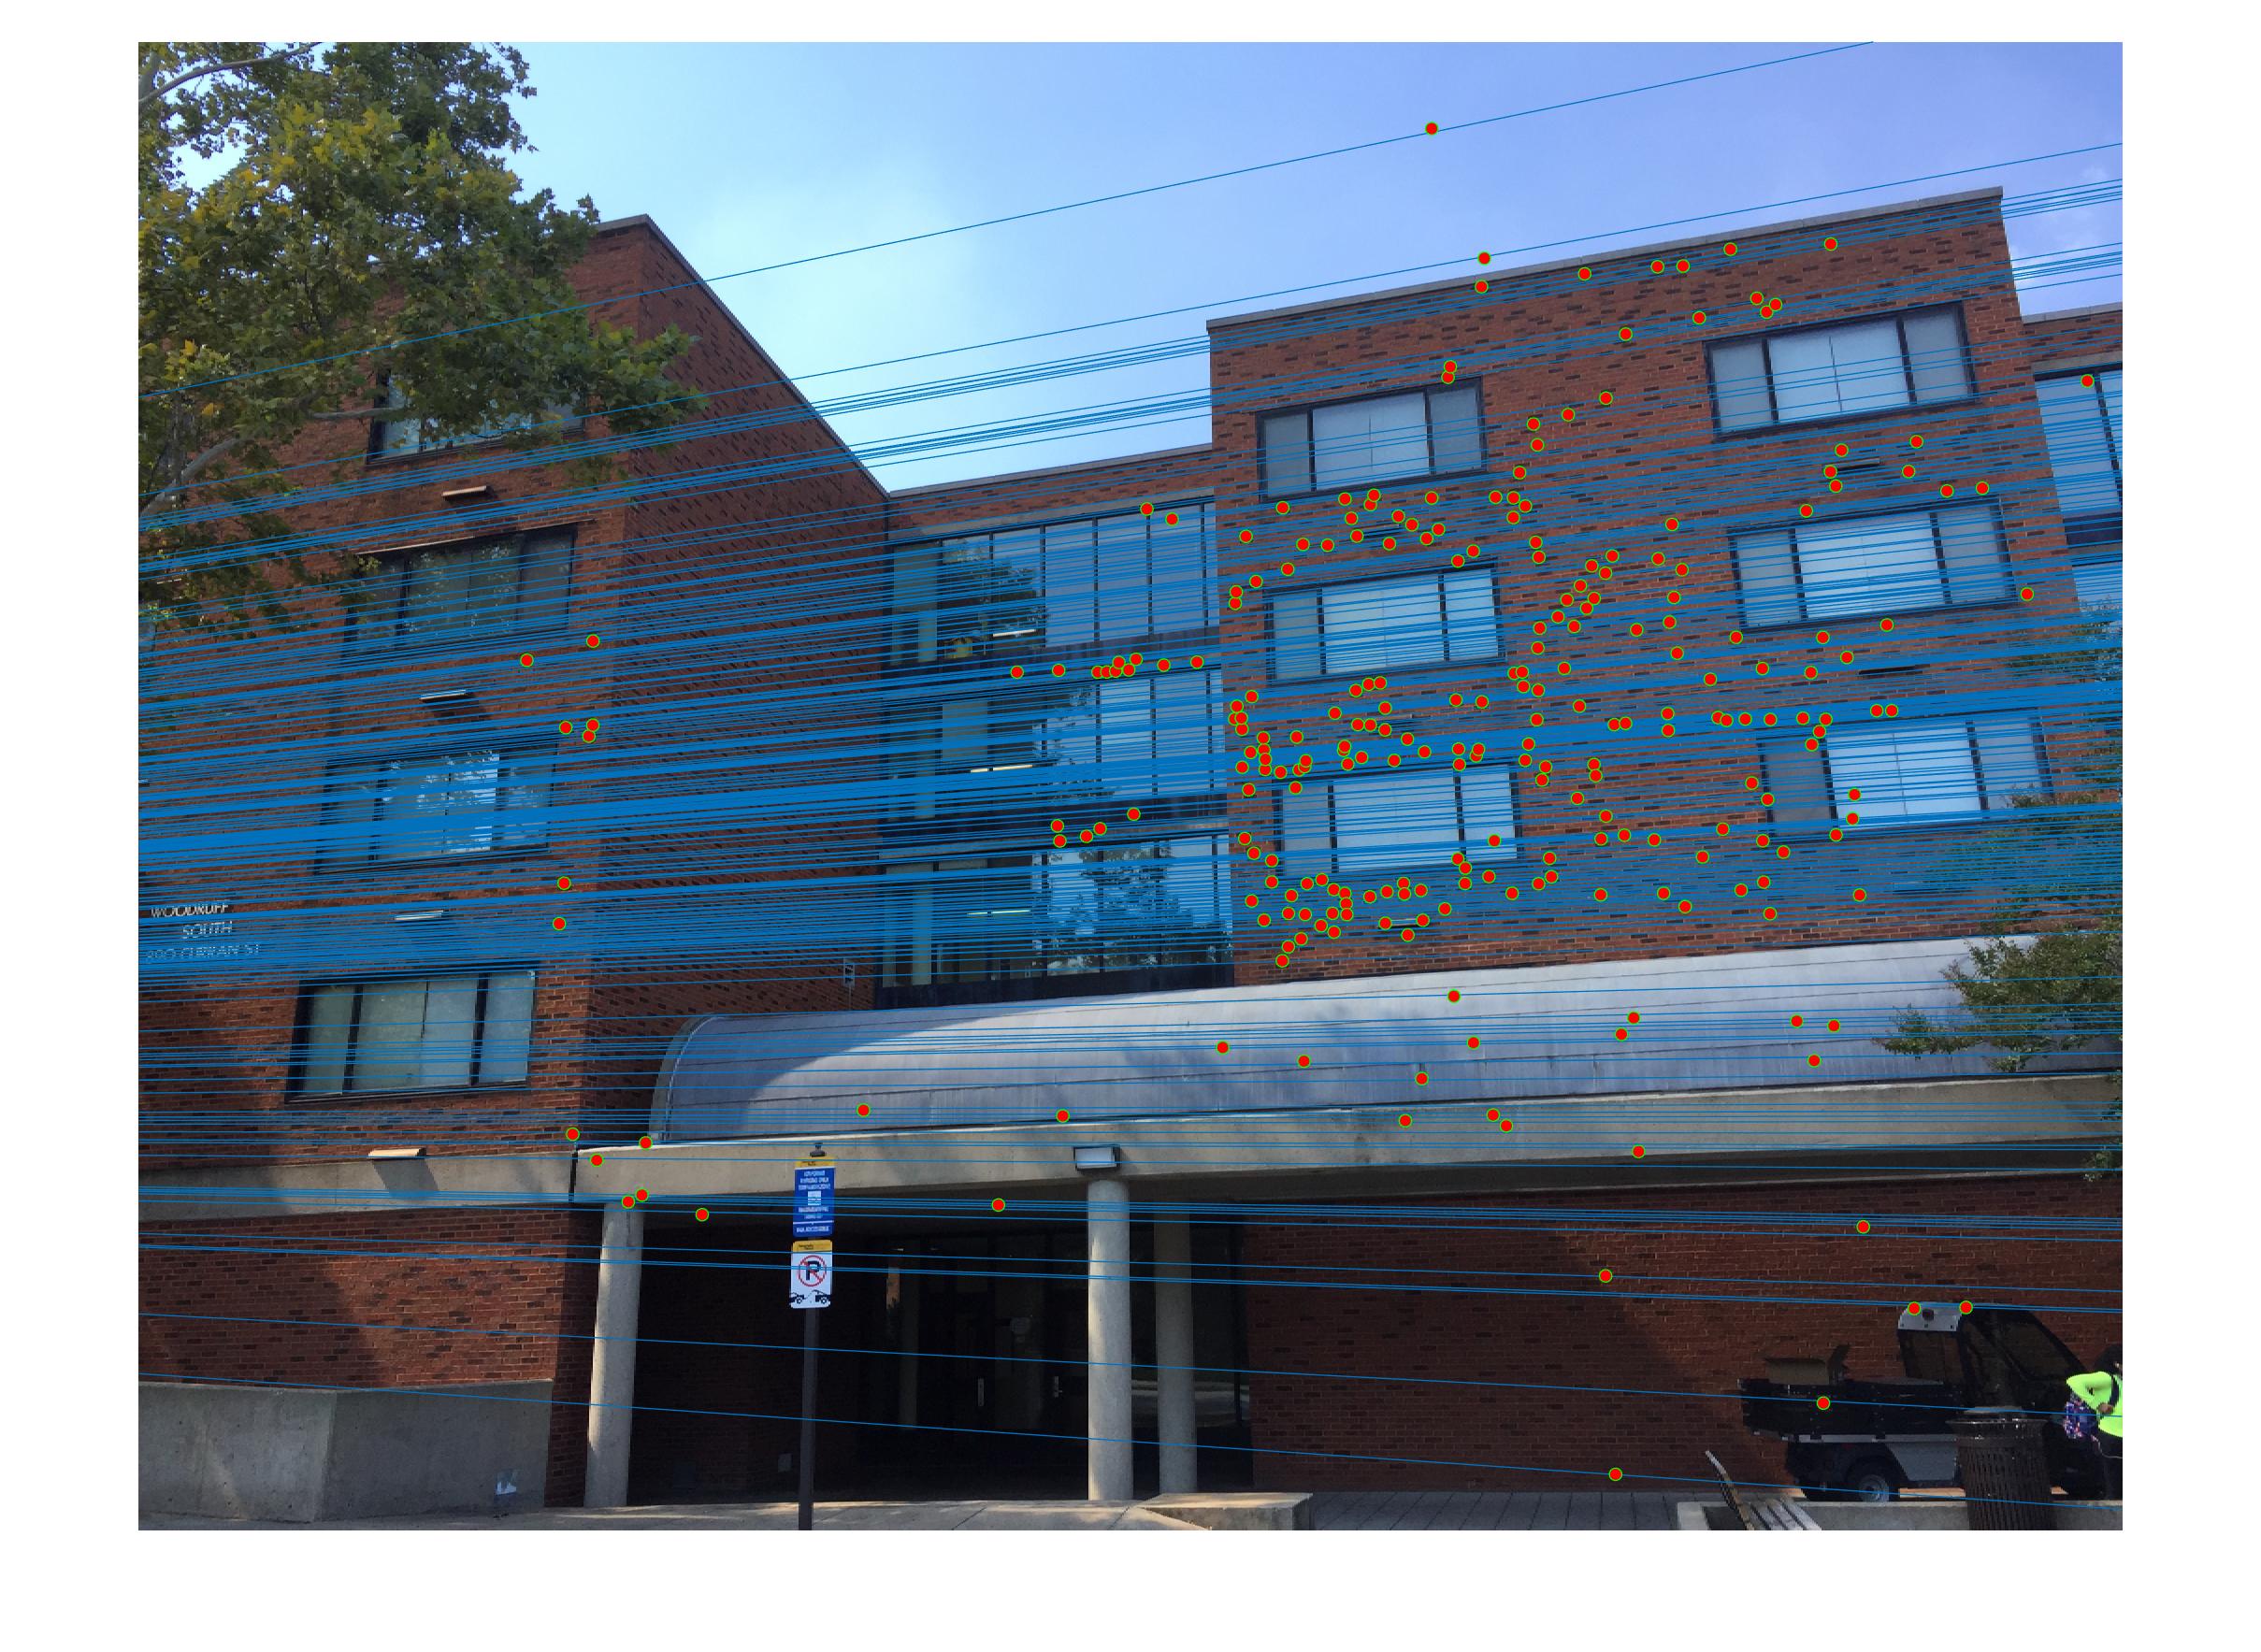
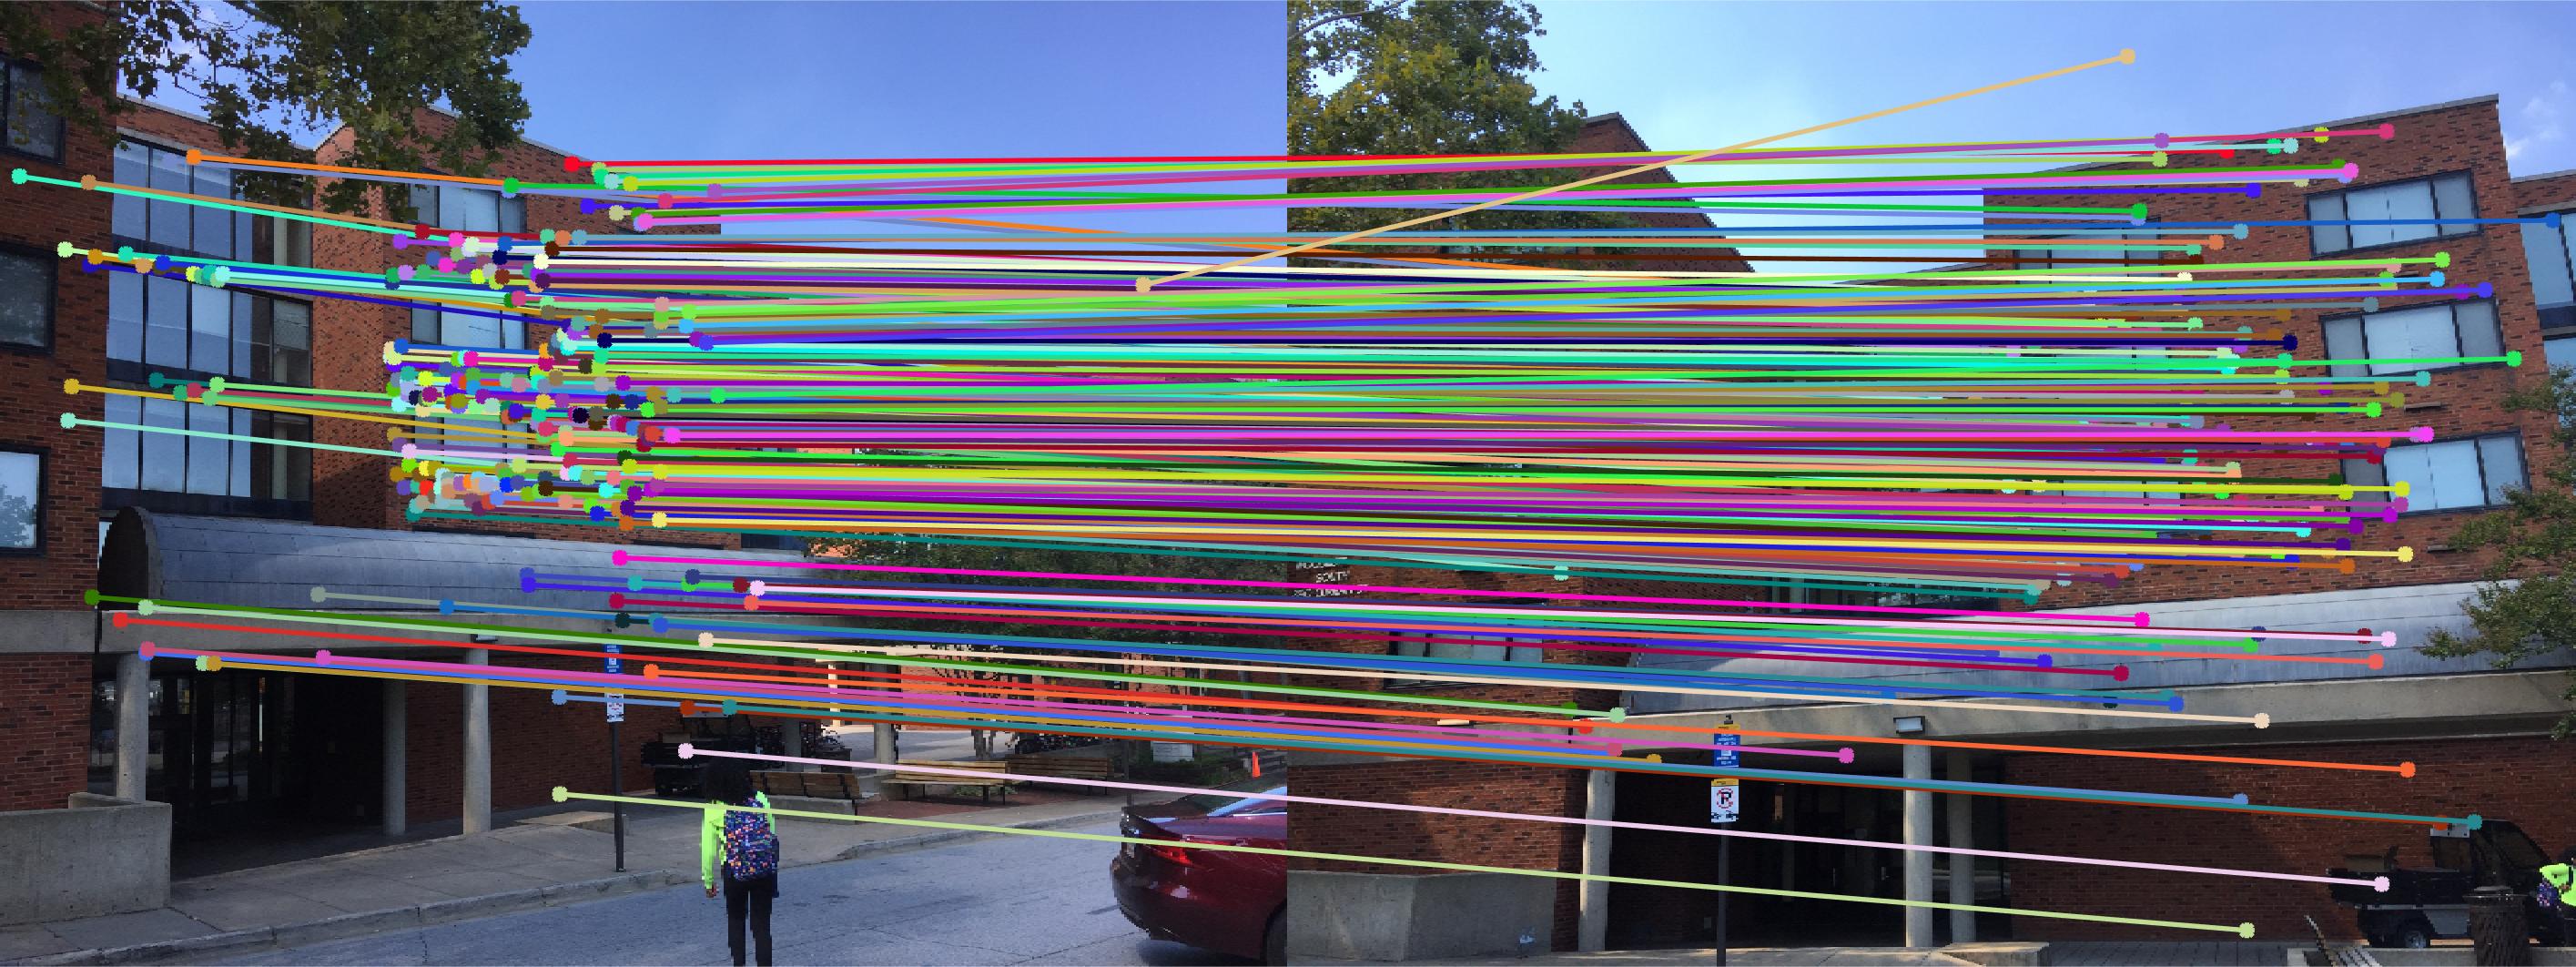
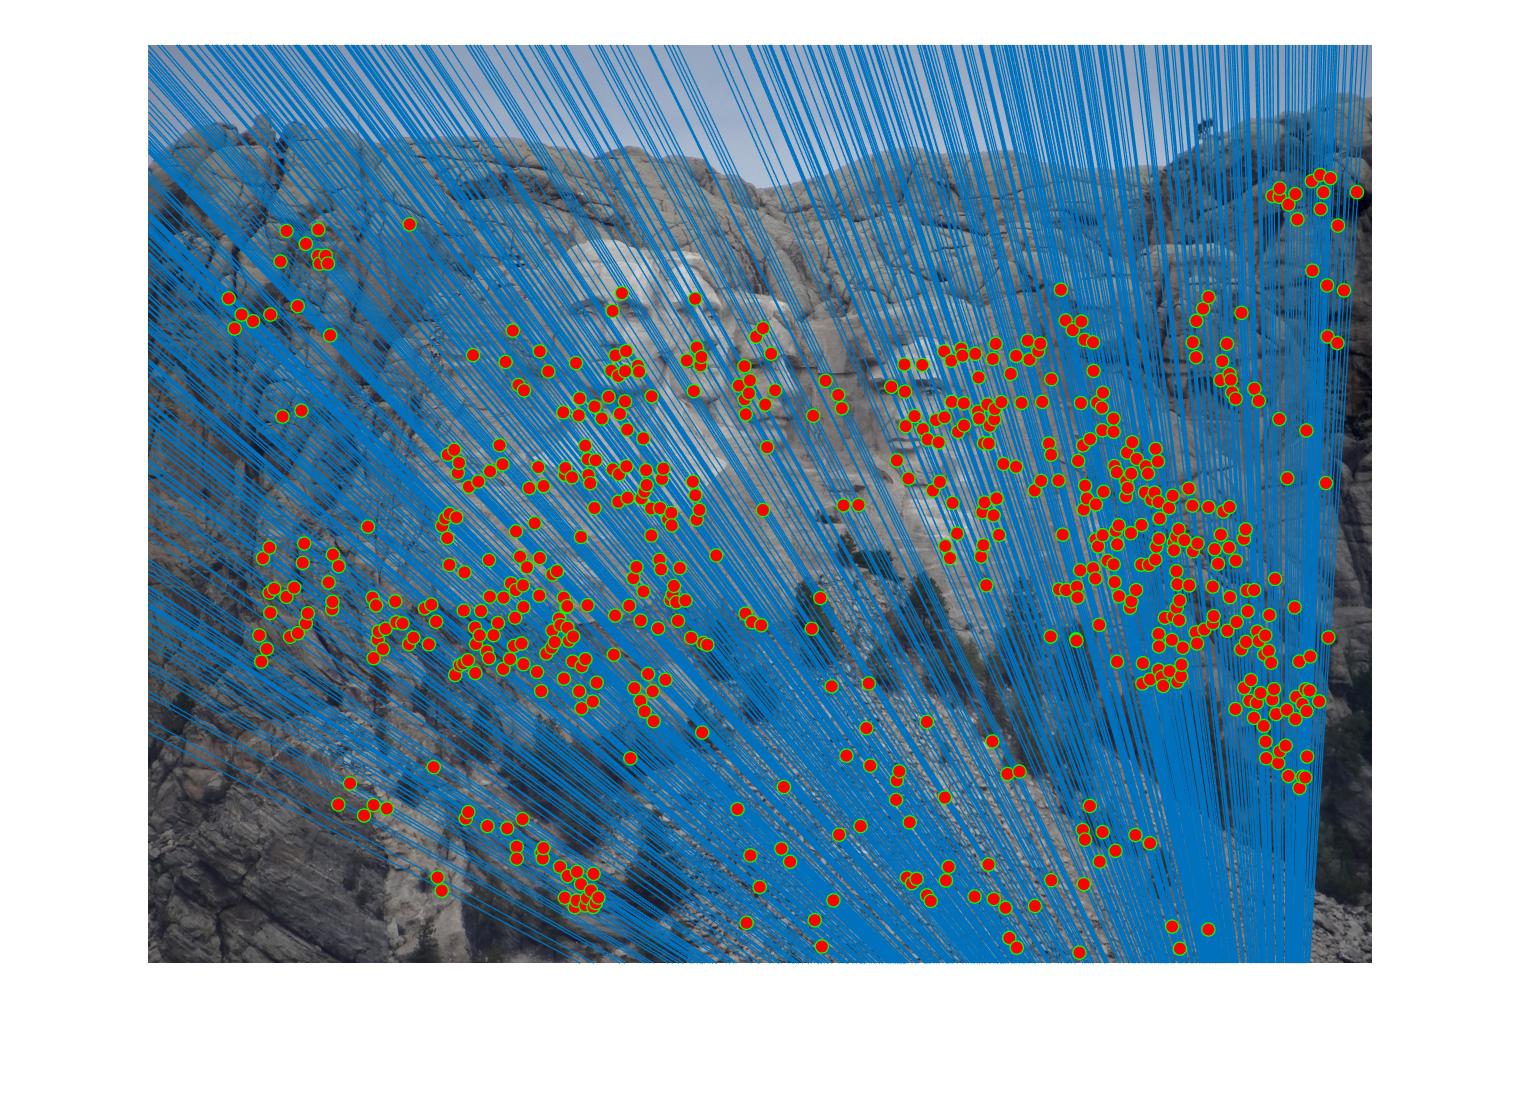
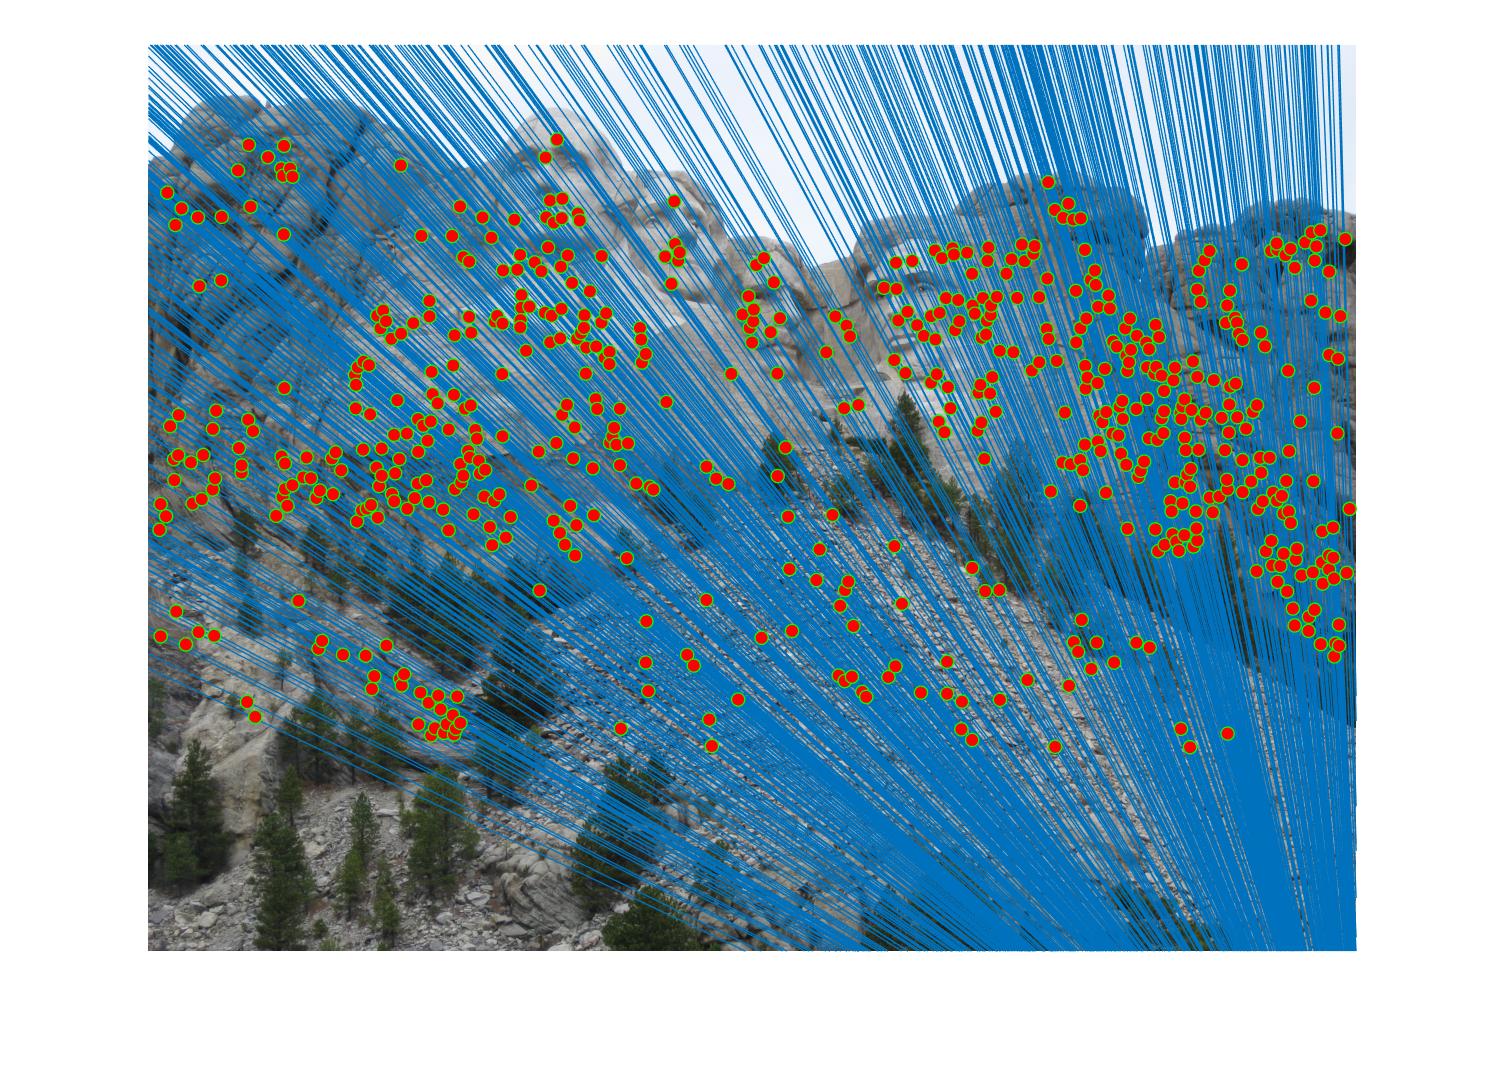
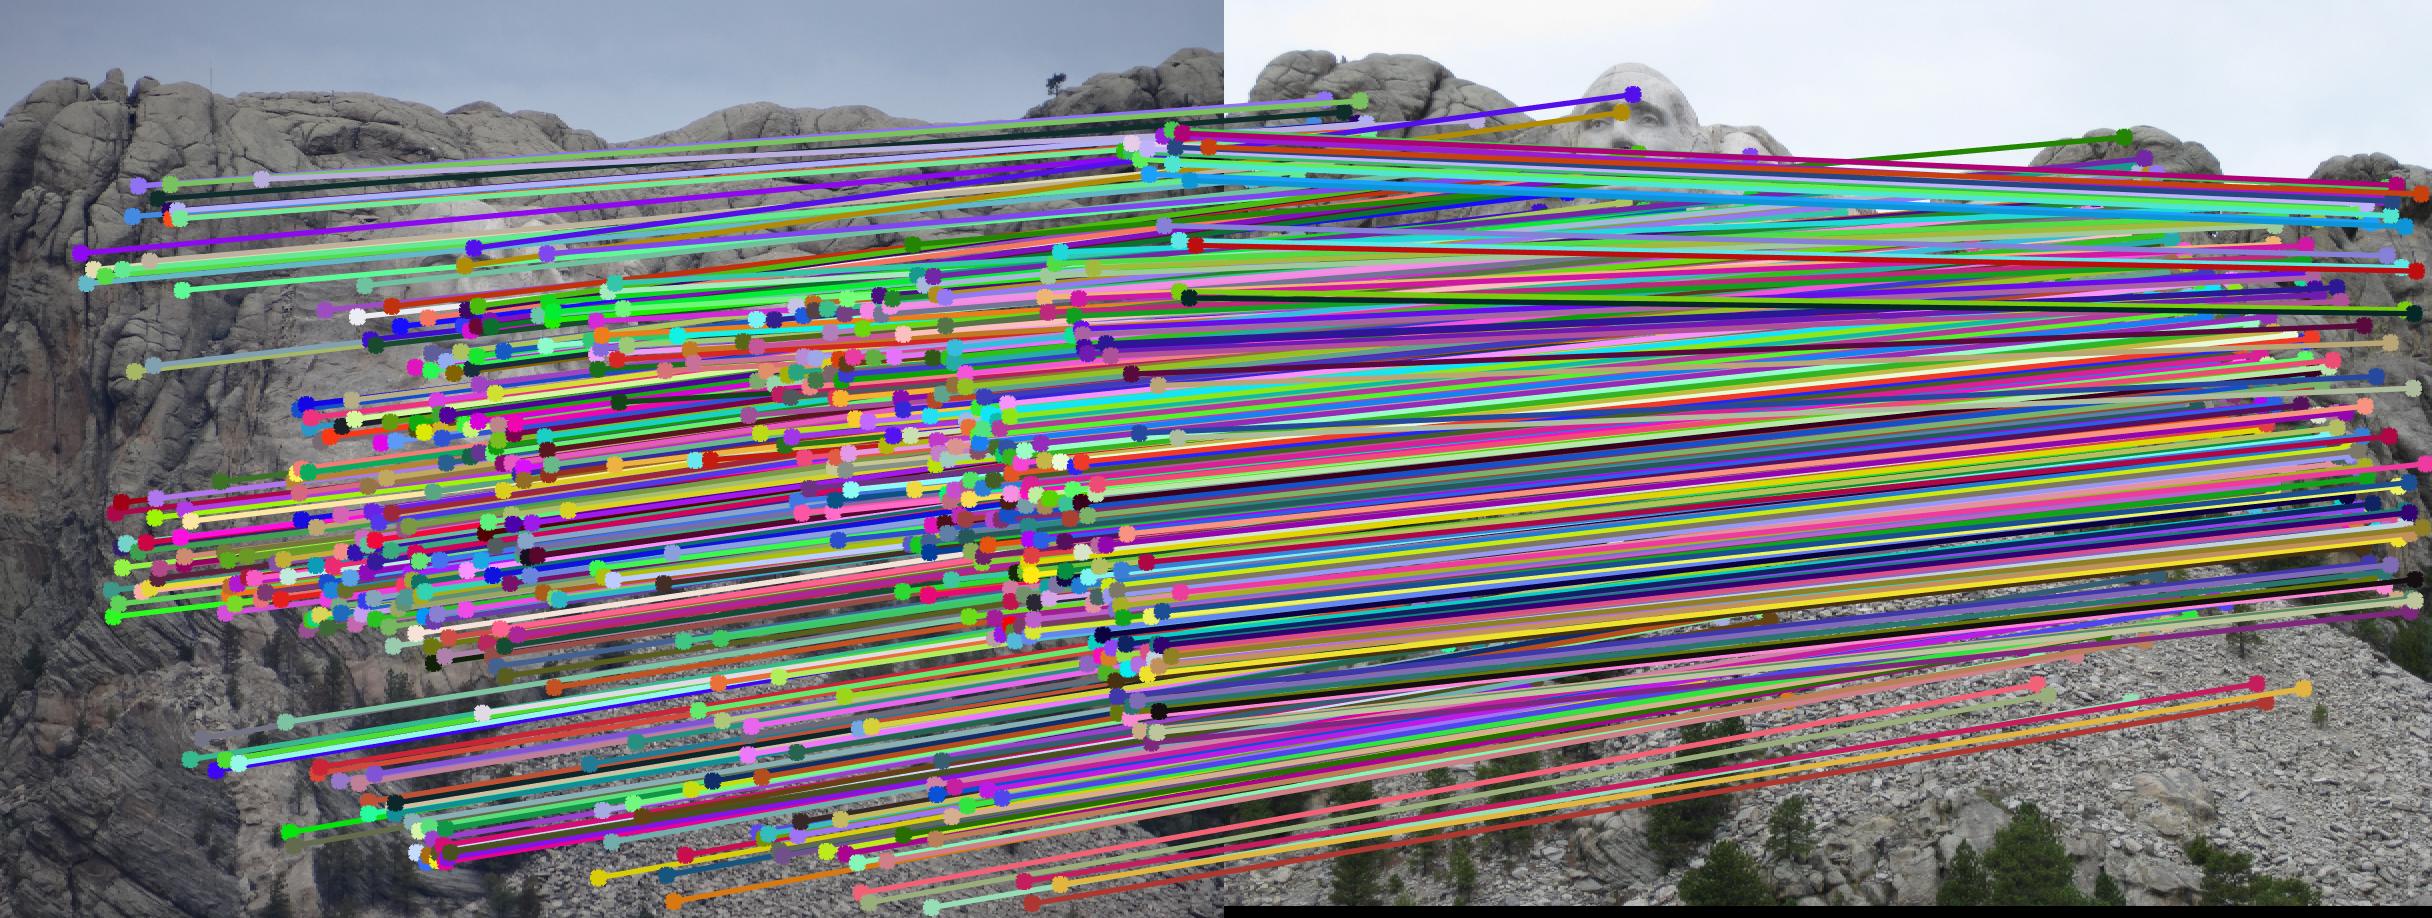
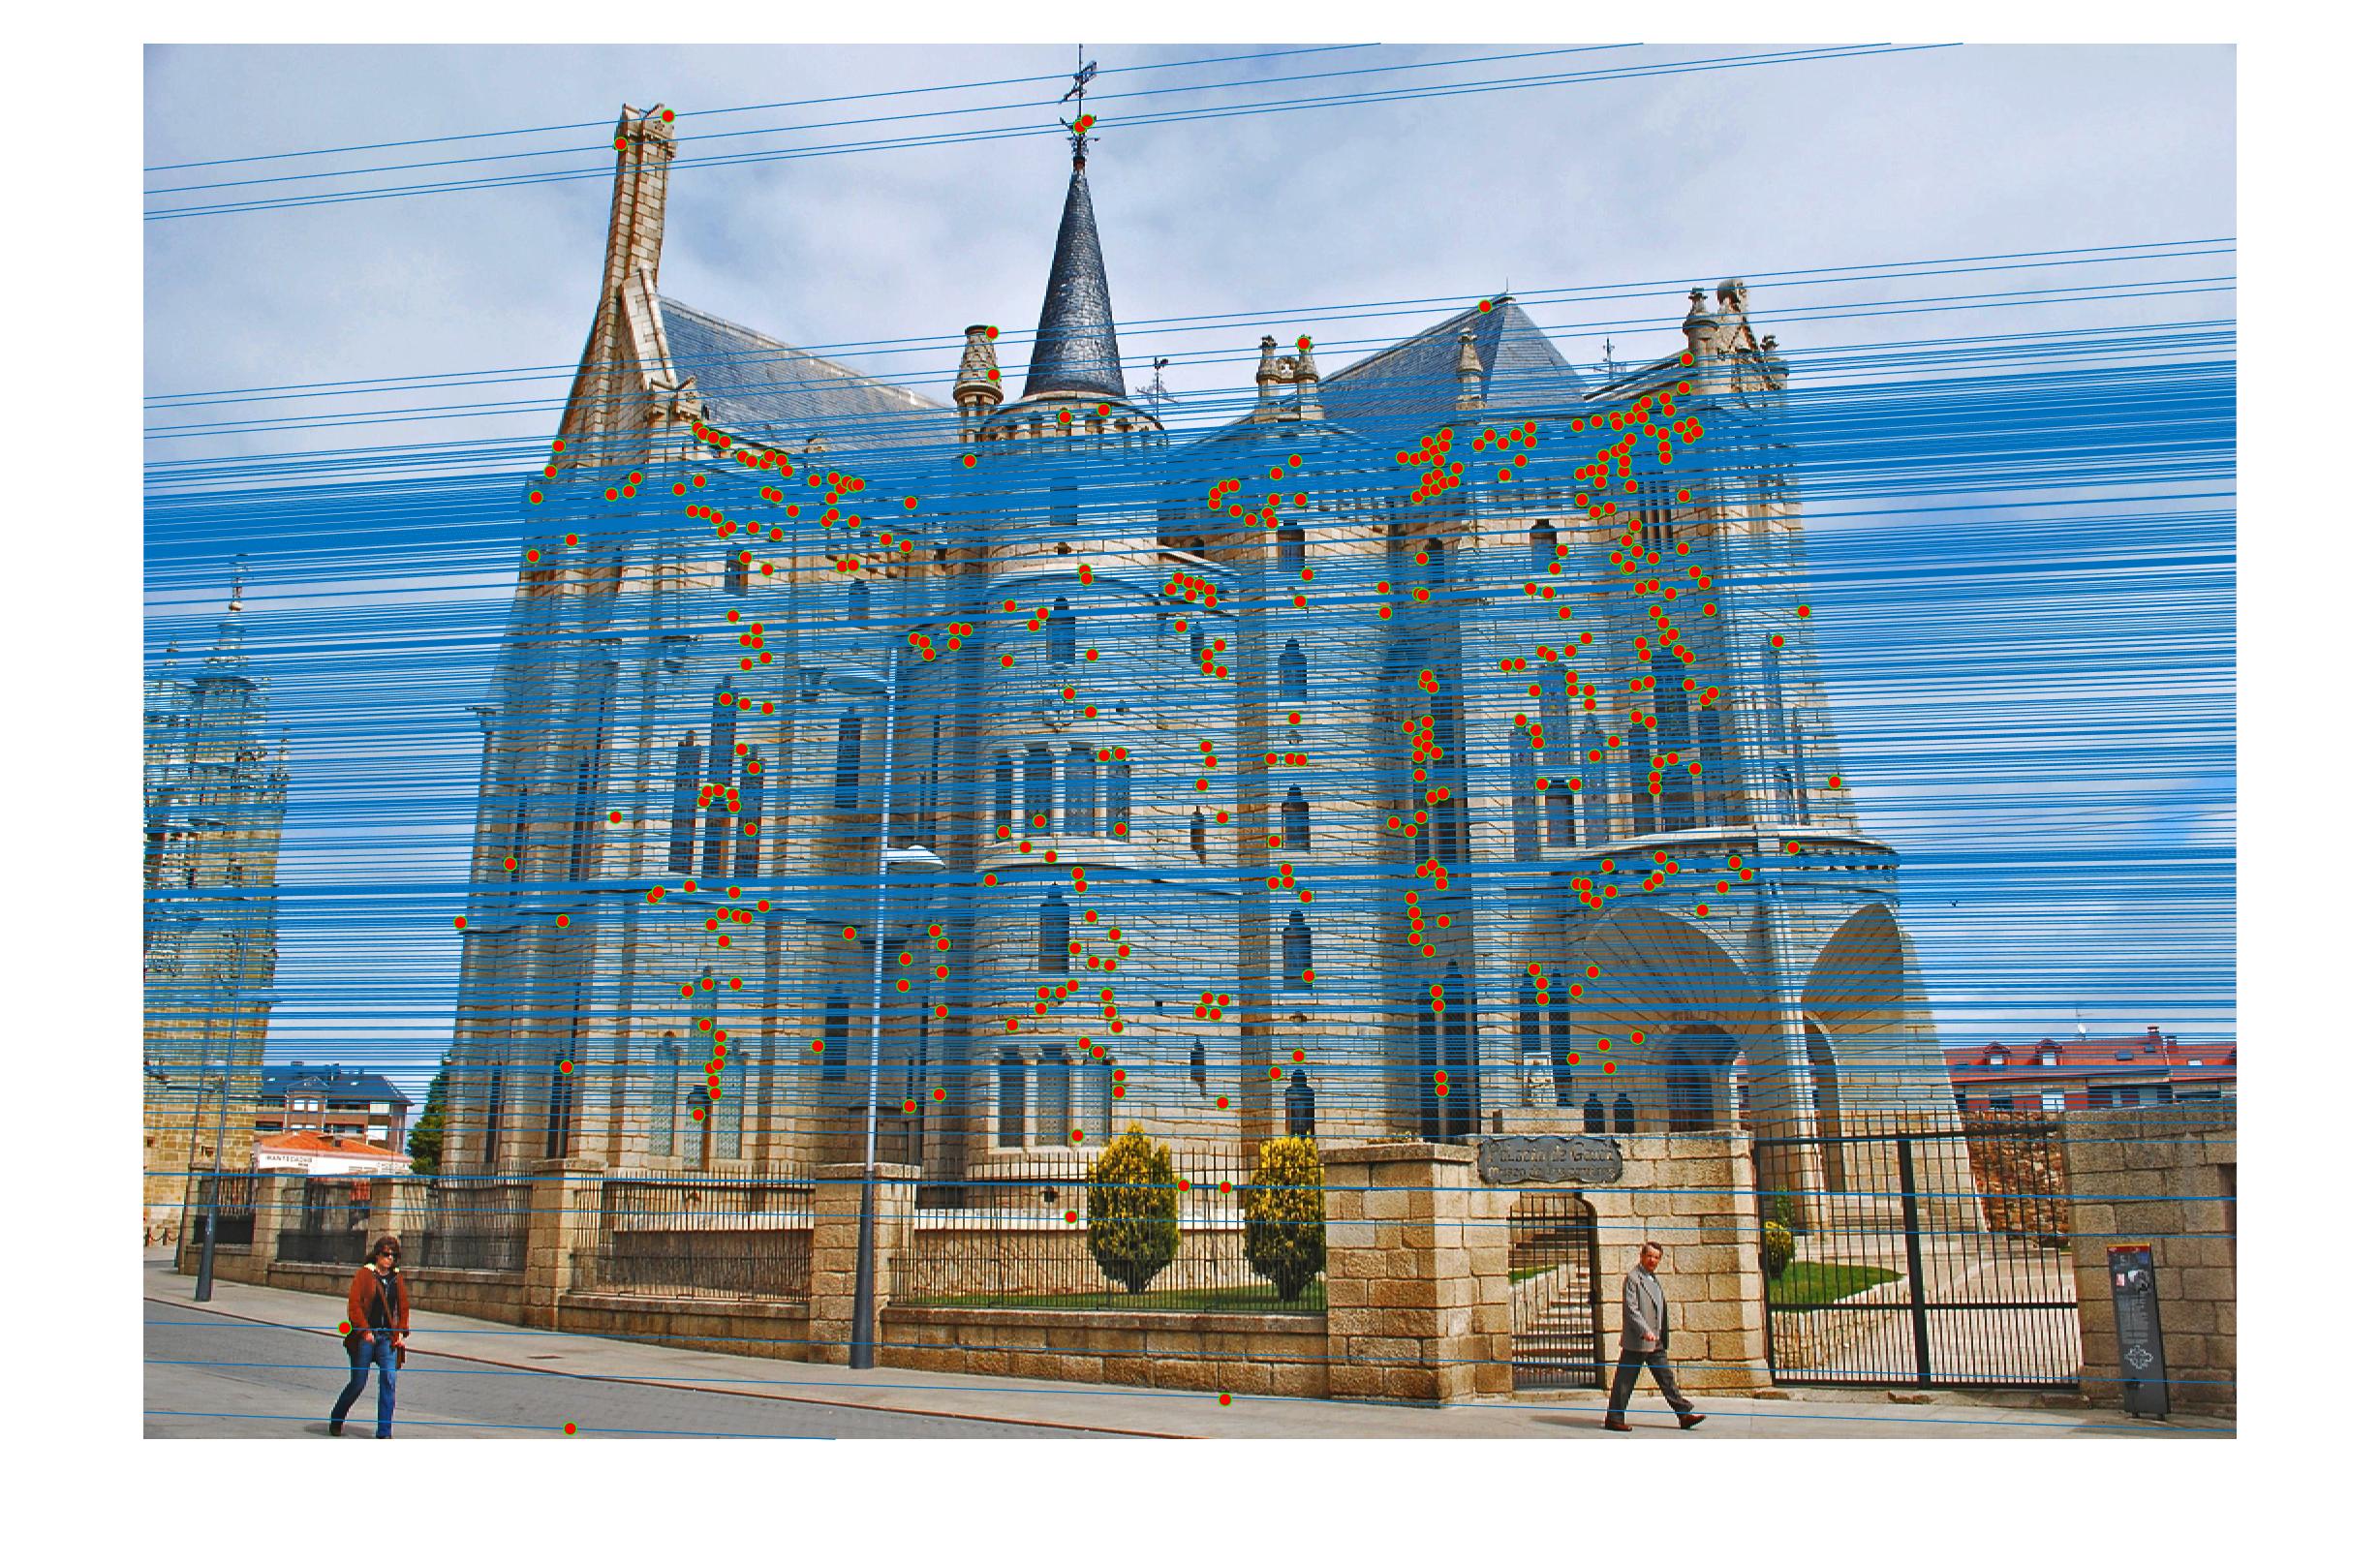
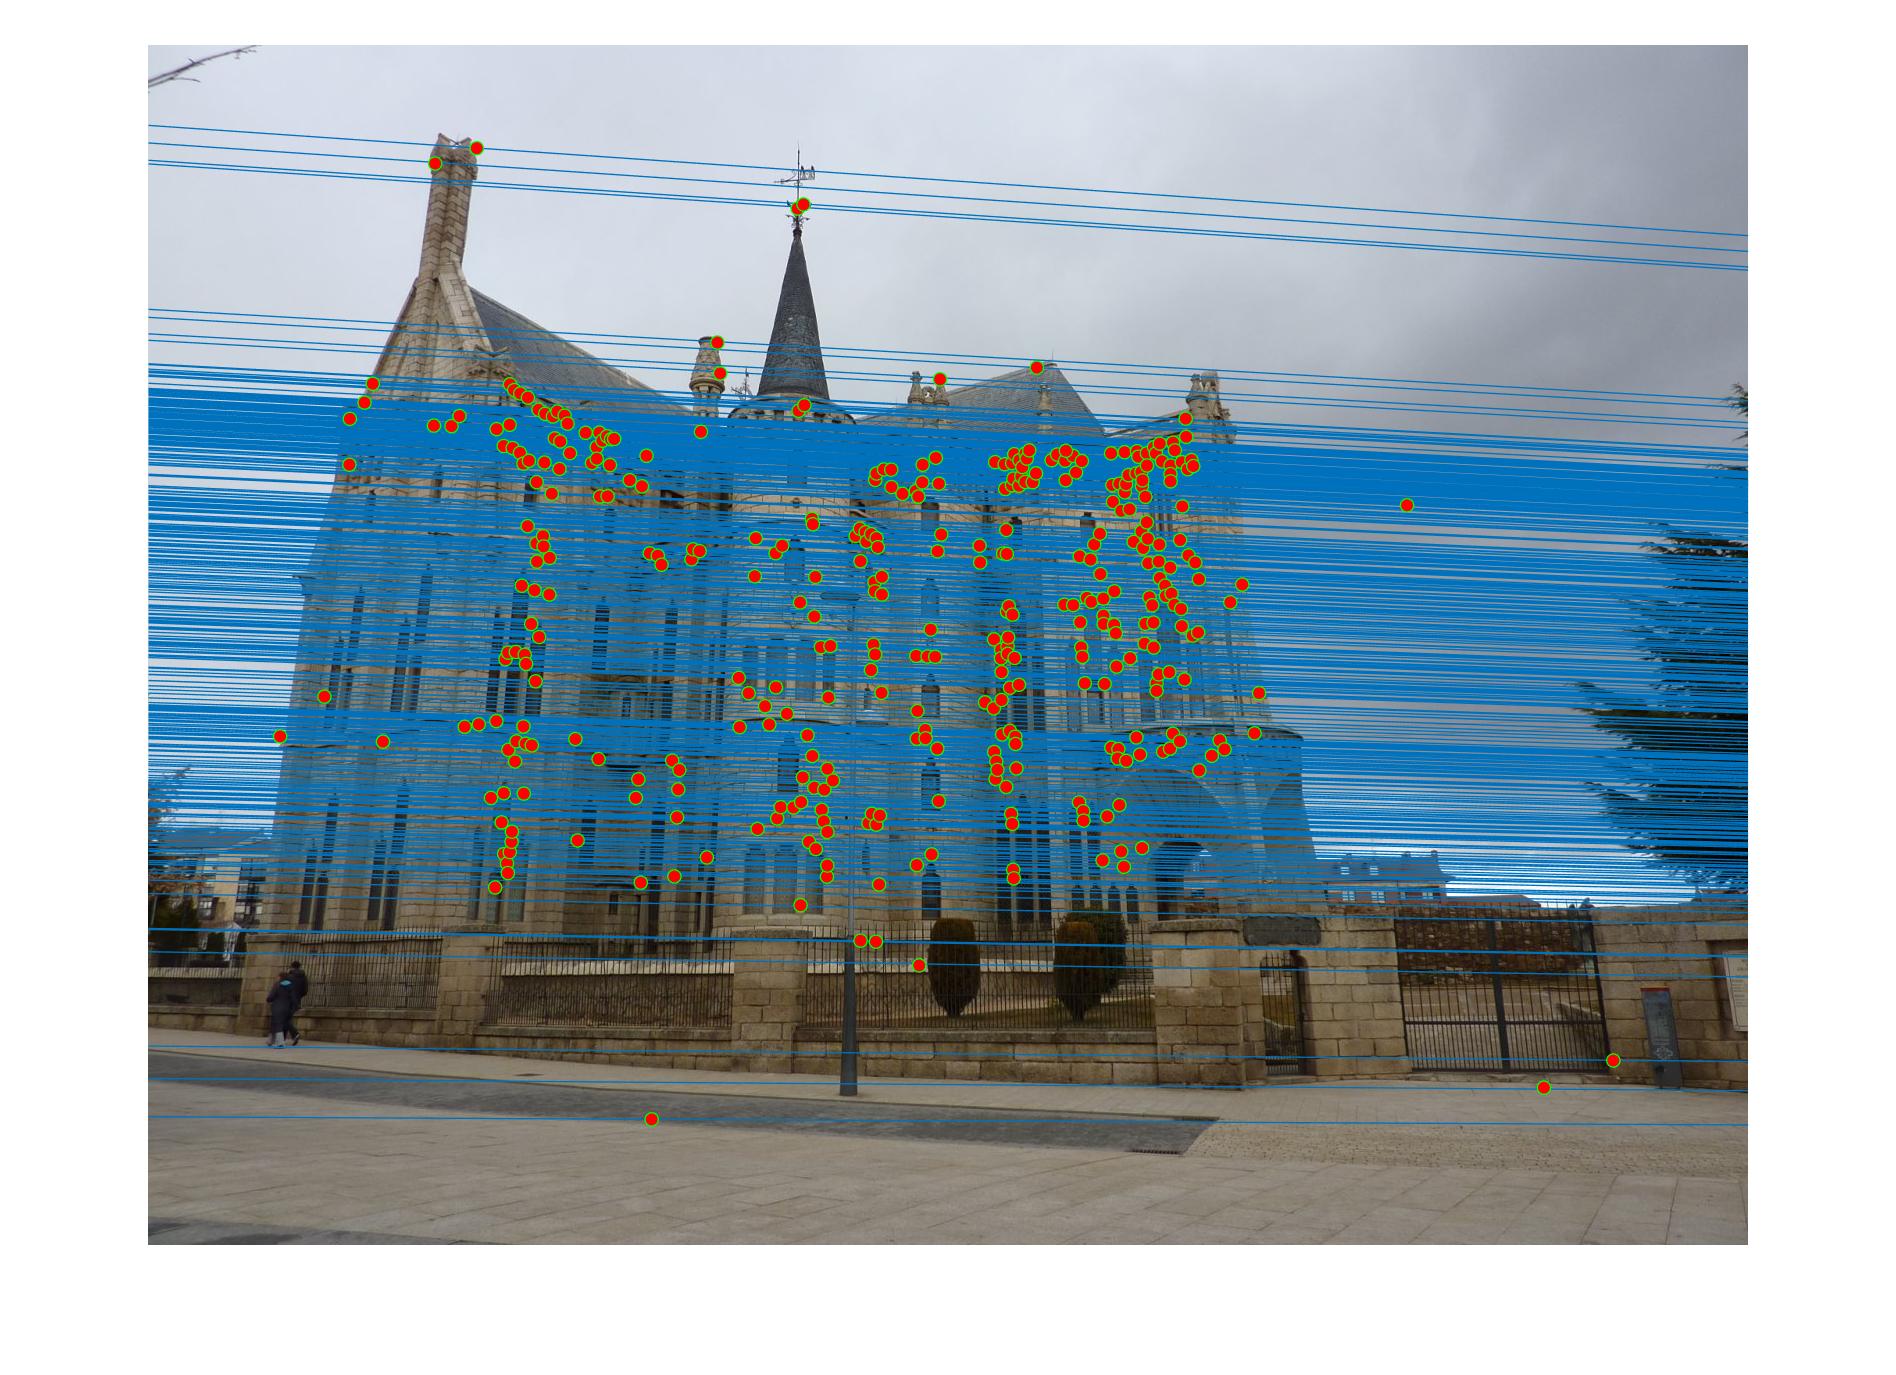
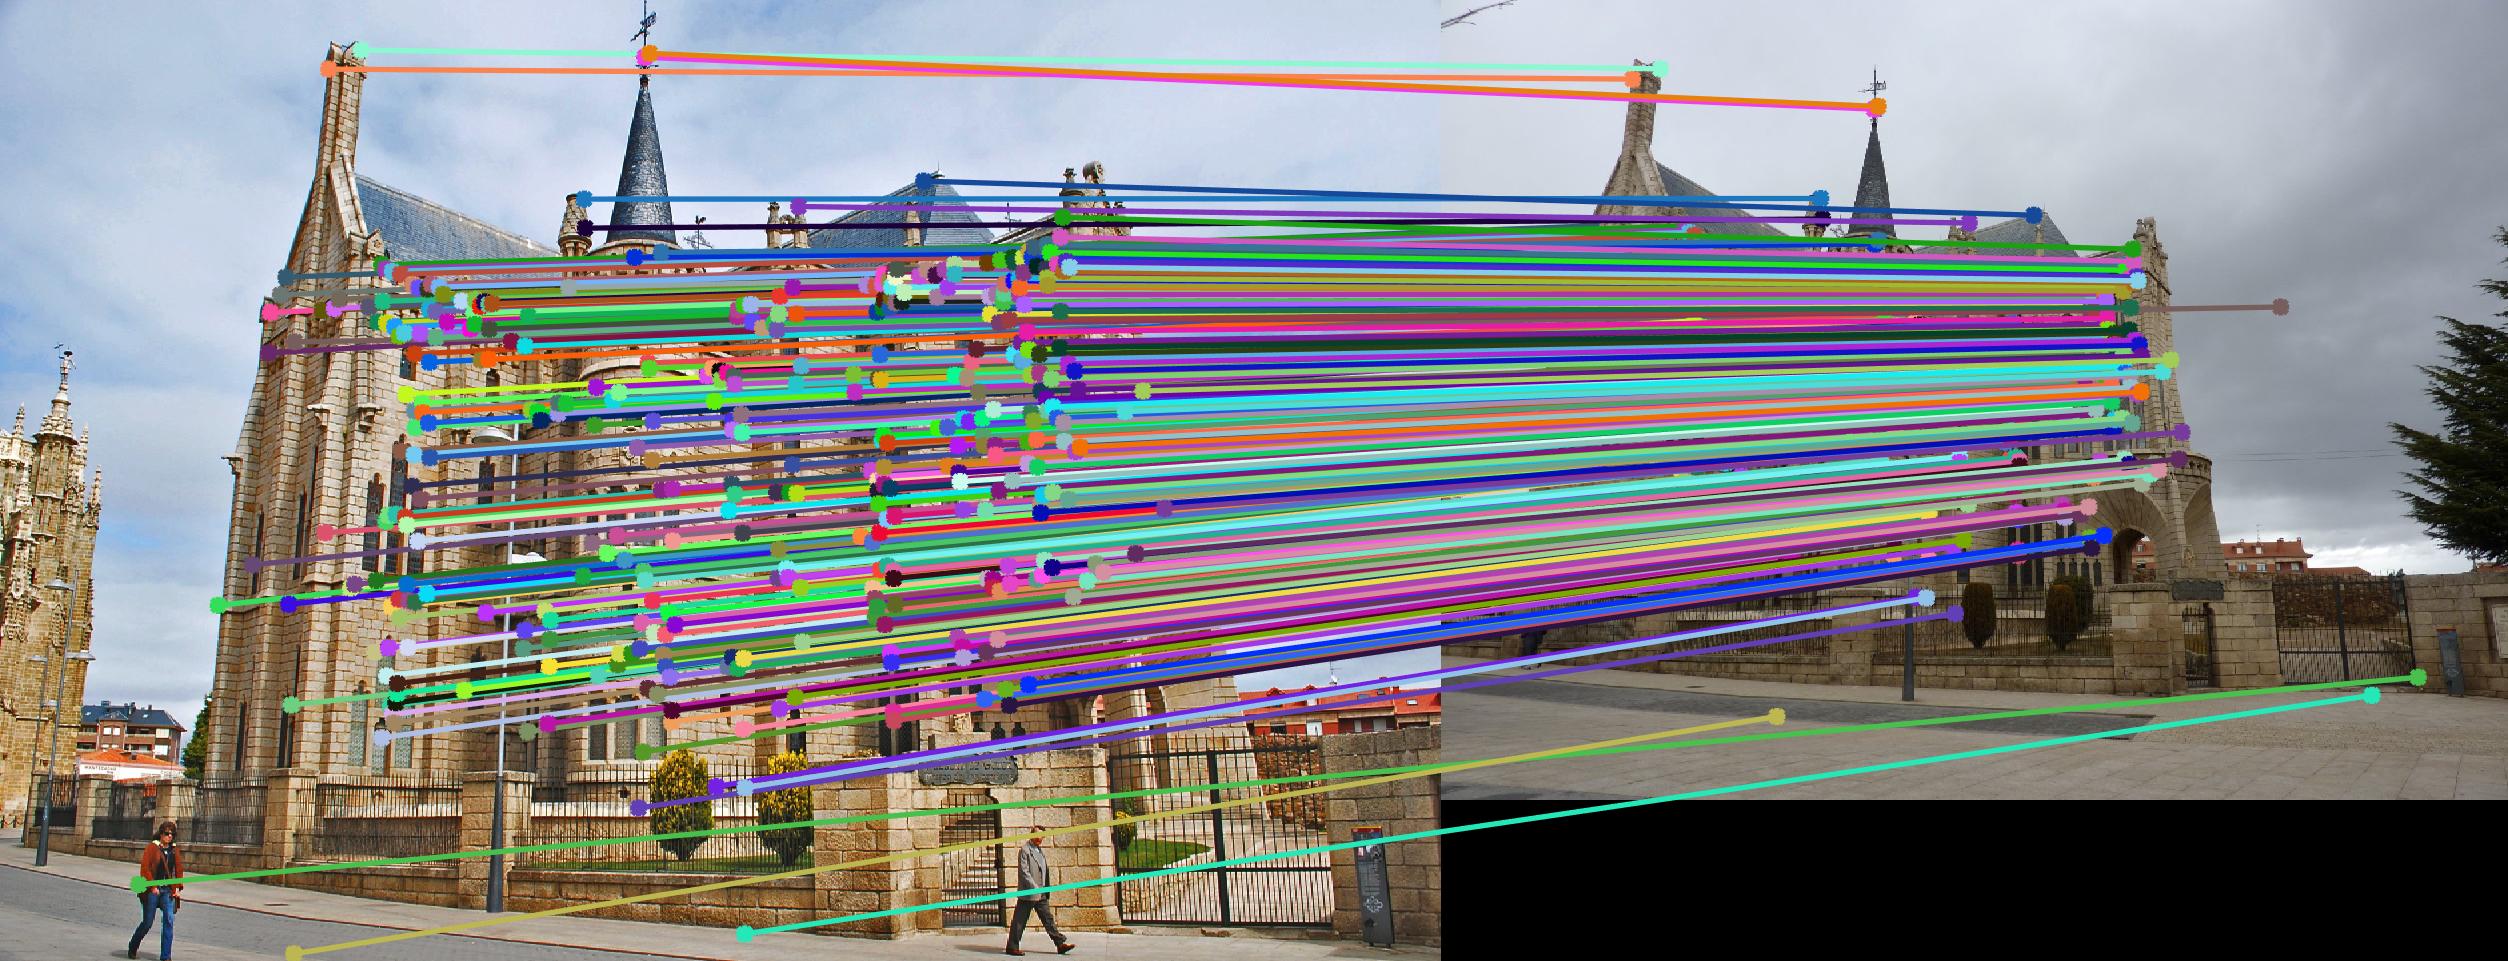
Above are the results after part III of the project. On the left is the set of all corresponding image points returned by the SIFT pipeline (with many incorrect outliers). In the middle are the epipolar lines for the chosen fundamental matrix, and then on the right are the corresponding image points that are inliers after finding a 'best' fundamental matrix. The Mount Rushmore pair has relatively good results. It's an easy pair with mostly correct initial matches. The Notre Dame pair also has decent results, despite the keypoints being largely on the same plane. The Gaudi pair has the worst results here, with epipolar lines that are far from what they should be, and several visible outlying lines. Here, the Woodruff image pair also has good results, with clearly correct epipolar lines, and very few (if not no) incorrect matches.
Extra Credit: Point Normalization for Fundamental Matrix Computation:
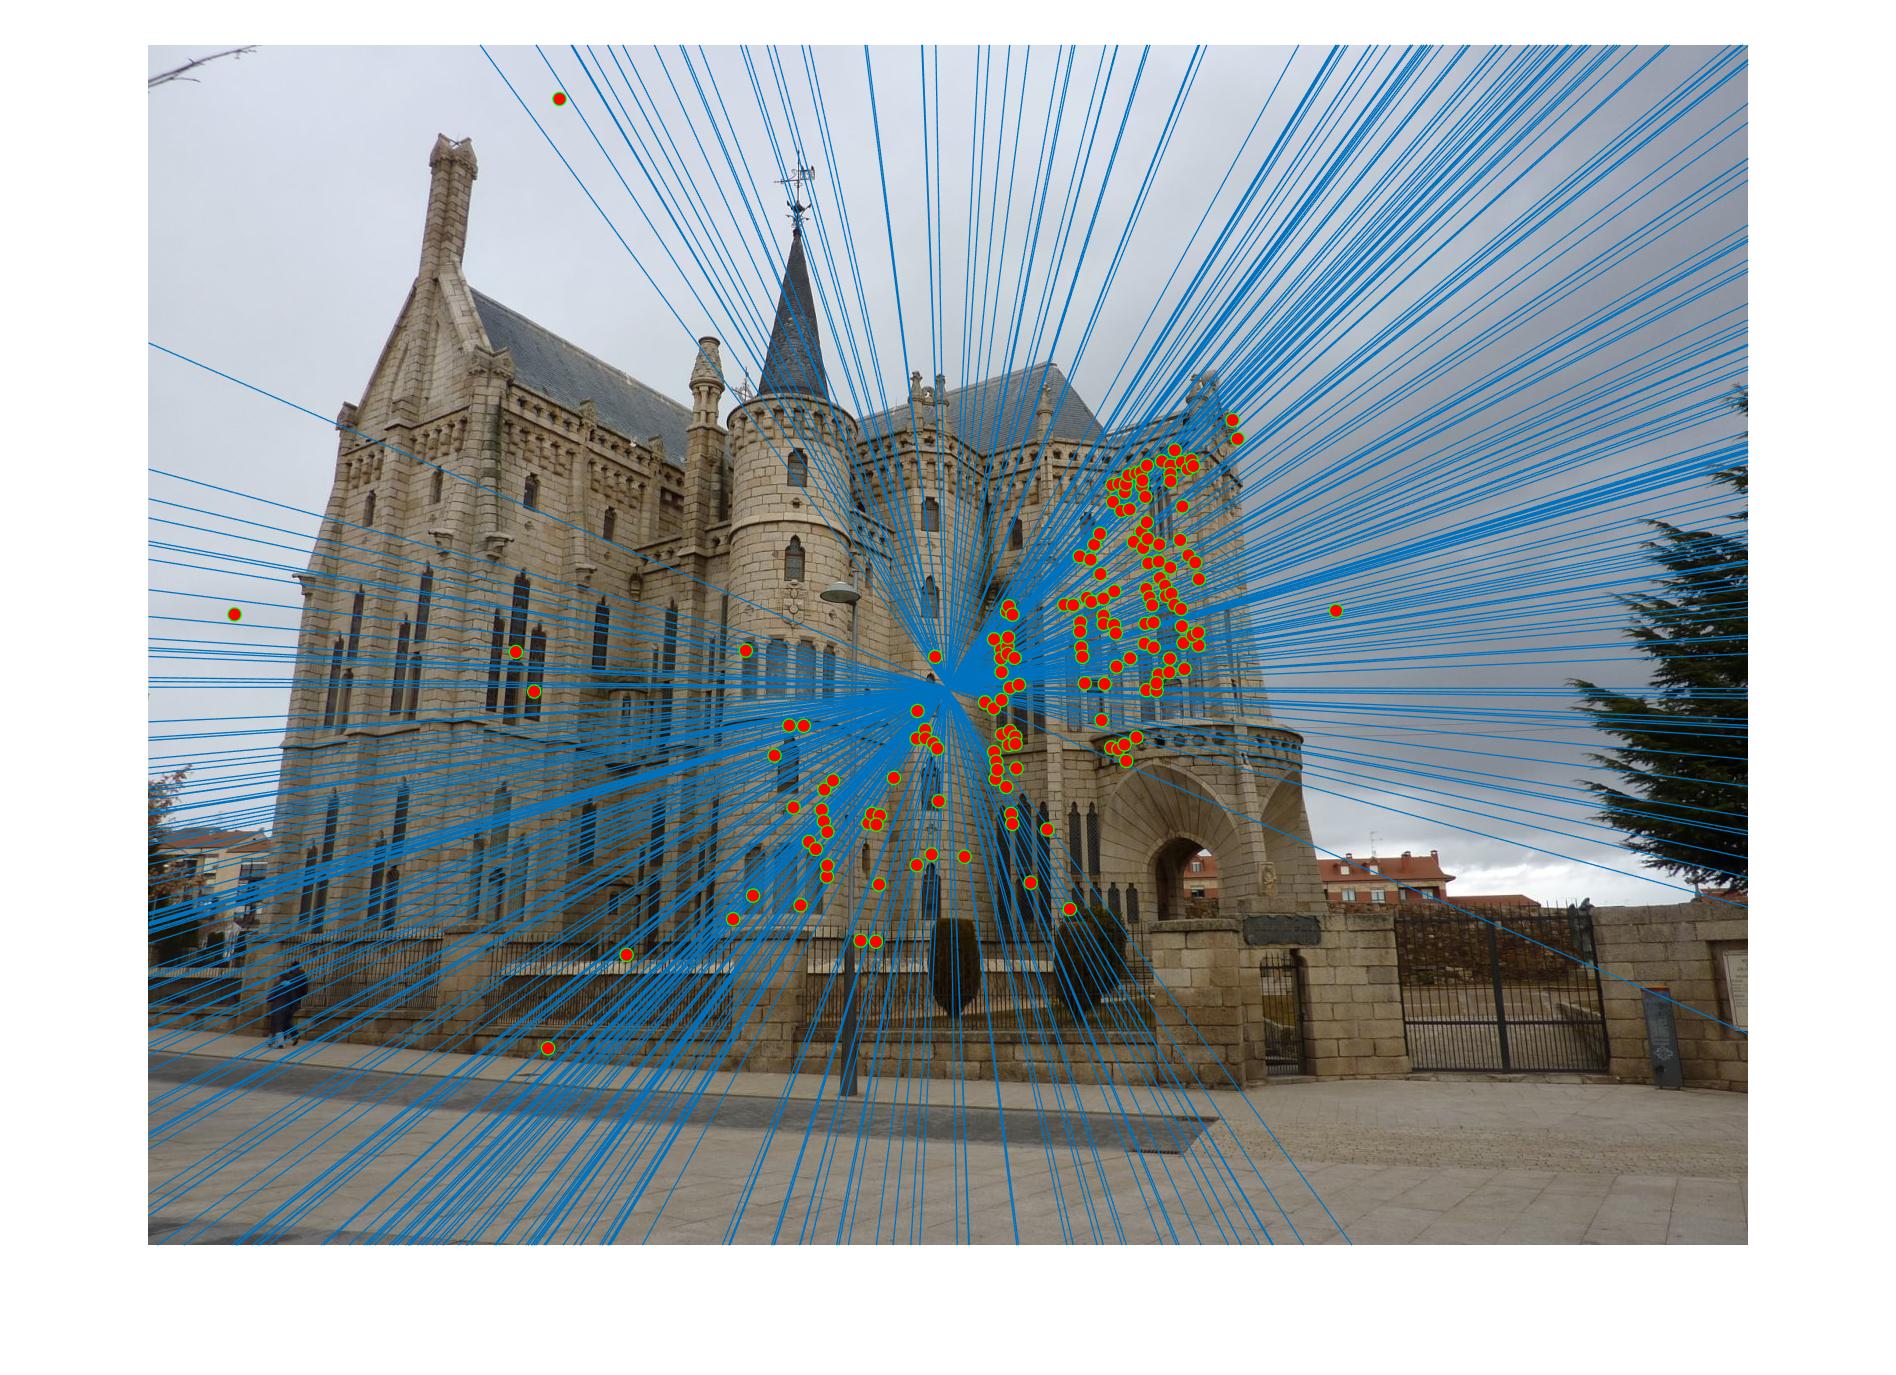
As previously discussed, the results above are far from perfect. These results are decent, but there are noticeable issues. In particular, some of the epipolar lines are far from what they should be. This is because these are the results before normalizing the points. Normalizing leads to better numerical conditioning (which in effect leads to less noise due to rounding errors). Below are some of the results after point-normalization. There were very notable differences for both the mount rushmore and gaudi image pairs. Both had much more accurate epipolar lines, and somewhat improved accuracy of matched points.
|
|