Project 3 / Camera Calibration and Fundamental Matrix Estimation with RANSAC
This project involved finding the camera projection matrix, which maps 3D coordinates to 2D image coordinates, the fundamental matrix, which relates 2D points from an image to another image, and then finally utilized RANSAC to find a fundamental matrix that was used to filter SIFT matches.
Part 1: Camera Projection Matrix
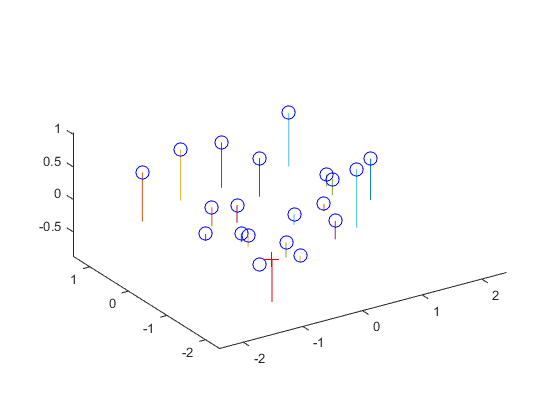
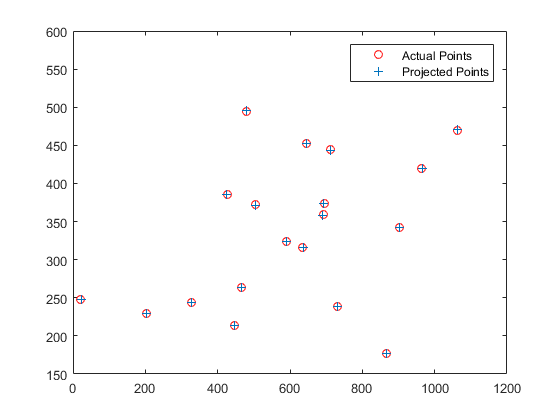
The camera projection matrix was found by solving a homogeneous linear system. The 2D image coordinates as well as the 3D world coordinates of the centers of the markers were provided. The 2D points were then reprojected into the 3D space using the found projection matrix, and the residuals were calculated to determine the accuracy of the matrix. The camera center was calculated using the found projection matrix.
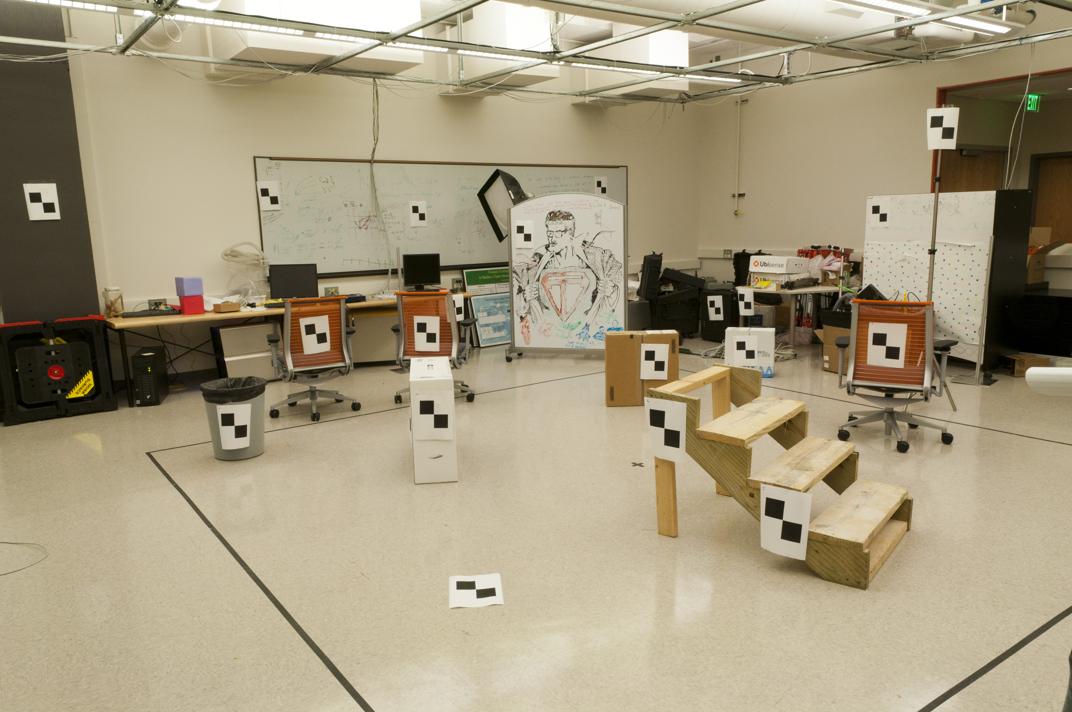
An image of a scene with markers of known 3D locations.
|
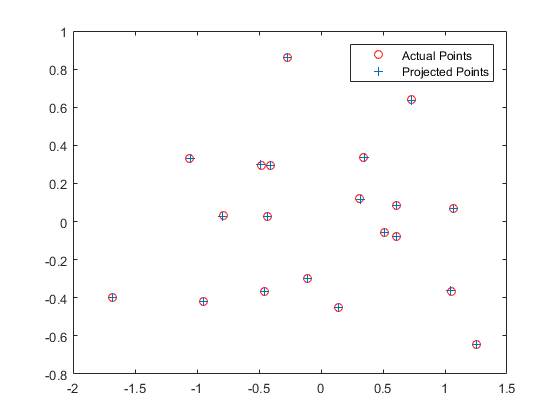
Left: The actual points vs the reprojected points. Right: The reprojected points shown in 3D, with the computed camera center shown as the red cross.
| 0.4583 | -0.2947 | -0.0140 | 0.0040 |
| -0.0509 | -0.0546 | -0.5411 | -0.0524 |
| 0.1090 | 0.1783 | -0.0443 | 0.5968 |
Total Residual = 0.0445
Center = <-1.5127, -2.3517, 0.2826>
Another example is shown, this time with the camera in a different position.
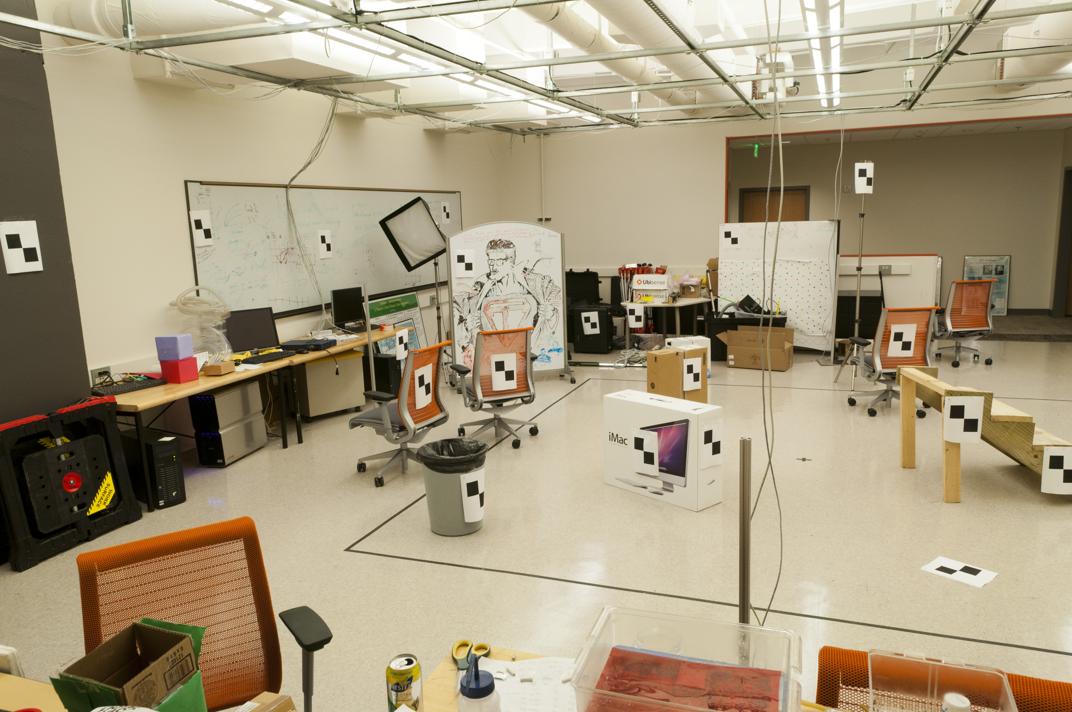
An image of a scene with markers of known 3D locations.
|
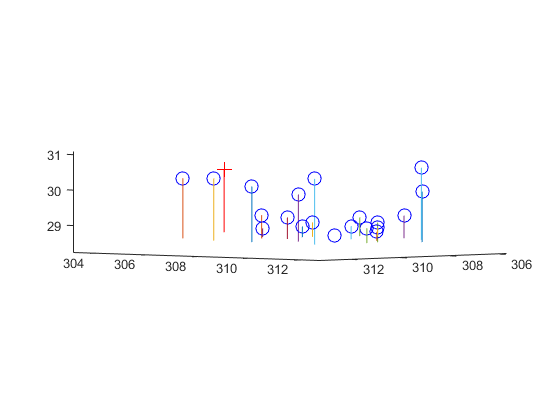
Left: The actual points vs the reprojected points. Right: The reprojected points shown in 3D, with the computed camera center shown as the red cross.
| 0.0069 | -0.0040 | -0.0013 | -0.8267 |
| 0.0015 | 0.0010 | -0.0073 | -0.5625 |
| 0.0000 | 0.0000 | -0.0000 | -0.0034 |
Total Residual = 15.5450
Center = <303.1000, 307.1843, 30.4217>
Part 2: Fundamental Matrix Estimation
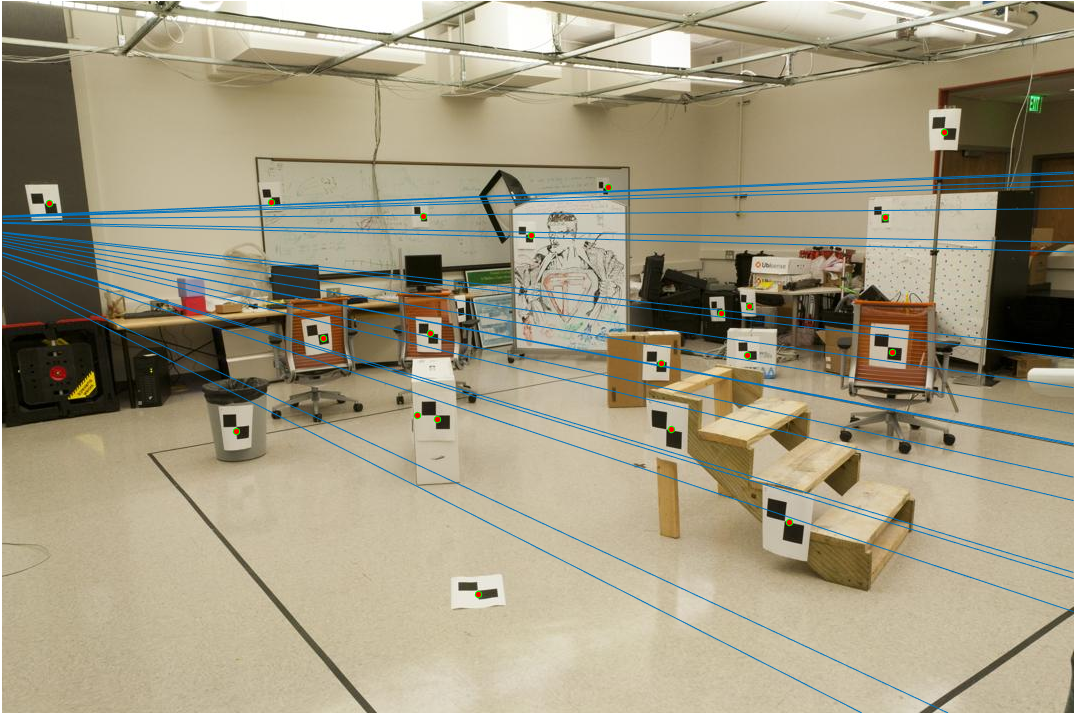
The fundamental matrix was solved for using the 8-point algorithm. The epipolar lines were then plotted to visualize the accuracy of the fundamental matrix. If it is correct, the lines should pass directly through the centers of the markers.
At first, the points were not normalized before applying the 8-point algorithm.
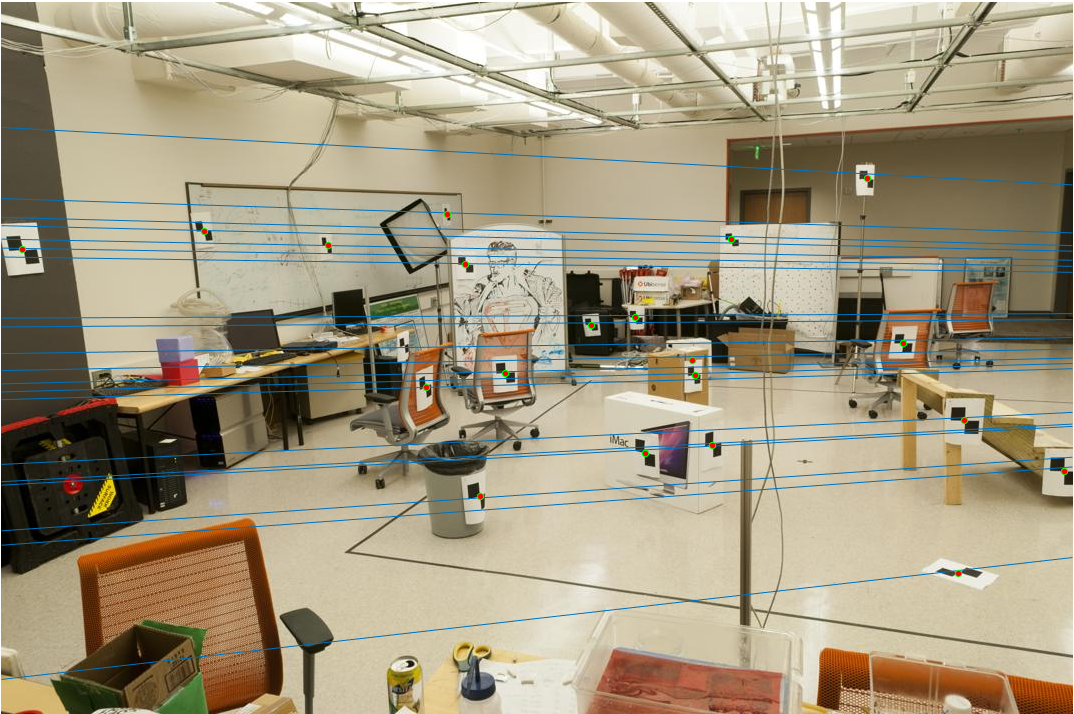
|
Epipolar lines from the calculated fundamental matrix using unnormalized points.
As seen in the image, the epipolar lines come close to the centers of the points, but sometimes does not intersect the center. Normalizing the before finding the fundamental matrix provides a solution to this issue. Normalization was done by first subtracting the mean X and Y coordinates from each pair, and then scaling the coordinates by the inverse of the standard deviation of the distances of the points to the mean coordinates.

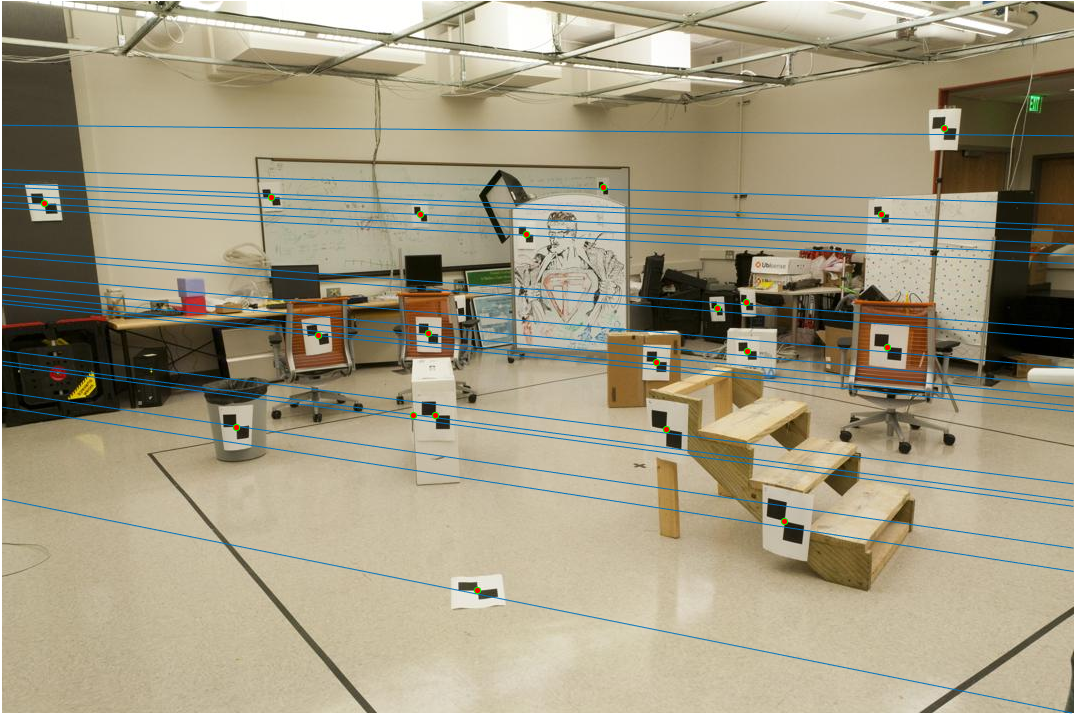
|
Epipolar lines from the calculated fundamental matrix using normalized points.
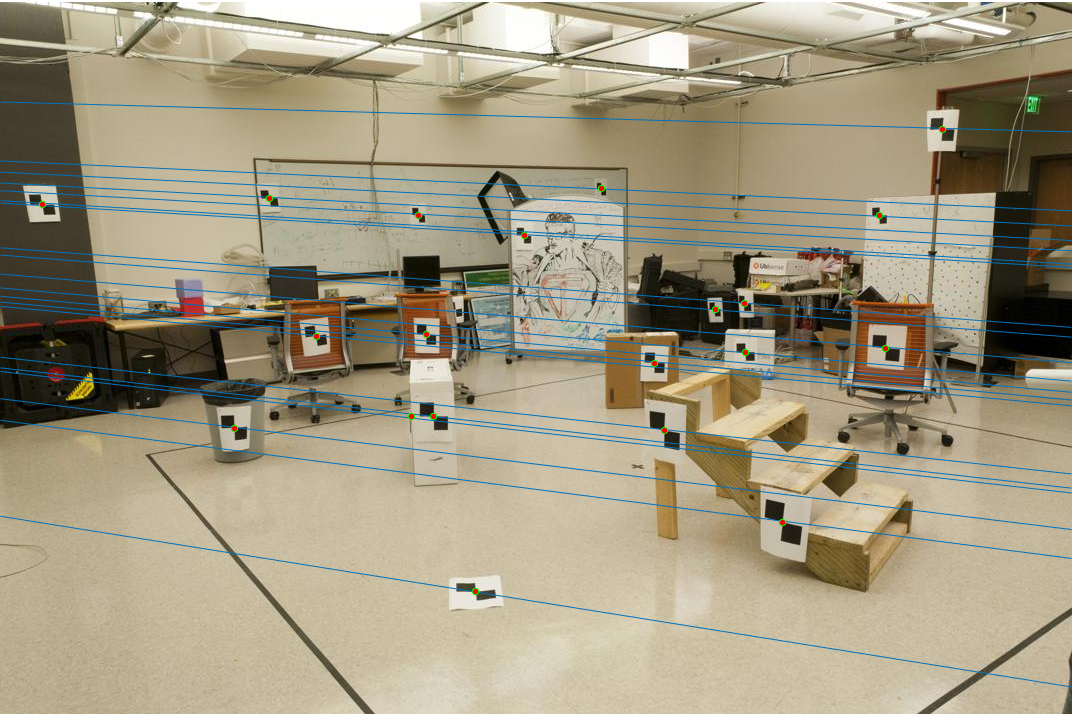
A more dramatic effect can be seen when noise has been added to the points. Without normalization, siginificant errors can be seen in the locations of the epipolar lines.
|
Epipolar lines from the calculated fundamental matrix using unnormalized, noisy points.
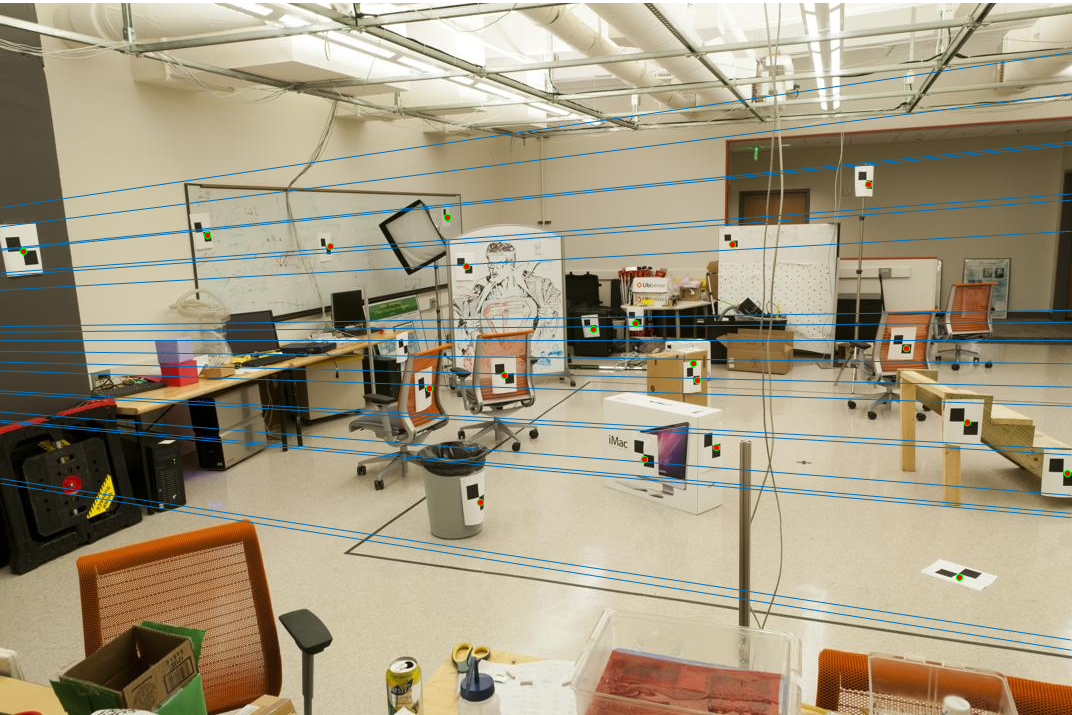
Normalizing the noisy points before finding the fundamental matrix provides much more accurate epipolar lines, as seen below.


|
Epipolar lines from the calculated fundamental matrix using normalized, noisy points.
Part 3: Fundamental Matrix with RANSAC
A fundamental matrix was used to filter through the thousands of SIFT feature correspondences that were found between the images. 50,000 iterations RANSAC were used to find the best fundamental matrix using 8 points at a time. A point pair was counted as an inlier if |x'*F*x| was less than a certain threshold. For these images, a threshold value of 0.1 was found to provide an accurate fundamental matrix that could be used to filter points.
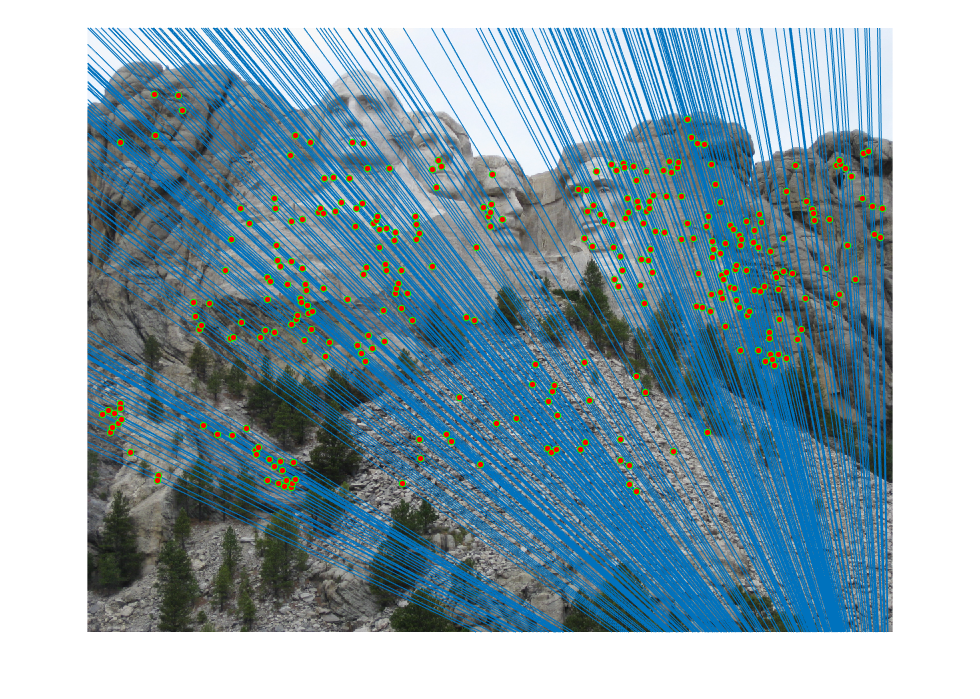
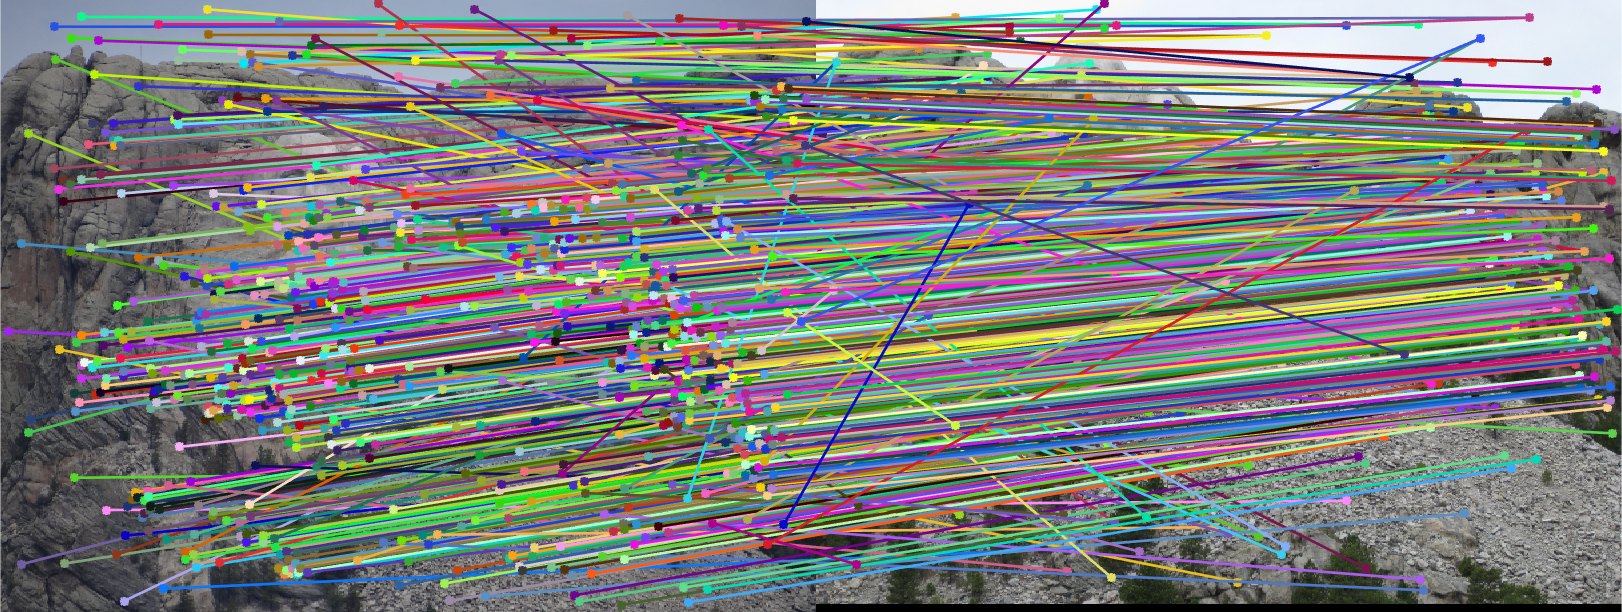
Mt. Rushmore
First SIFT correspondences were found, with some of the matches being incorrect. All of the matches are displayed below.
A fundamental matrix was then found through RANSAC. The epipolar lines and the inliers are visualized below.
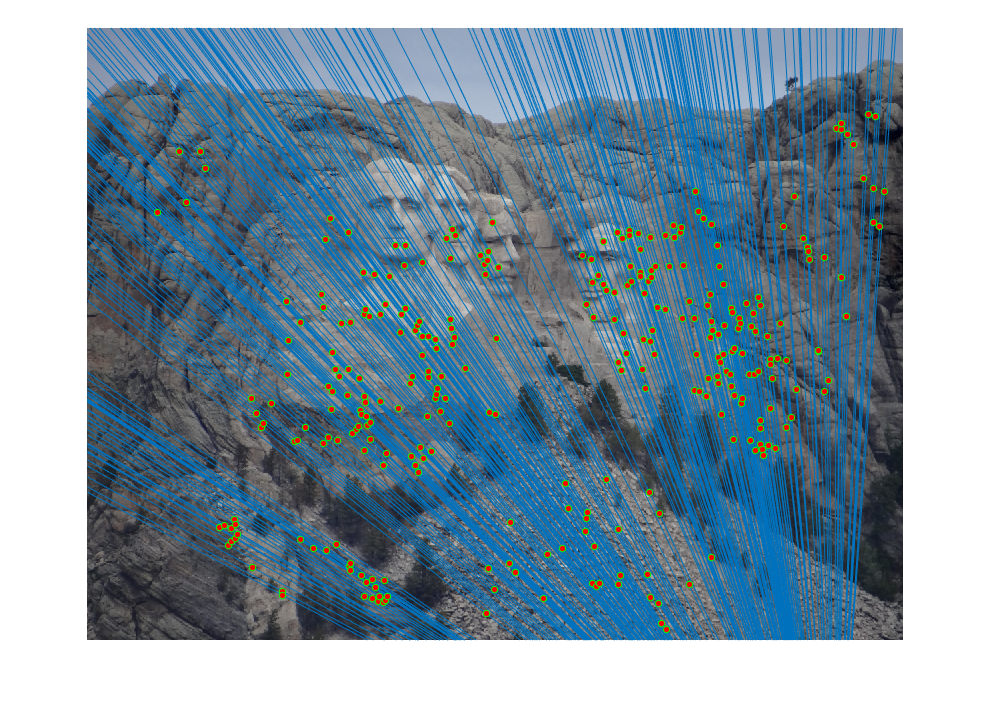
|
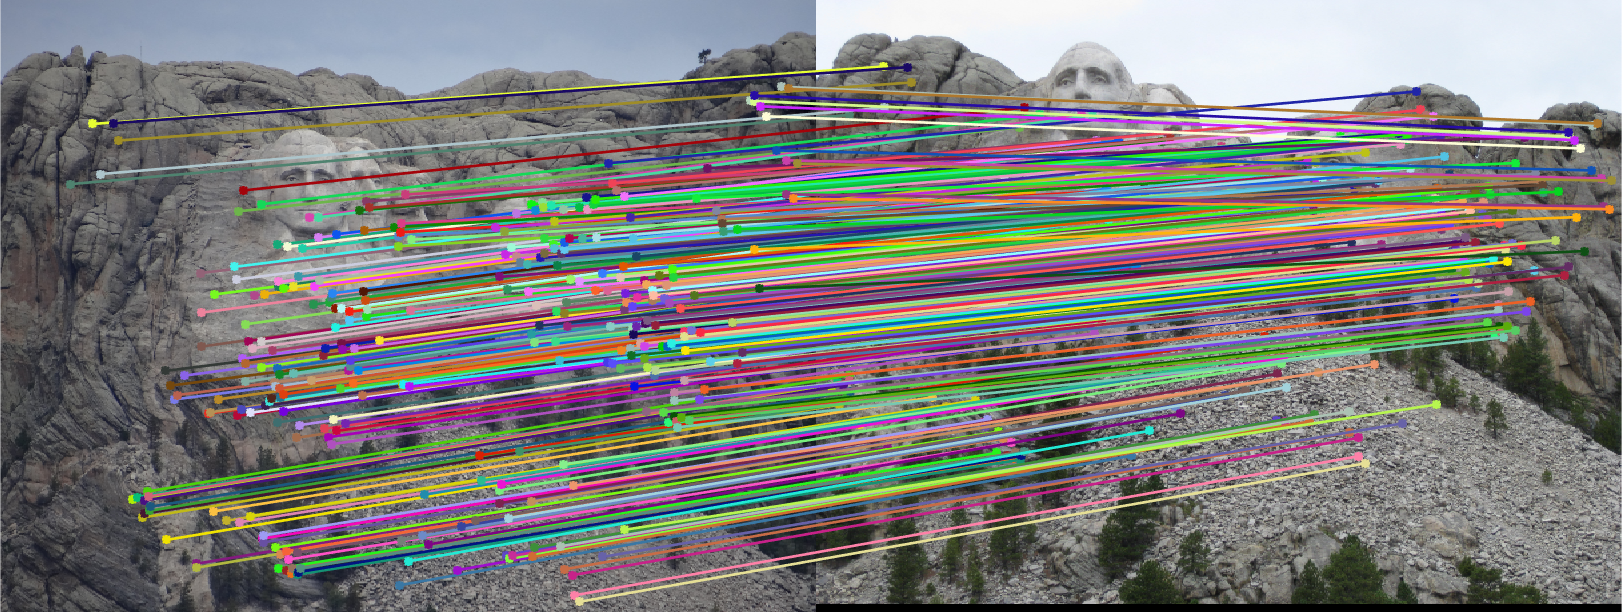
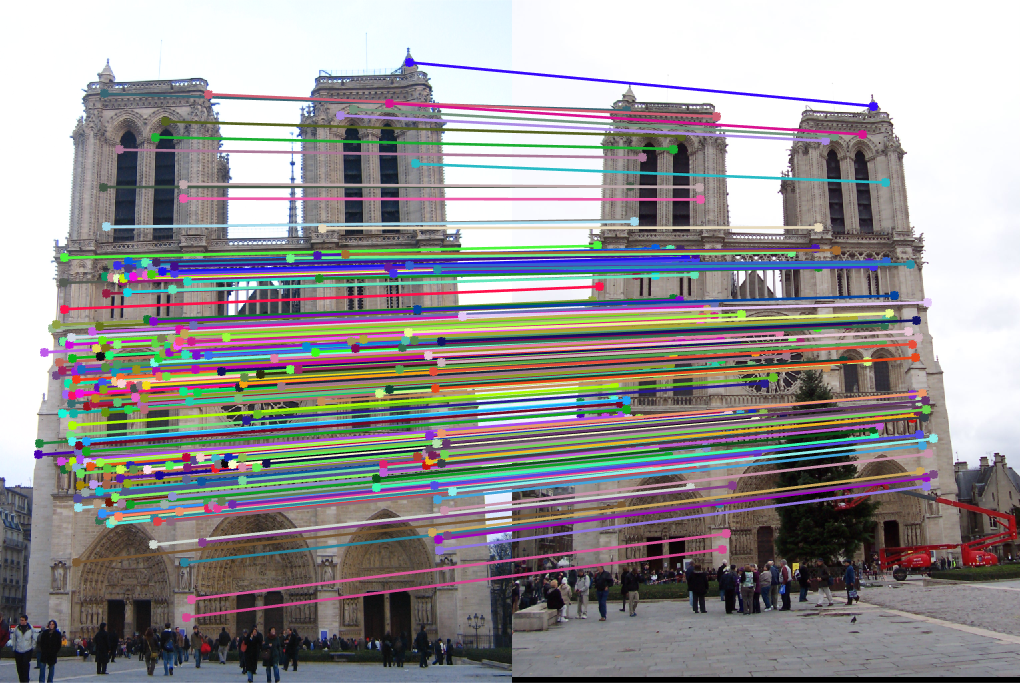
The fundamental matrix was then used to filter out any matches that were not inliers.
Notre Dame
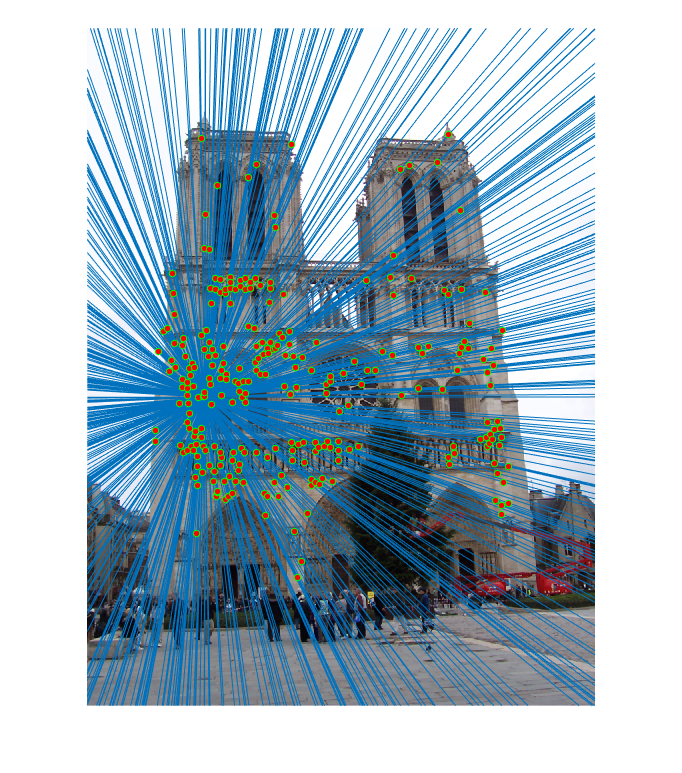
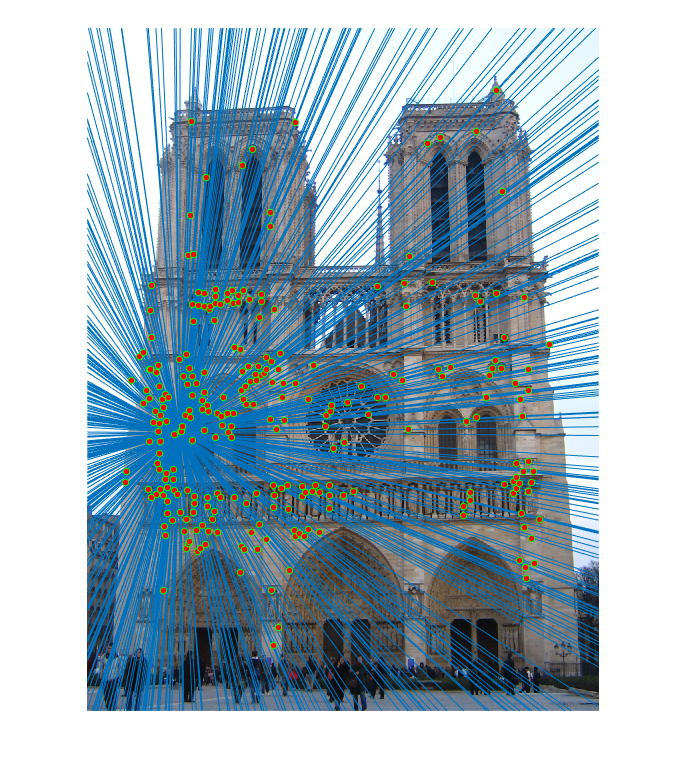
|
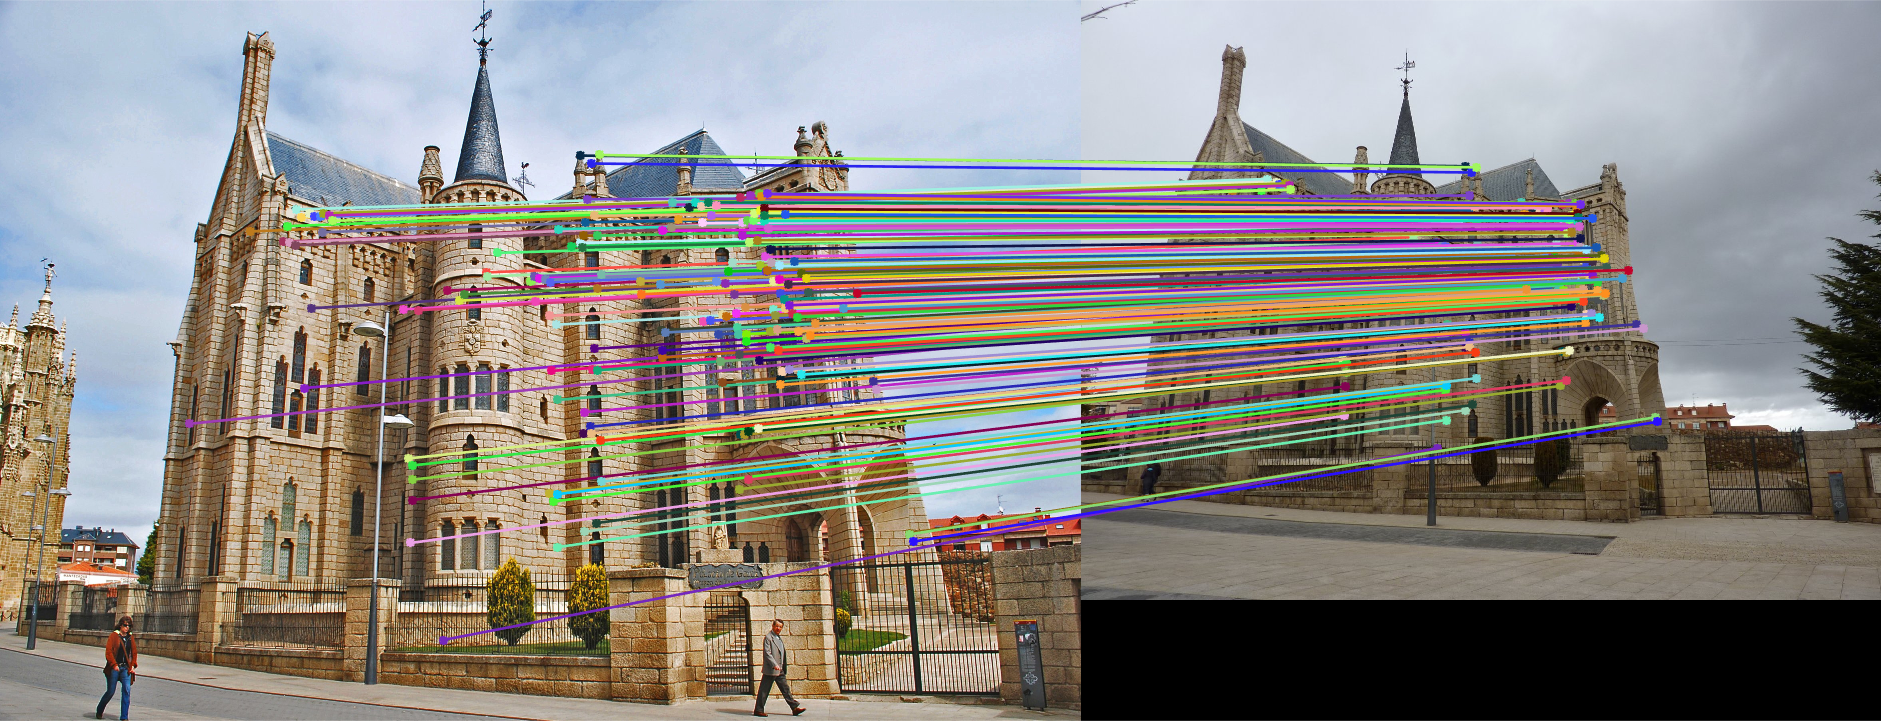
Gaudi
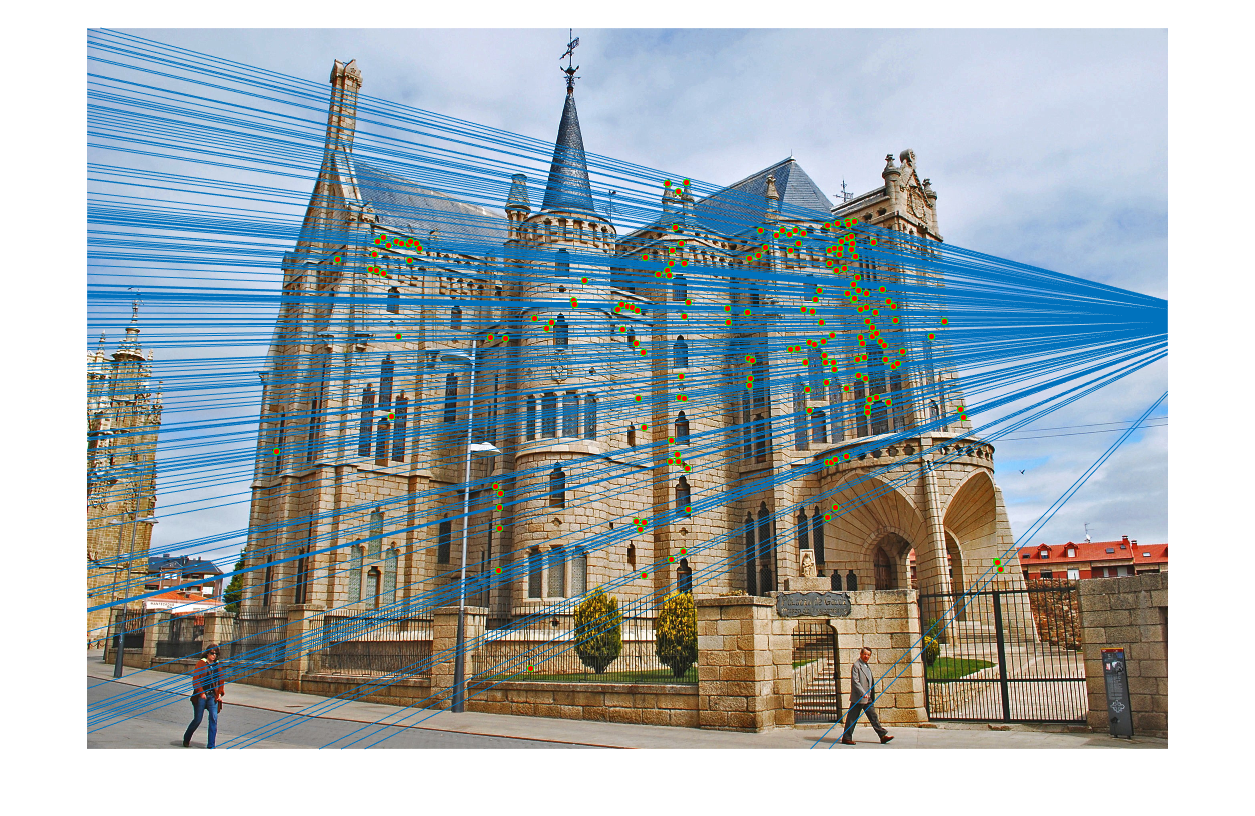
The Gaudi image pair was used to illustrate the effects of normalization on finding a useful fundamental matrix to filter SIFT matches. First, the results of the unnormalized process are shown.
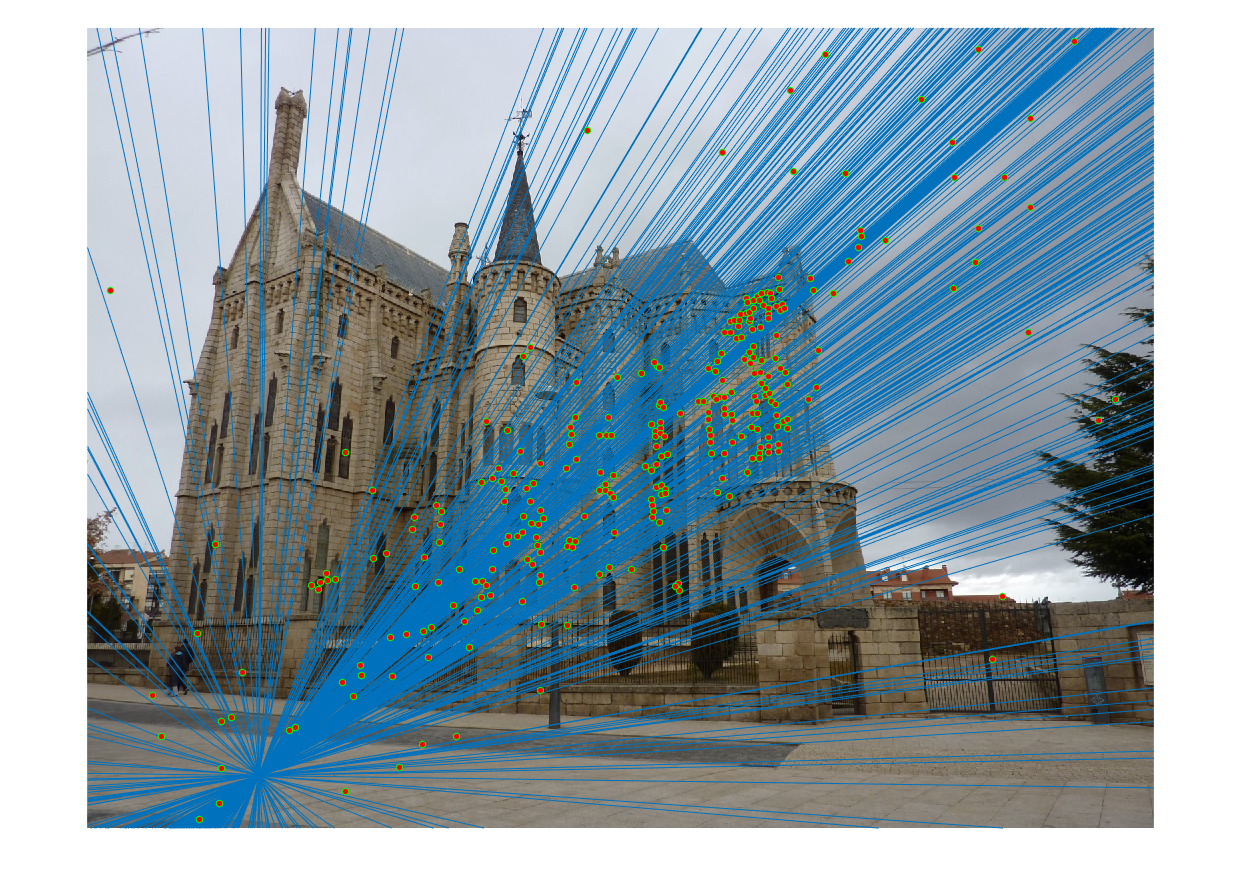
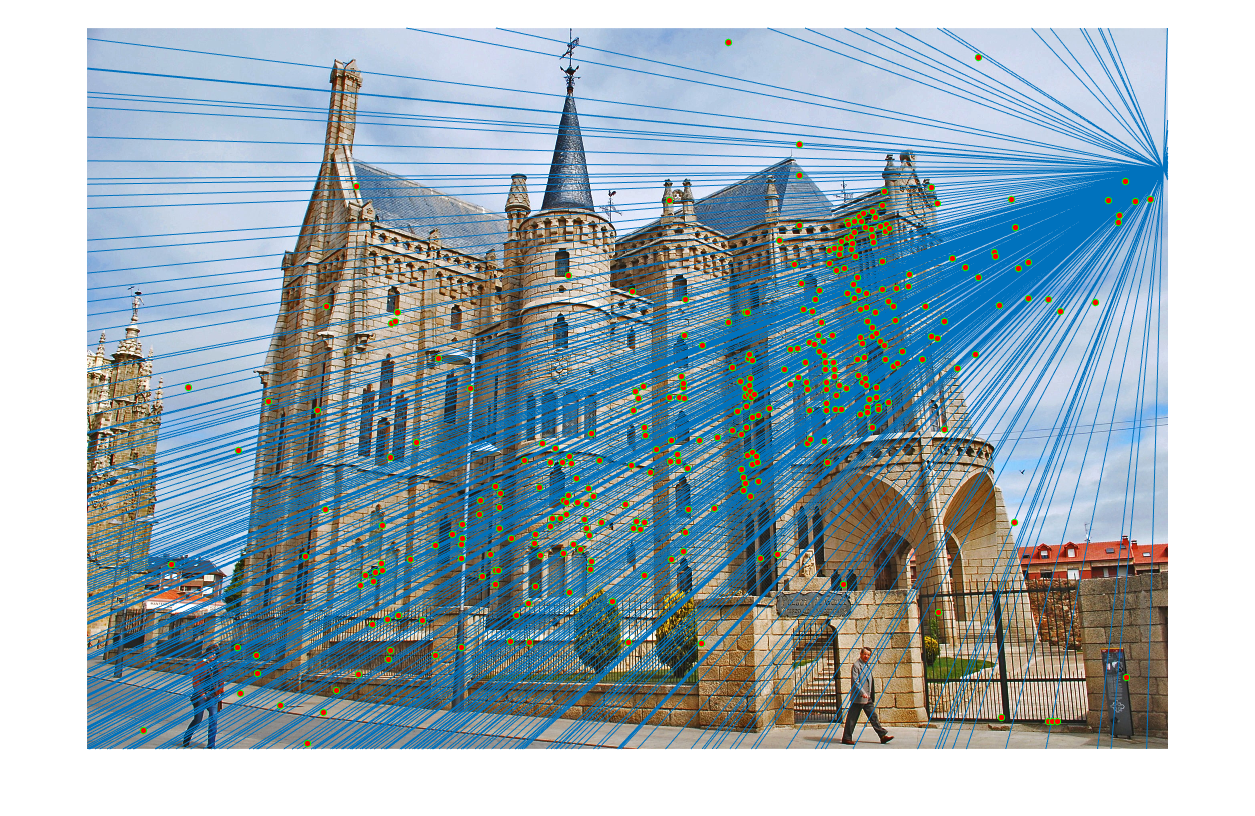
|
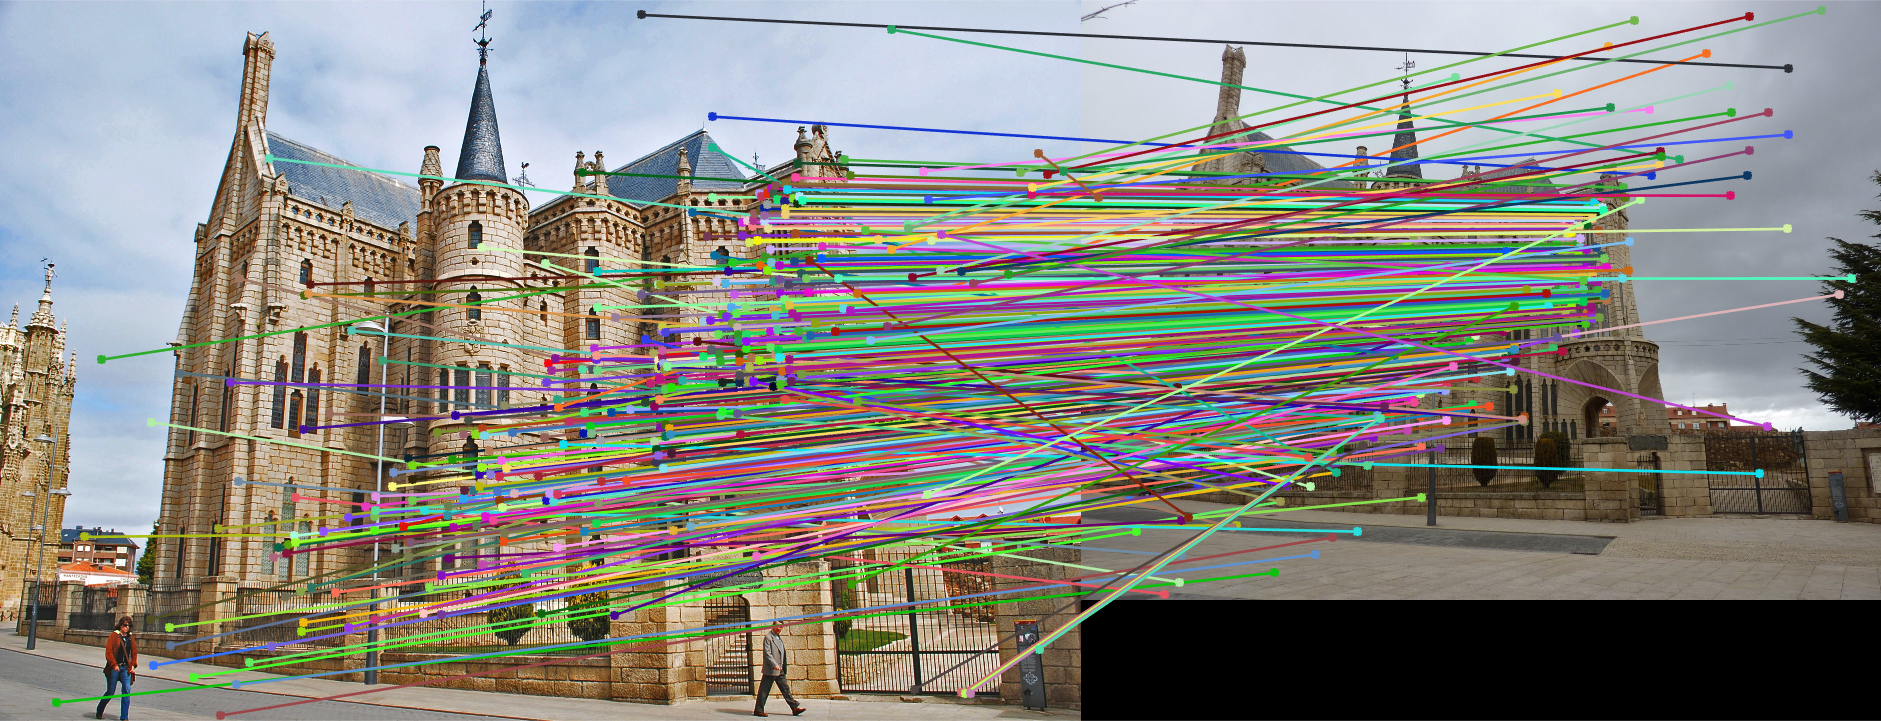
As seen, many incorrect matches are still left in final result. This is due to the difficulties in finding a correct fundamental matrix due to the unnormalized points. Upon adding normalization to the process, more accurate results are seen.
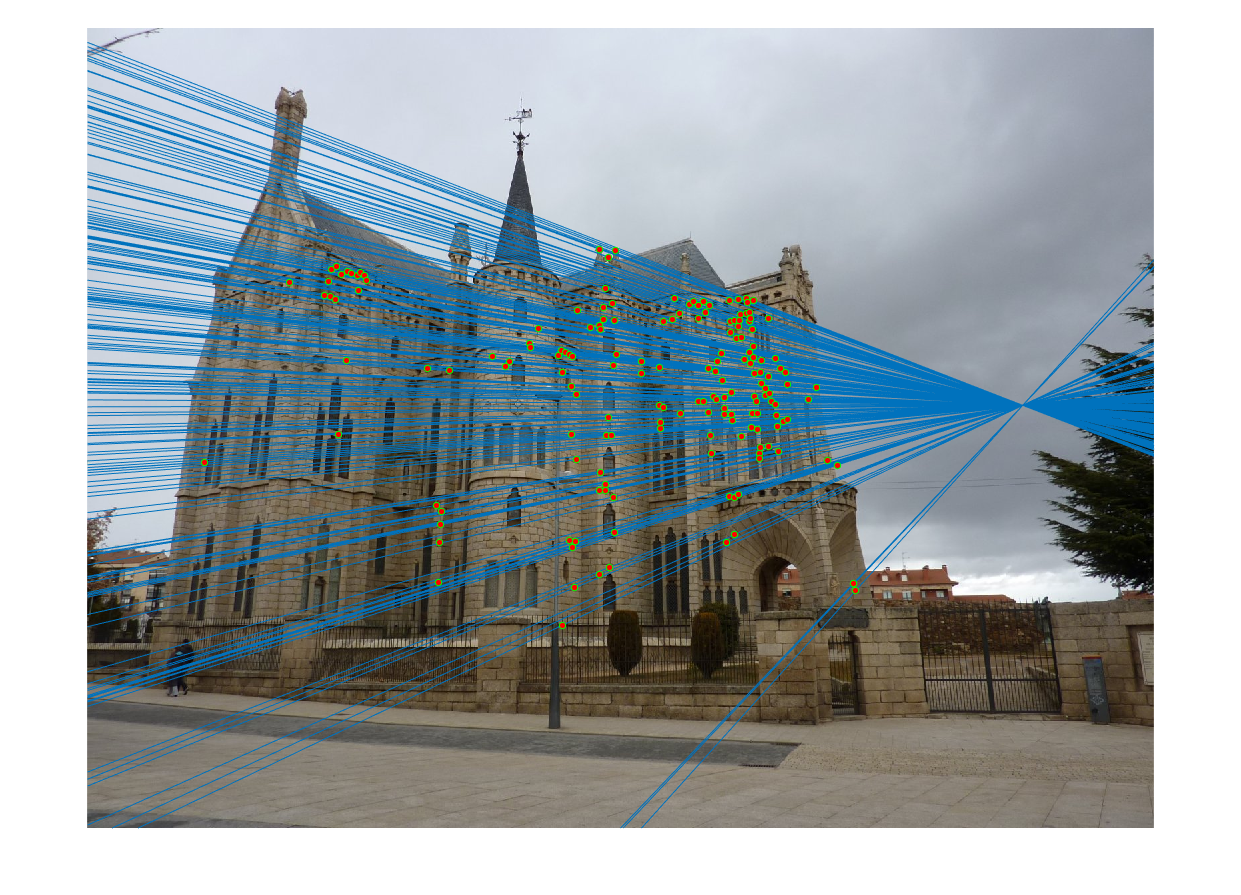
|