Project 4 / Scene Recognition with Bag of Words
We will be implementing 2 image representations and 2 classification techniques and run the code in the following ways.- Tiny images representation and nearest neighbor classifier
- Bag of SIFT representation and nearest neighbor classifier
- Bag of SIFT representation and linear SVM classifier
Tiny images representation
We resize the original image to a very small square sized image (16x16). The tiny images are zero mean and unit length (normalized) to increase performance. Any image is resized to the same square box, irrespective of its size. We test this on images sized 8*8, 16*16, 32*32 and 64*64. Though 32*32 gives the maximum accuracy for a constant value of K but with varying K (number of nearest neighbors), 16*16 gives us the best accuracy. Hence, we select 16*16 to be our final image size.Nearest neighbor classifier
We first find the pairwise distance matrix for test images vs train images. This gives us the euclidean distance between each test image and training image. We now sort this array row-wise and find a majority vote among the K closest train images for each test image. On testing for different values of K, we notice that K in the range 20 to 30 gives good results (around 24%-25% accuracy). Hence we pick an average value = 25 finally.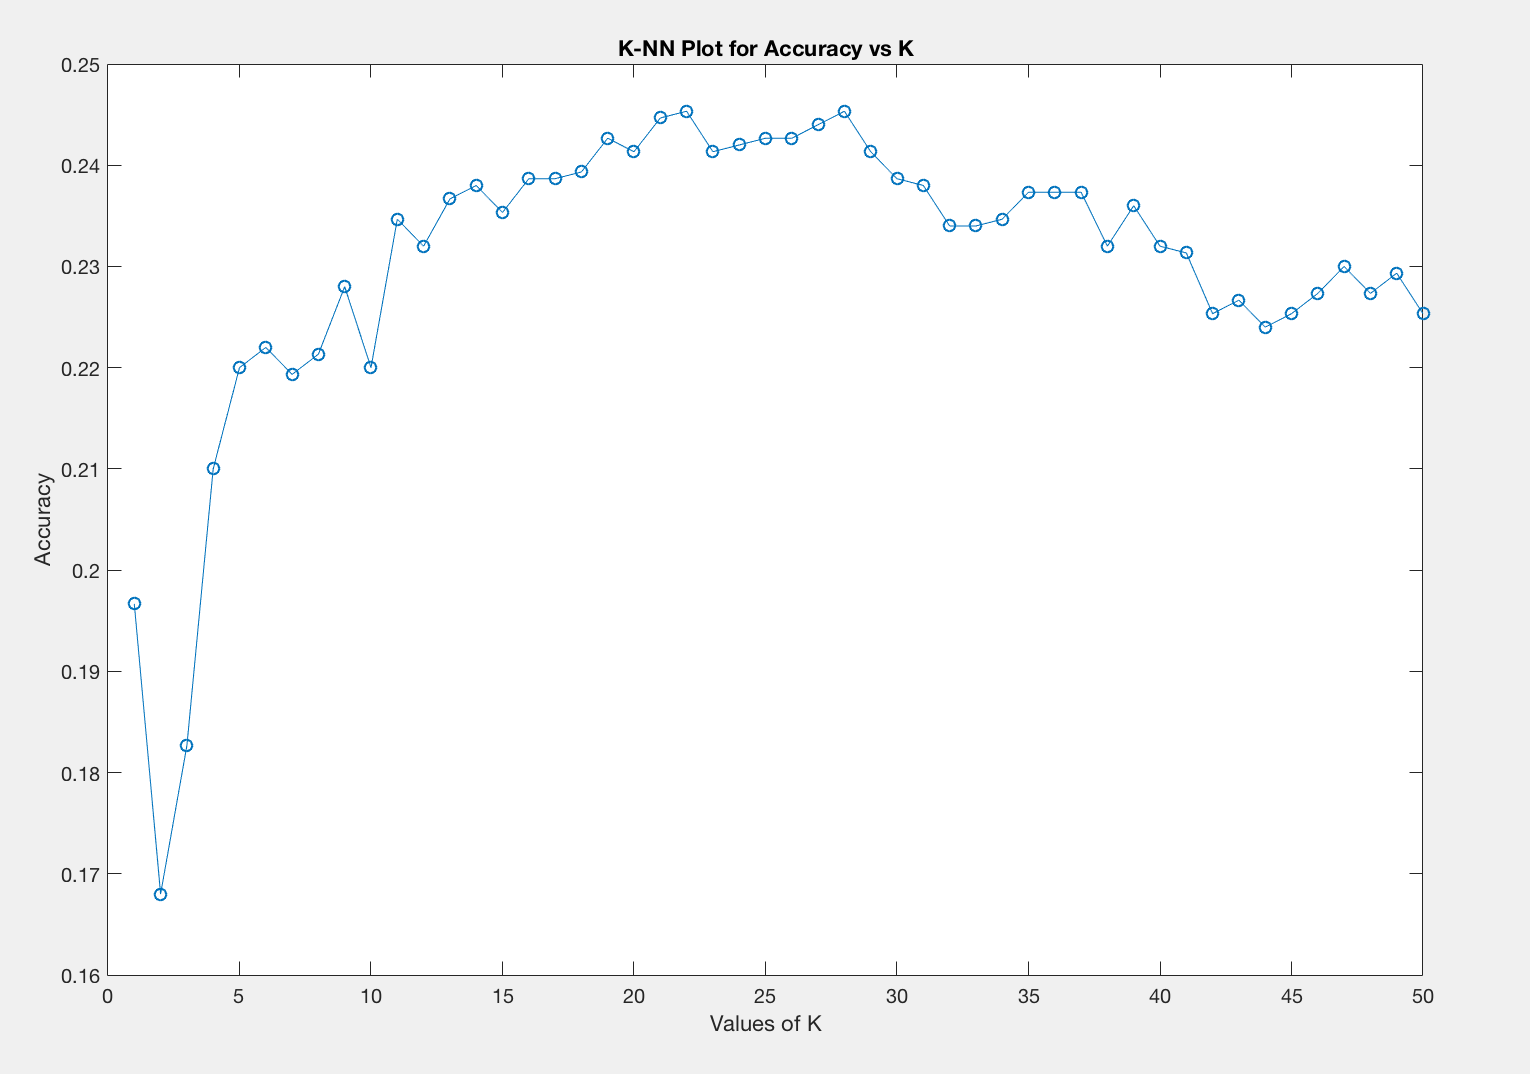
Tiny Image Size constant 16*16, varying K
1. Tiny images representation and nearest neighbor classifier
This leads us to run our first analysis. On running the code with image size = 16*16 and different values of K, we observe the following trends. We notice that for smaller values of K we do not get good accuracies. As we increase k to 20 we see a steady increase in the accuracy and the best accuracies lie between K=20 and K=30. We finally pick an average value of K=25.
Here we notice that the accuracy increases from 8 to 32 and then decreases for 64.
|
(8*8, 22.5%) (16*16, 24.3%) (32*32, 24.5%) (64*64, 24.3%) |
|
Bag of SIFT representation
build_vocabulary.m
We randomly sample 15 descriptors from each image. Once we have tens of thousands of SIFT features from many training images, we cluster them with k-means. The resulting centroids are now the visual word vocabulary.
get_bags_of_sifts.m
We construct SIFT features here by taking our input image and finding the closest SIFT features that we constructed from build_vocabulary. We now build a histogram indicating how many times each SIFT feature was used and normalize it for each image.
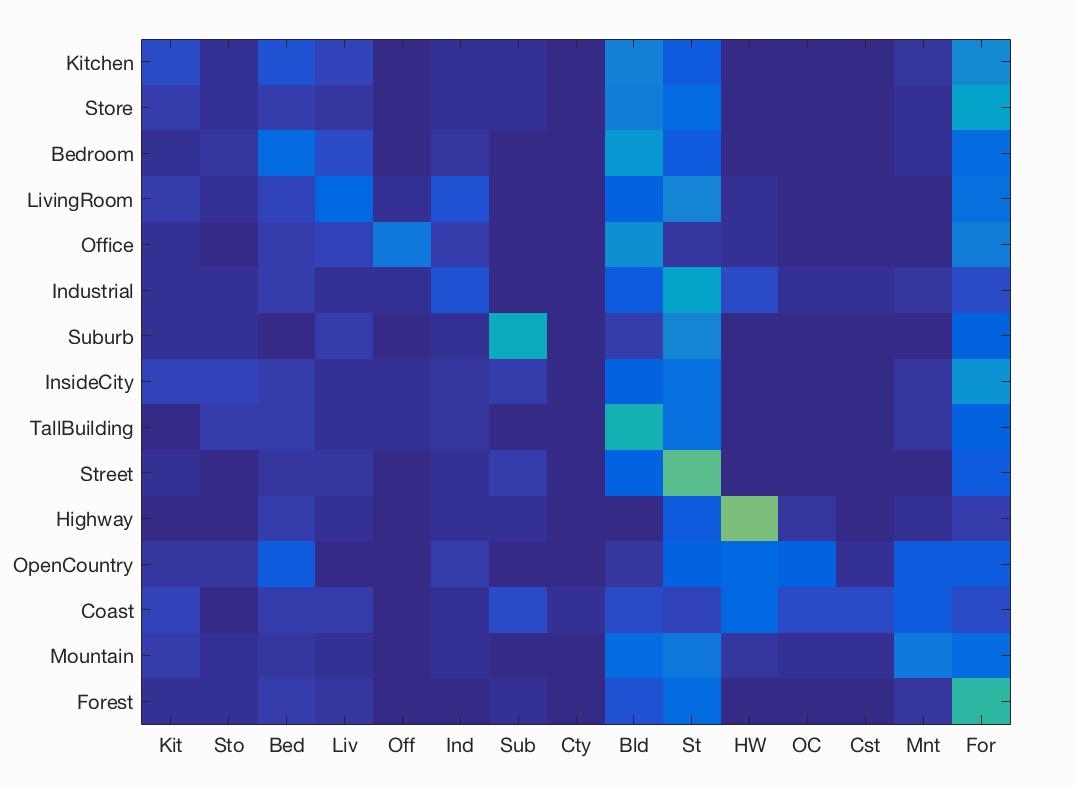
2. Bag of SIFT representation and nearest neighbor classifier
This leads us to run our second analysis. This gives an accuracy ranging from 60%-68% for different vocab sizes.Linear SVM classifier
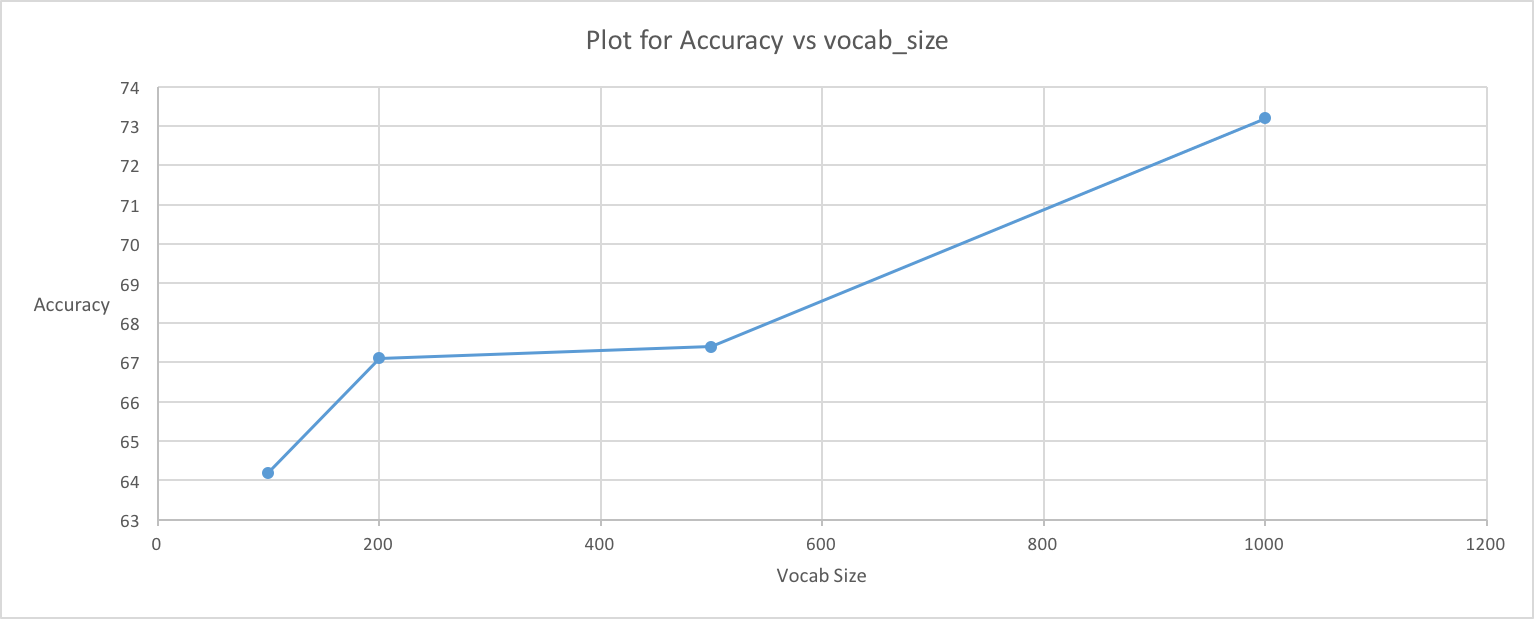
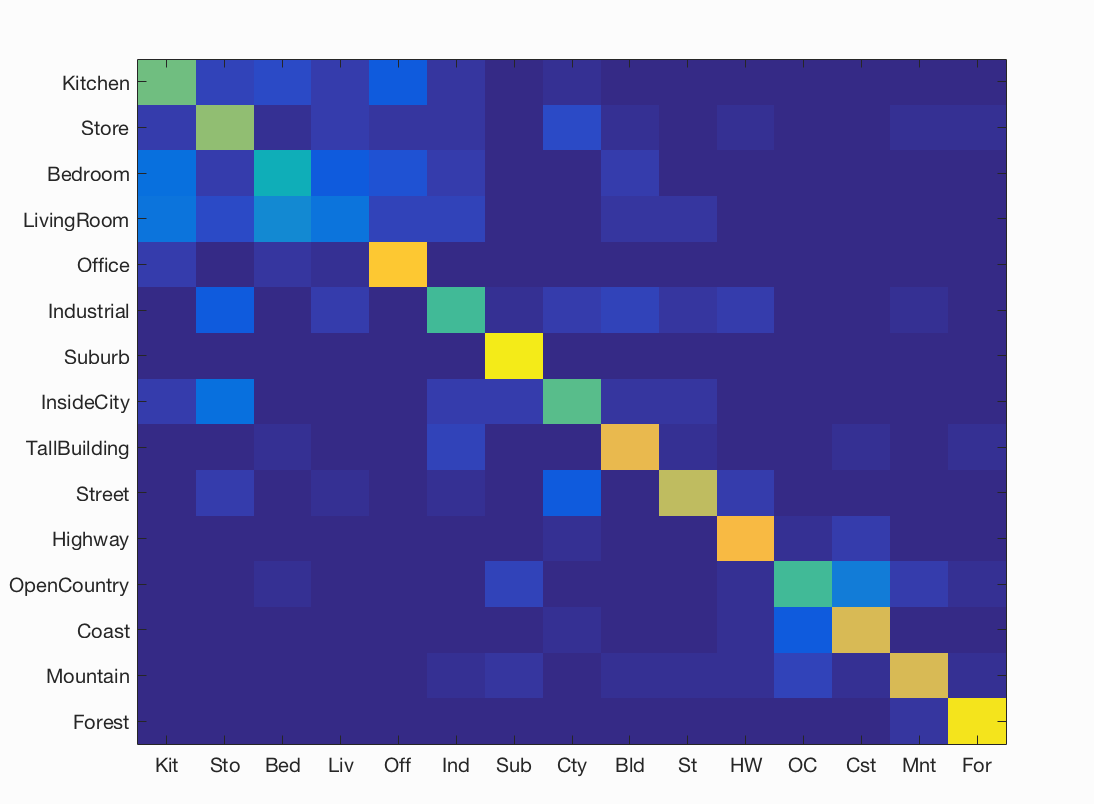
We now train 15 binary 1-vs-all linear SVMS to operate in the bag of SIFT feature space where each 1-vs-all classifier will be trained to recognize 'forest' vs 'non-forest', 'kitchen' vs 'non-kitchen', etc. All 15 classifiers will be evaluated on each test case and the classifier which is most confidently positive "wins". When learning an SVM, we modify the lambda parameter (for regularization) and set it to the most optimal value.3. Bag of SIFT representation and Linear SVM classifier
This leads us to run our third analysis. On running the code with vocab size in the range [100,200,500,1000], we observe that the accuracy of the model increases from 60% to 70%.
| Category name | Accuracy | Sample training images | Sample true positives | False positives with true label | False negatives with wrong predicted label | ||||
|---|---|---|---|---|---|---|---|---|---|
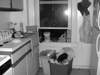
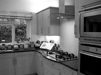
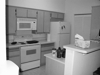
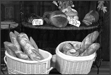
| Kitchen | 0.080 |  |
 |
 |
 |
 Industrial |
 Forest |
 Highway |
 Forest |
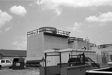
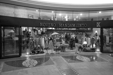
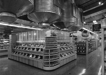
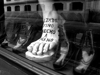
| Store | 0.040 | 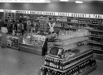 |
 |
 |
 |
 Office |
 TallBuilding |
 TallBuilding |
 Coast |
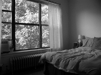
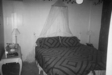
| Bedroom | 0.200 | 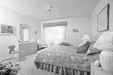 |
 |
 |
 |
 InsideCity |
 Store |
 OpenCountry |
 Mountain |
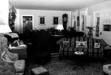
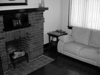
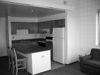
| LivingRoom | 0.100 | 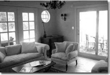 |
 |
 |
 |
 Office |
 Kitchen |
 Bedroom |
 Office |
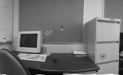
| Office | 0.190 |  |
 |
 |
 |
 Mountain |
 Bedroom |
 Industrial |
 InsideCity |
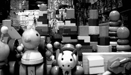
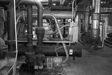
| Industrial | 0.130 |  |
 |
 |
 |
 LivingRoom |
 TallBuilding |
 InsideCity |
 Store |
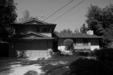
| Suburb | 0.470 |  |
 |
 |
 |
 Coast |
 InsideCity |
 Kitchen |
 Street |
| InsideCity | 0.030 |  |
 |
 |
 |
 Suburb |
 Coast |
 TallBuilding |
 Store |
| TallBuilding | 0.180 |  |
 |
 |
 |
 Store |
 Forest |
 LivingRoom |
 Coast |
| Street | 0.600 |  |
 |
 |
 |
 Kitchen |
 Store |
 Highway |
 Suburb |
| Highway | 0.750 |  |
 |
 |
 |
 Suburb |
 Industrial |
 Coast |
 Mountain |
| OpenCountry | 0.310 |  |
 |
 |
 |
 Forest |
 Kitchen |
 Suburb |
 Coast |
| Coast | 0.400 |  |
 |
 |
 |
 Mountain |
 Mountain |
 InsideCity |
 OpenCountry |
| Mountain | 0.290 |  |
 |
 |
 |
 Store |
 Bedroom |
 Kitchen |
 Forest |
| Forest | 0.140 |  |
 |
 |
 |
 Mountain |
 Street |
 Suburb |
Kitchen |
| Category name | Accuracy | Sample training images | Sample true positives | False positives with true label | False negatives with wrong predicted label | ||||