Project 4 / Scene Recognition with Bag of Words
Introduction
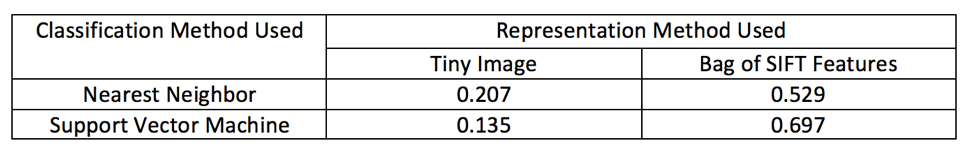
Image representations and Classification techniques are used widely in image recognition. The purpose of this project is to look at two representations (tiny image and bag of SIFT features) and two classification methods (nearest neighbor and linear support vector machine) and see how using different techniques and tweaking parameters can improve the accuracy of recognizing an image correctly.
Concepts and Algorithms
RepresentationsTiny Image
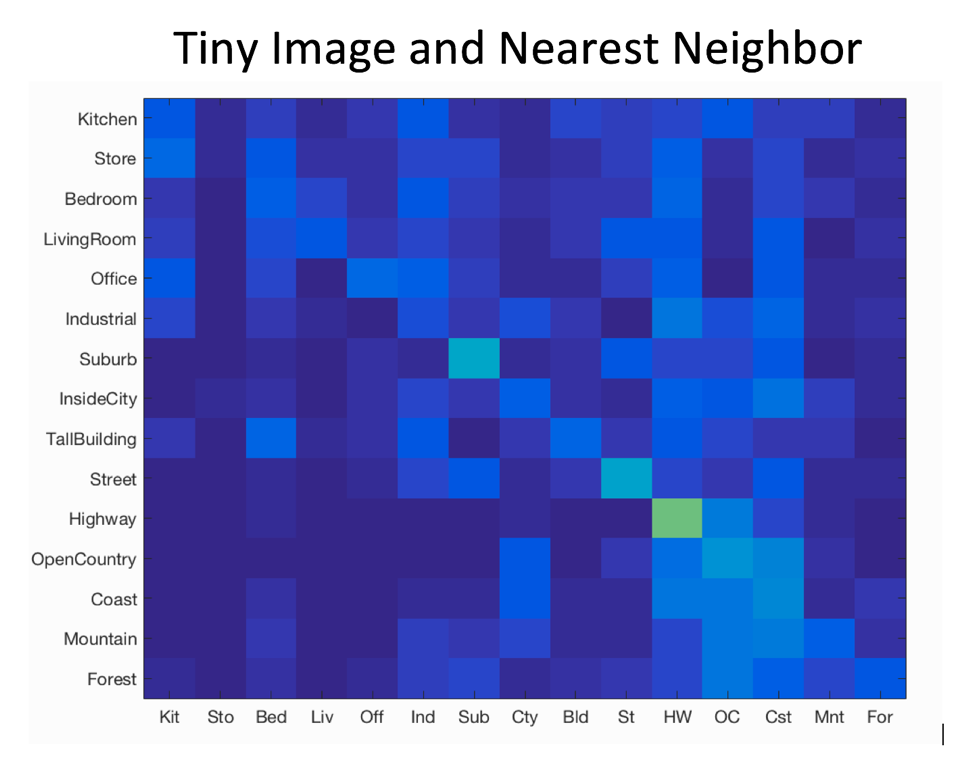
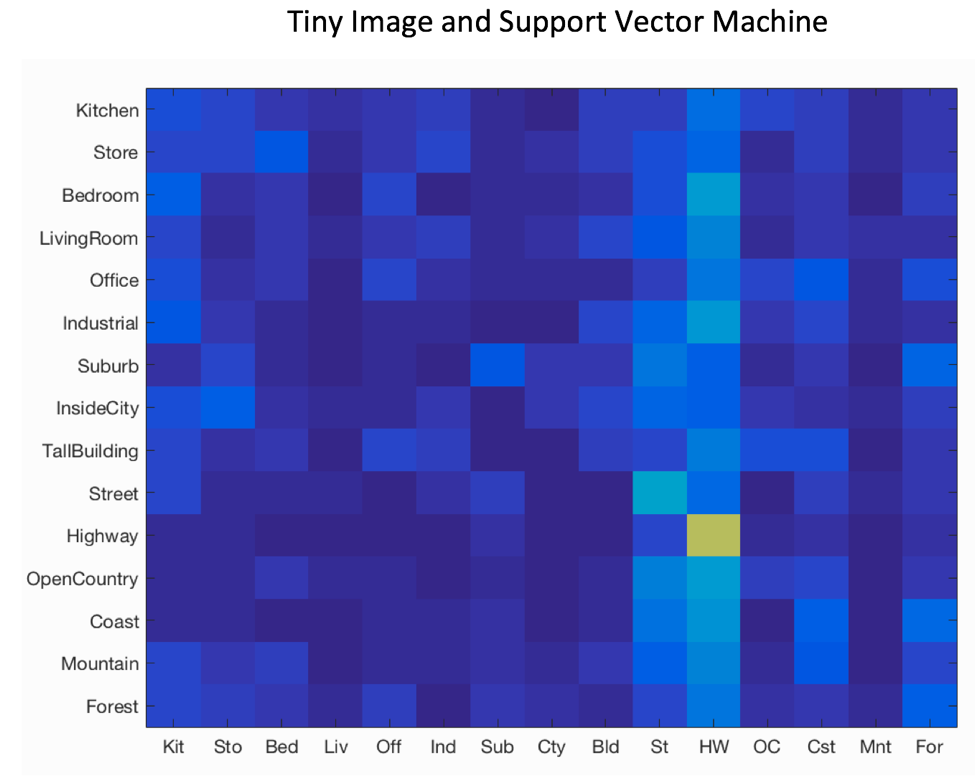
The idea behind this is that we would have sampled training data on multiple similar pictures in matrix form. When we choose a classifier, we would use this information and their corresponding labels to get the predicted labels of the test data. I first rescaled each of the given images to a 16 x 16 form. Then I vectorized this making it a 1 x 256. Tiny images give poor results because when we rescale the image, it takes out the higher frequencies, so a lot of information about the image is discarded. To combat this, I normalized each vector.
Bag of SIFT Features
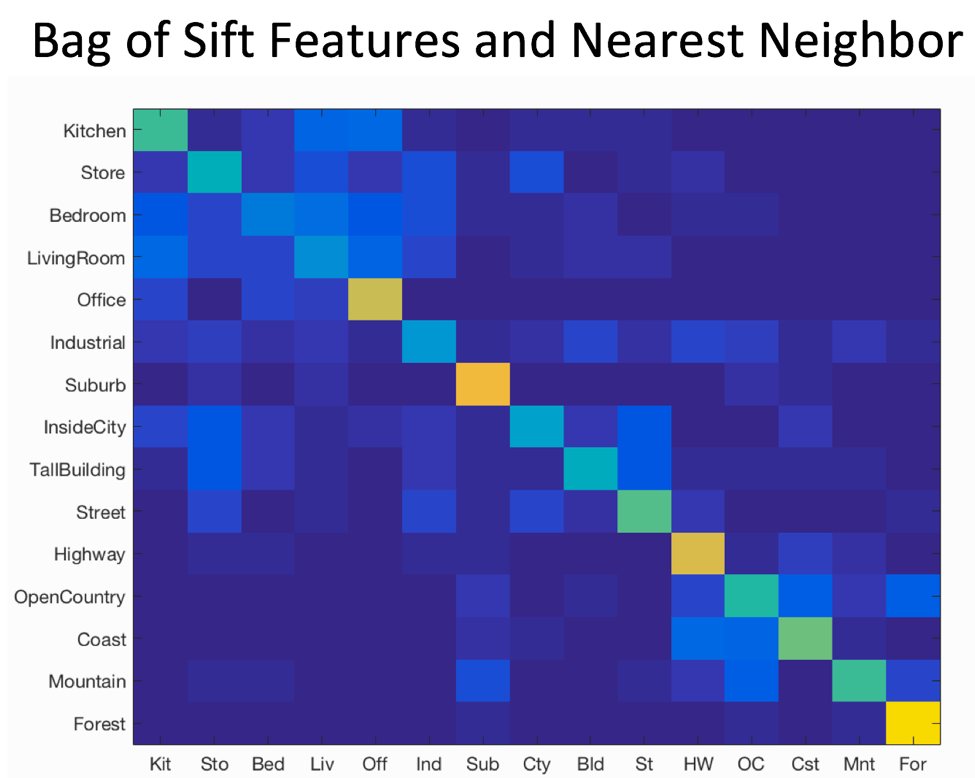
Before we can represent our training and testing images as bag of feature histograms, we first need to establish a vocabulary of visual words. I created this vocabulary by sampling many local features from the training set and then clustering them with kmeans. The number of kmeans clusters is the size of our vocabulary and the size of our features. Code wise, I loop through each of the images and get the corresponding sift features tuned to step size and bin size. At the end, I would have a matrix of features, with each row representing the sift features of that image. From that, I would cluster these with kmeans and return the cluster centers. After creating this vocabulary, for each image we will densely sample many SIFT descriptors. Instead of storing hundreds of SIFT descriptors, we simply count how many SIFT descriptors fall into each cluster in our visual word vocabulary. This is done by finding the nearest neighbor kmeans centroid for every SIFT feature. Code wise, the calculations to get the sift features were the same from getting the vocabulary. To figure out the closest cluster center for every SIFT feature, I calculated pairwise for every single feature with the vocabulary and find the minimum distance.
ClassificationsNearest Neighbor
Nearest Neighbor helps determine the prediction that we should get to our test data based on the label of the closest feature. First I found the distance matrix that calculates every distances between the training and testing features. After that, I would find the minimum distance which is our closest neighbor and assign our label based on that label.
Linear Support Vector Machine
Support Vector Machines aims to create a hyperplane that divides the based on the classifications and features. By using this hyperplane, based on the features of an image, we can determine where in the feature space does this image belong in. And once we find that out, we classify it based on that hyperspace label. Codewise, for each category, I first get the predictions where the train_labels match a particular category. This is useful for creating the binary labels for each SVM training task. Then I had to refactor the predictions to either be binary either a -1 or 1. Then I trained the linear svm with the corresponding training features and the binary predictions with a lamda value of 0.0001. After which, I calculated the confidences by multiply the features with the weights and use the one with the highest value as my prediction.
Results
Confusion Matrix for Each
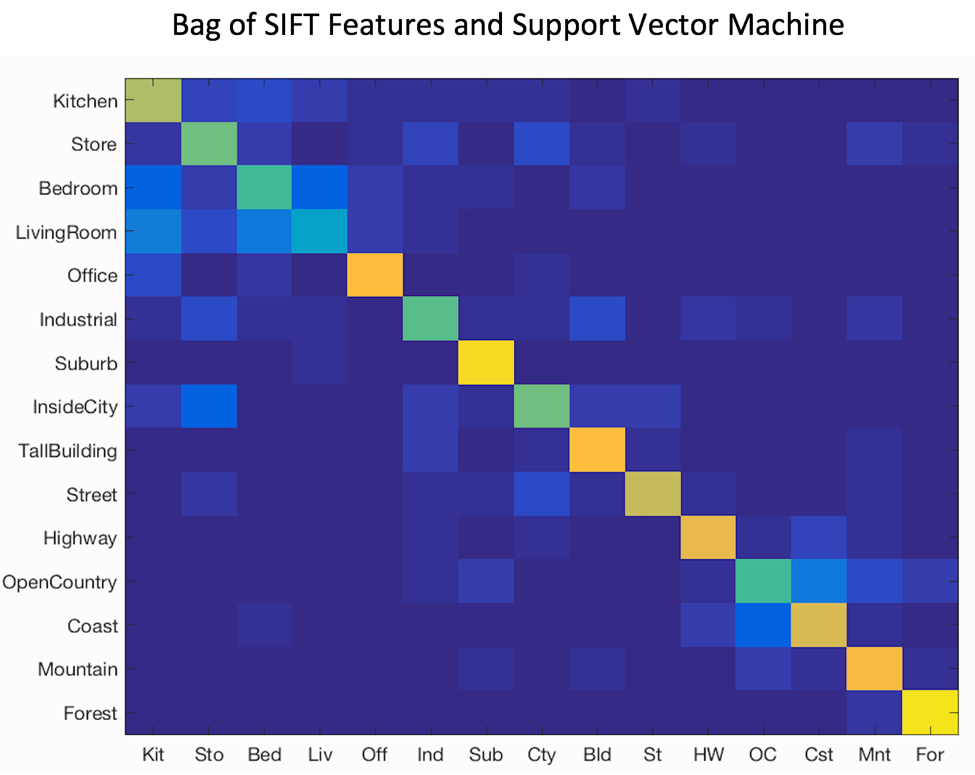
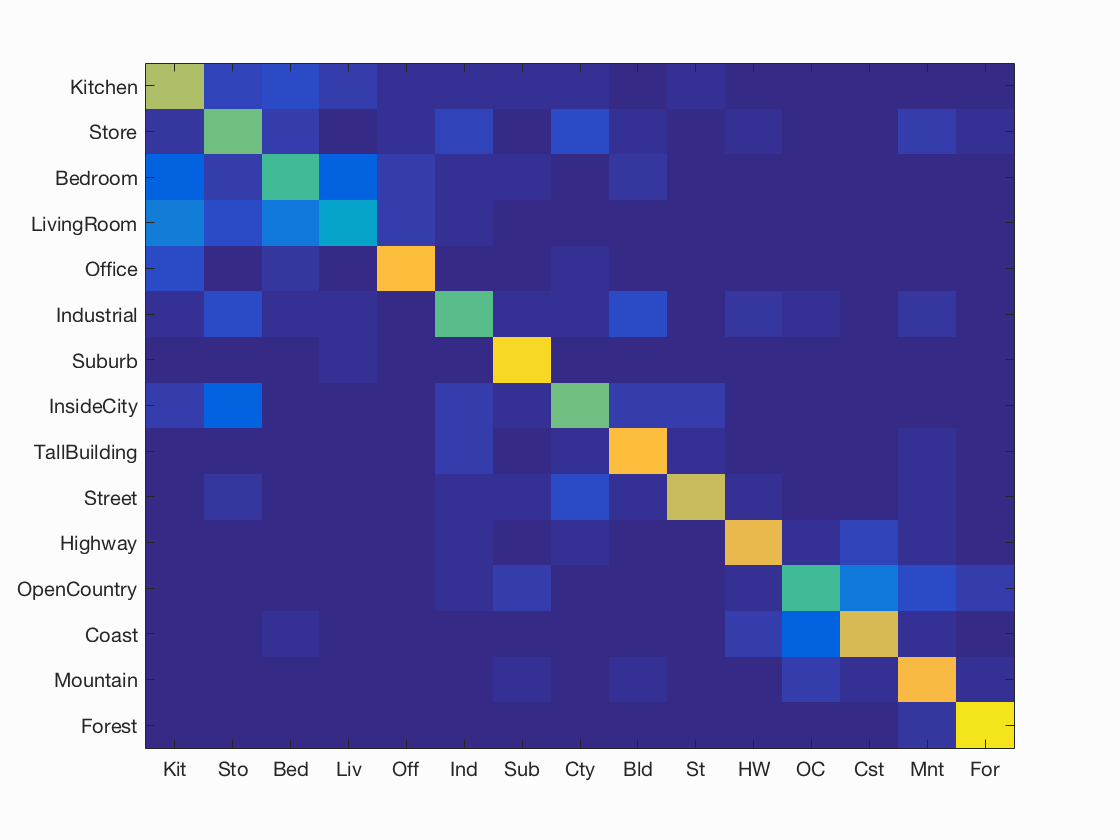
Best Accuracy With Bag of Sift Features and SVM
 Accuracy (mean of diagonal of confusion matrix) is 0.697
| Category name | Accuracy | Sample training images | Sample true positives | False positives with true label | False negatives with wrong predicted label | ||||
|---|---|---|---|---|---|---|---|---|---|
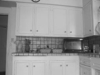
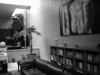
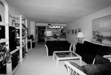
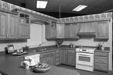
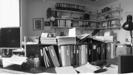
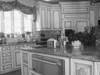
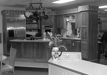
| Kitchen | 0.680 |  |
 |
 |
 |
 LivingRoom |
 LivingRoom |
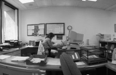
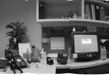
 Office |
 Store |
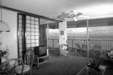
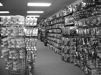
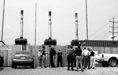
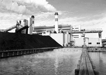
| Store | 0.590 |  |
 |
 |
 |
 Industrial |
 Street |
 Forest |
 Mountain |
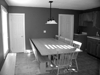
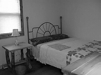
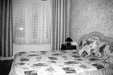
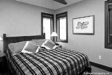
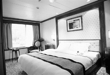
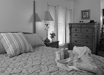
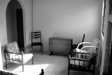
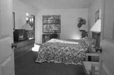
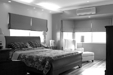
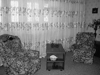
| Bedroom | 0.530 | 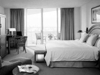 |
 |
 |
 |
 Store |
 LivingRoom |
 Kitchen |
 Store |
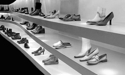
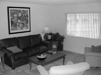
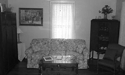
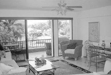
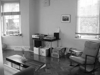
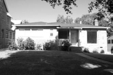
| LivingRoom | 0.360 | 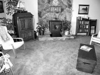 |
 |
 |
 |
 Kitchen |
 Bedroom |
 Bedroom |
 Kitchen |
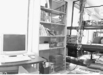
| Office | 0.840 | 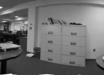 |
 |
 |
 |
 Bedroom |
 LivingRoom |
 Kitchen |
 InsideCity |
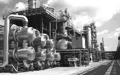
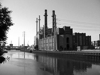
| Industrial | 0.560 | 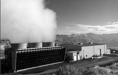 |
 |
 |
 InsideCity |
 Kitchen |
 OpenCountry |
 Bedroom |
|
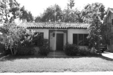
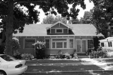
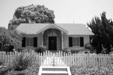
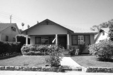
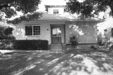
| Suburb | 0.920 | 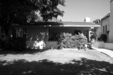 |
 |
 |
 |
 Mountain |
 InsideCity |
 TallBuilding |
 Coast |
| InsideCity | 0.590 |  |
 |
 |
 |
 Kitchen |
 Street |
 Store |
 LivingRoom |
| TallBuilding | 0.830 |  |
 |
 |
 |
 LivingRoom |
 Industrial |
 InsideCity |
 Industrial |
| Street | 0.730 |  |
 |
 |
 |
 InsideCity |
 InsideCity |
 Industrial |
Store |
| Highway | 0.790 |  |
 |
 |
 |
 Suburb |
 Coast |
 OpenCountry |
 Coast |
| OpenCountry | 0.520 |  |
 |
 |
 |
 Mountain |
Highway |
 Coast |
 Coast |
| Coast | 0.750 |  |
 |
 |
 |
 OpenCountry |
 Highway |
 Bedroom |
 OpenCountry |
| Mountain | 0.820 |  |
 |
 |
 |
 Coast |
 Forest |
 Coast |
 OpenCountry |
| Forest | 0.950 |  |
 |
 |
 |
 OpenCountry |
 OpenCountry |
 Mountain |
| Category name | Accuracy | Sample training images | Sample true positives | False positives with true label | False negatives with wrong predicted label | ||||