Project 4 / Scene Recognition with Bag of Words
Tiny Images and Nearest Neighbor
Using tiny images and nearest neighbor gave the worst performance out of all of the methods. For my implementation I used images resized to 16x16 with no respect for original aspect ratio. In this manner, image data is not thrown out from cropping. Nearest neighbor simply uses vl_alldist2() and min() to find the neighbor with the smallest euclidian distance. Using these together, I was able to acheive 19.1% accuracy. Below is the confusion matrix for this part.
Scene classification results visualization
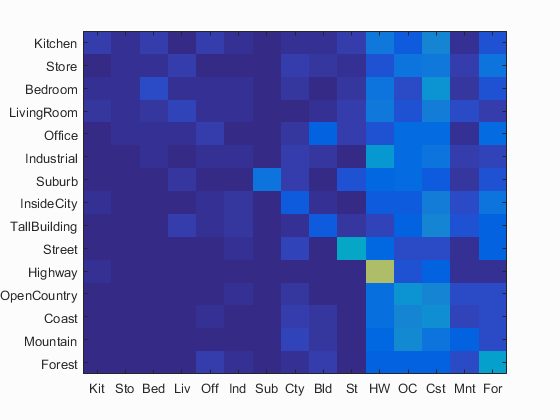
Accuracy (mean of diagonal of confusion matrix) is 0.191
Bag Of SIFT and Nearest Neighbor
Using bag of SIFT and nearest neighbor gave quite a bit better performance over tiny images and nearest neighbor, however it took significantly longer. Whereas tiny images and nearest neighbor only took about 30 seconds, but running bag of SIFT and nearest neighbor took about 8 minutes. I increased the vocabulary size to 500 and used a fairly large bin and step size for the SIFT descriptor. Then when getting the 'bags', I used a fairly small bin and step size. This was able to bring my accuracy up to 50.5%. Below is the confusion matrix for this part.
Scene classification results visualization
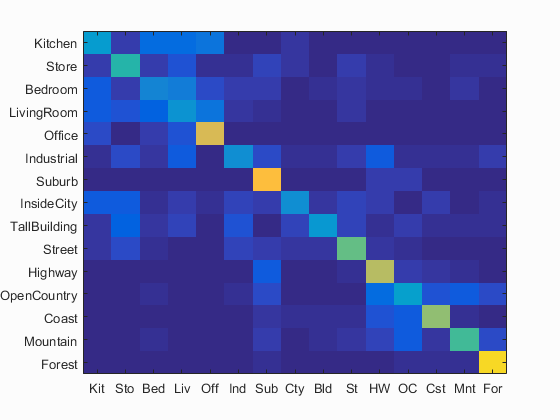
Accuracy (mean of diagonal of confusion matrix) is 0.505
Bag Of SIFT and Linear SVM
Using bag of SIFT and linear SVM increased accuracy even more and took only slightly longer than Bag of SIFT with nearest neighbor. For my linear SVM, I used a lambda of 0.0001 and found that decreasing lambda didn't really provide much better results, and increasing reduced accuracy pretty drastically. Using linear SVM over nearest neighbor, I was able to get the accuracy up to 67.2%. Below is the confusion matrix for this part, as well as some sample classifications.
Scene classification results visualization
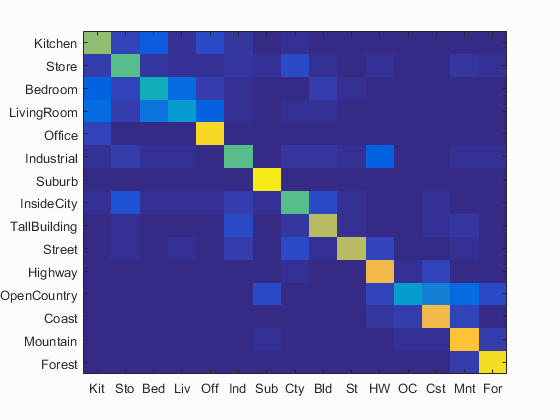
Accuracy (mean of diagonal of confusion matrix) is 0.672
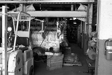
| Category name | Accuracy | Sample training images | Sample true positives | False positives with true label | False negatives with wrong predicted label | ||||
|---|---|---|---|---|---|---|---|---|---|
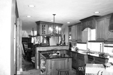
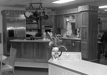
| Kitchen | 0.640 |  |
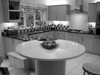 |
 |
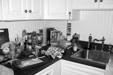 |
 LivingRoom |
 Store |
 Bedroom |
 InsideCity |
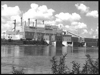
| Store | 0.560 |  |
 |
 |
 |
 Industrial |
 LivingRoom |
 InsideCity |
 TallBuilding |
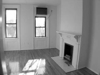
| Bedroom | 0.430 |  |
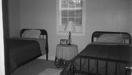 |
 |
 |
 LivingRoom |
 LivingRoom |
 Industrial |
 Store |
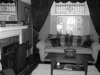
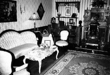
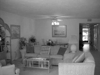
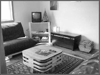
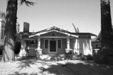
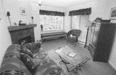
| LivingRoom | 0.340 | 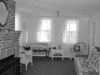 |
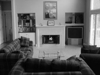 |
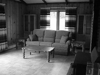 |
 |
 Industrial |
 Bedroom |
 Bedroom |
 Bedroom |
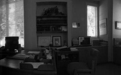
| Office | 0.910 |  |
 |
 |
 |
 Bedroom |
 Kitchen |
 Kitchen |
 Kitchen |
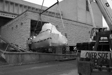
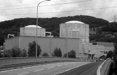
| Industrial | 0.550 |  |
 |
 |
 |
 Street |
 Kitchen |
 Highway |
 Suburb |
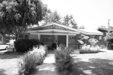
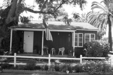
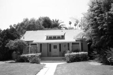
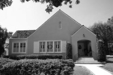
| Suburb | 0.960 |  |
 |
 |
 |
 InsideCity |
 OpenCountry |
 TallBuilding |
 Bedroom |
| InsideCity | 0.550 |  |
 |
 |
 |
 Store |
 Street |
 Highway |
 Suburb |
| TallBuilding | 0.700 |  |
 |
 |
 |
 InsideCity |
Suburb |
 Industrial |
 Industrial |
| Street | 0.700 |  |
 |
 |
 |
 InsideCity |
 LivingRoom |
InsideCity |
 Highway |
| Highway | 0.810 |  |
 |
 |
 |
 Street |
 Industrial |
 Coast |
 Mountain |
| OpenCountry | 0.340 |  |
 |
 |
 |
 Highway |
 Highway |
 Mountain |
 Mountain |
| Coast | 0.810 |  |
 |
 |
 |
 OpenCountry |
 OpenCountry |
 Mountain |
 InsideCity |
| Mountain | 0.850 |  |
 |
 |
 |
 Coast |
 Store |
 Forest |
 Forest |
| Forest | 0.930 |  |
 |
 |
 |
 OpenCountry |
Mountain |
 Mountain |
 Mountain |
| Category name | Accuracy | Sample training images | Sample true positives | False positives with true label | False negatives with wrong predicted label | ||||
From the results above, it looks like this representation and classifier does a pretty good job of separating out scenes that look very different. For example, forest trees were not mistaken for city buildings. However, within a similar category, such as 'interior' (rooms such as the kitchen, bedroom, living room, etc), results were sometimes confused between the two. Out of all of the labels, LivingRoom had the lowest accuracy of 34% and was confused with other interior rooms such as Bedroom and Industrial. OpenCountry also had a low accuracy of 34% and was confused with outdoor scenes such as Highway and Mountain.