Project 5 / Face Detection with a Sliding Window
The aim of the project was to detect faces in a given set of images. I achieved this by implementing the basic pipeline suggested by Dalal and Triggs 2005. There are 3 major sections of the implementation:
- Generating HOG features corresponding to positive and negative examples of faces
- Training a linear SVM classifier on this feature vector
- Dectecting faces in the test image via a sliding a window detector across multiple scales.
Parameter Tuning
The following parameters affected the average precision of the detector and were tuned to optimise accuracy and time:
1. No of scales
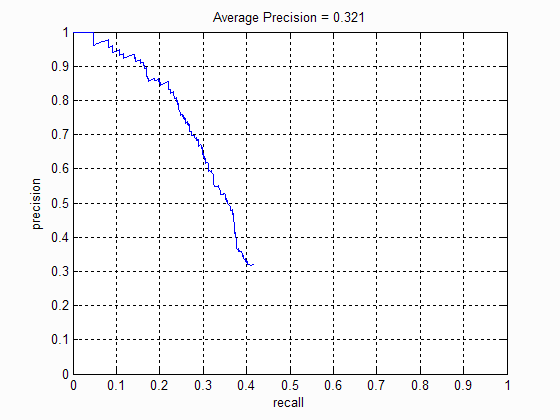
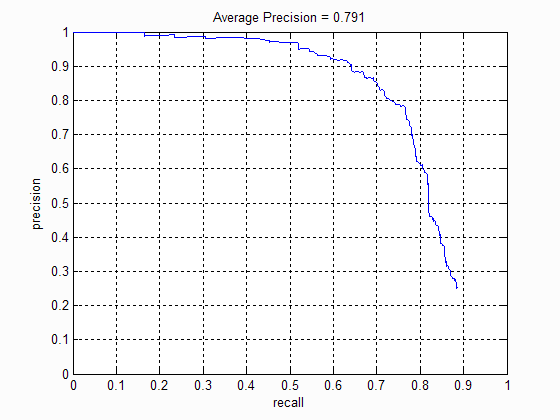
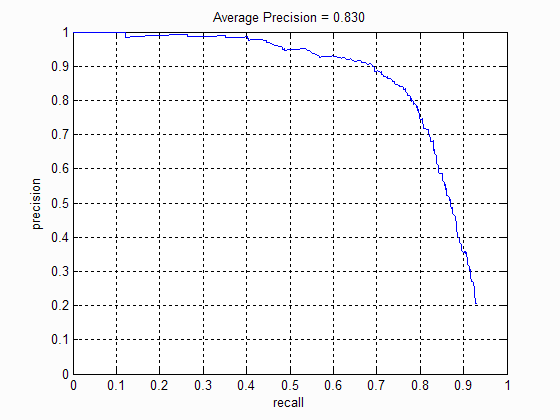
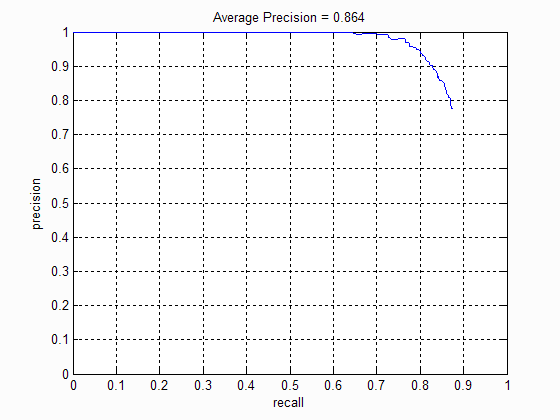
The number of scales at which the bounding boxes were considered directly influenced the average precision of the algorithm . The following table shows the precision-recall curve at different scales:
 |
 |
 |
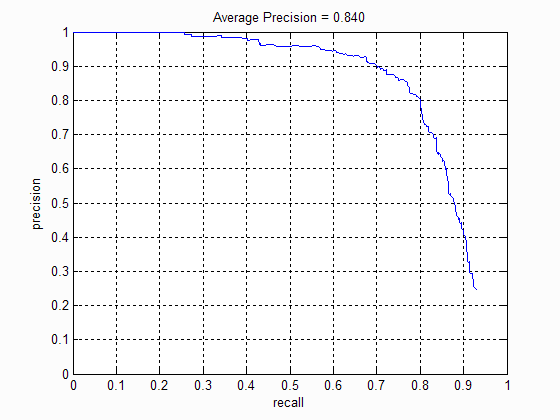 |
| No of scales: 1 | No of scales: 5 | No of scales: 10 | No of scales: 15 |
I noticed that increasing the scale beyond 10 does not improve the precision much. This is because there are very few images with faces at that scale. Moreover it increases the number of false positives detected. I then choose our scale factor to be 0.75.
2. Threshold value
Once the SVM is trained a threshold value needs to be set above which all test windows are considered faces. I observed that increasing the threshold does not drastically affect the average precision of the detector. However a larger threshold does reduce the number of false positives( sometimes at the risk of reducing the number of true positives as well). After some experimentation I set the threshold at 0.3.
 |
 |
| With Threshold at 0.3 | With Threshold at 0.1. I observe a lot more false positives. |
However sometimes setting a high threshold may result in a lower true postive rate, as in the case of Ecuador.png
 |
 |
| With Threshold at 0.3 | With Threshold at 0.1. We observe a greater true positive rate. |
3. Cell size
The number of pixels in each cell of the HoG feature drastically affected the average precision. A lower cellsize indicates a more fine grained description of the feature and hence results in higher precision. However a smaller cellsize also results in more bounding boxes that need to considered and hence takes longer time to evaluate. The following table shows the precision-recall curve for different cellsizes:
 |
 |
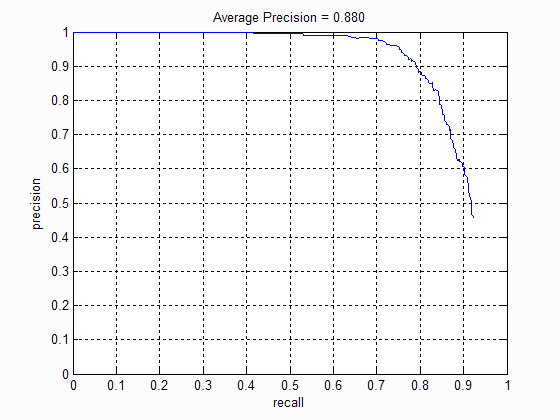 |
| Cell size: 6 | Cell size: 4 | Cell size: 3 |
I set the cellsize to 6 fo faster runtime.
Extra Credit
Hard Negative mining
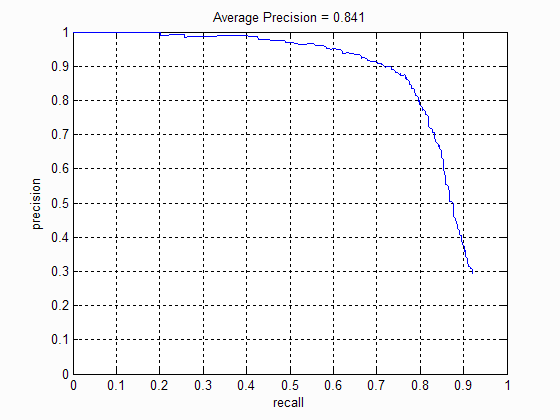
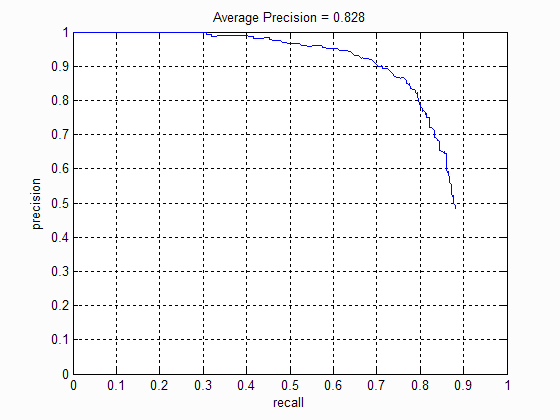
Hard negative mining involves identifying the false postives in the training set and using those images as negative examples to re-train the SVM classifier. After implementing Hard Negative mining, I saw that the average precision increased from 83.0% to 84.1%. It also reduced the number of false postives.
Precision Recall curve for basic pipeline with hard negative mining.
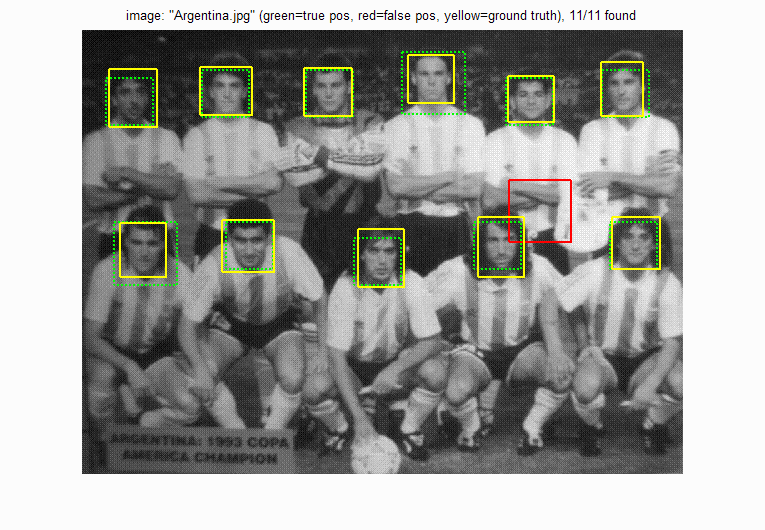
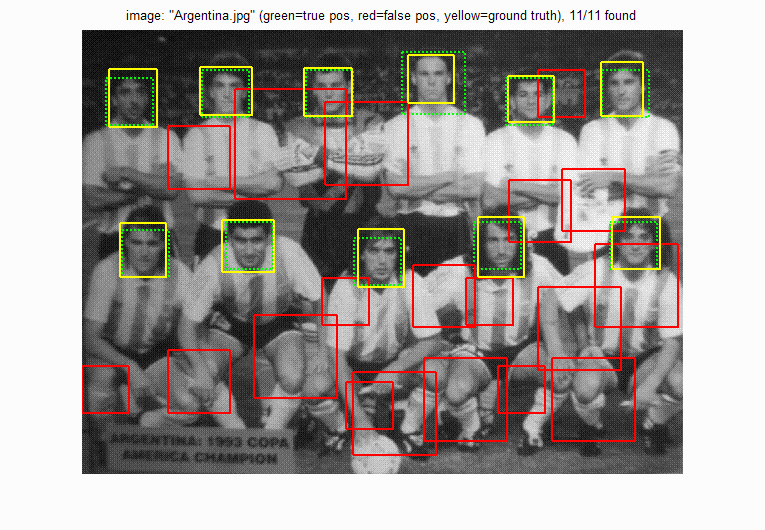
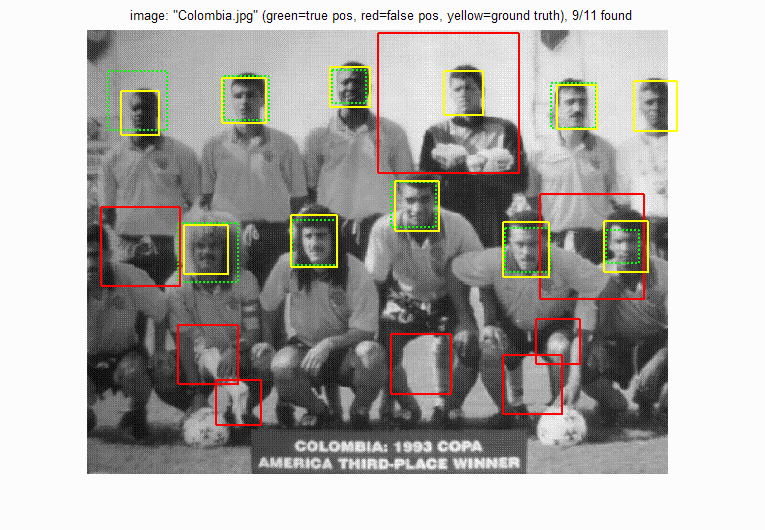
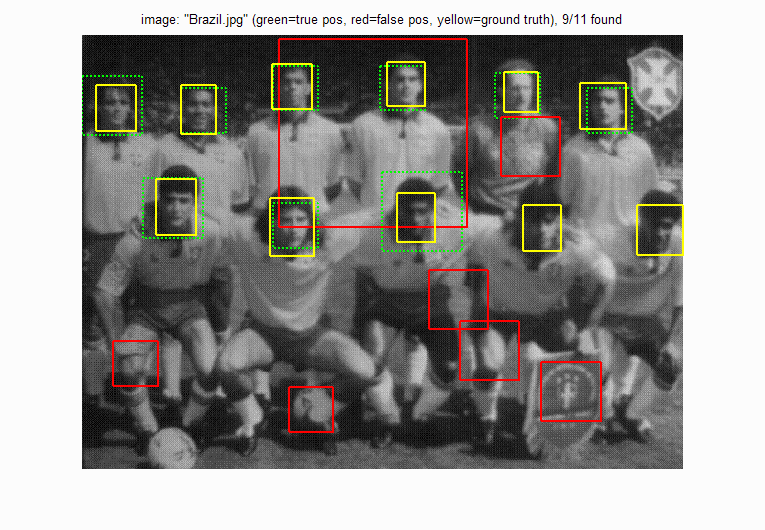
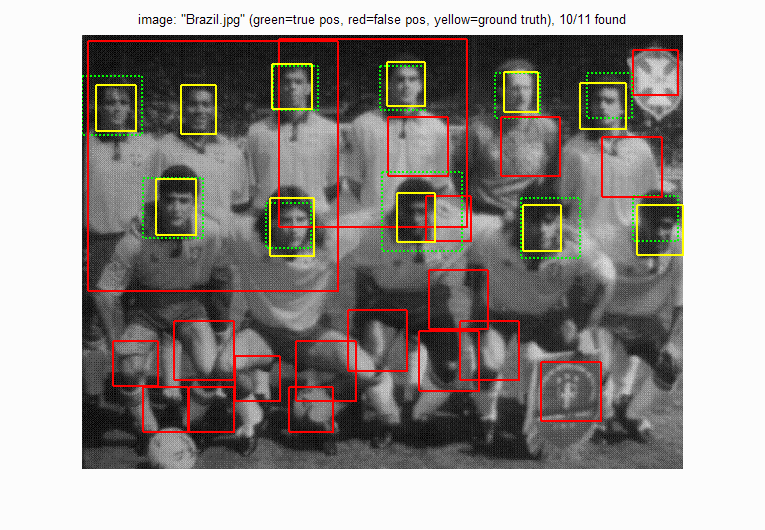
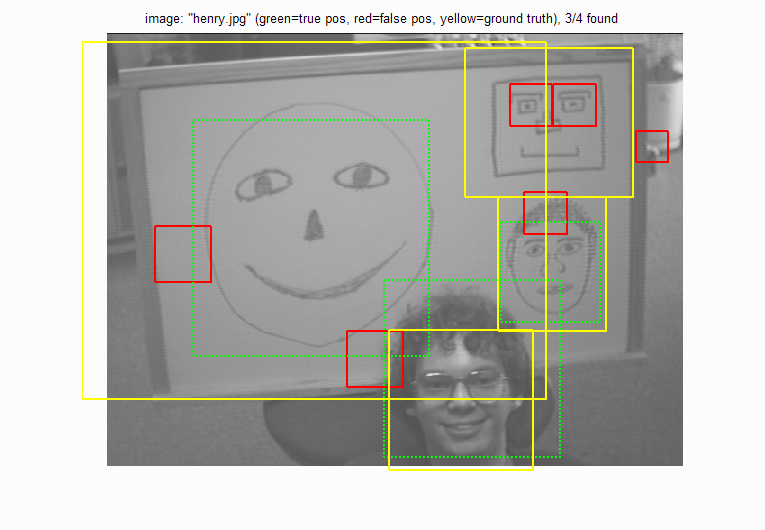
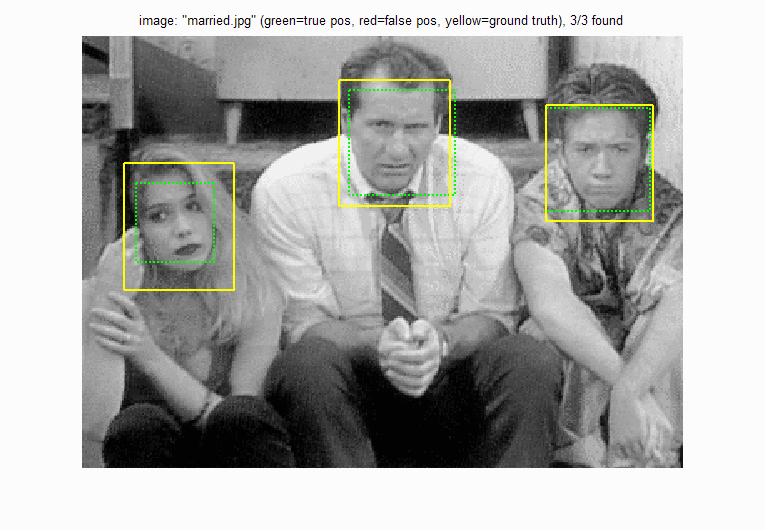
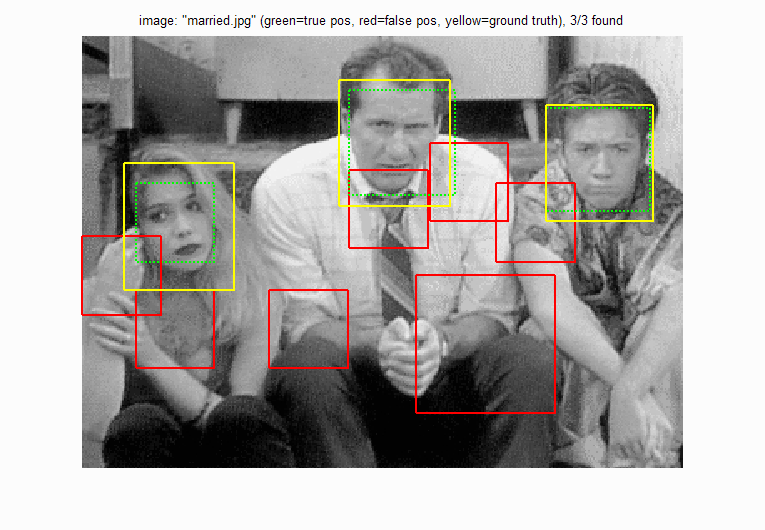
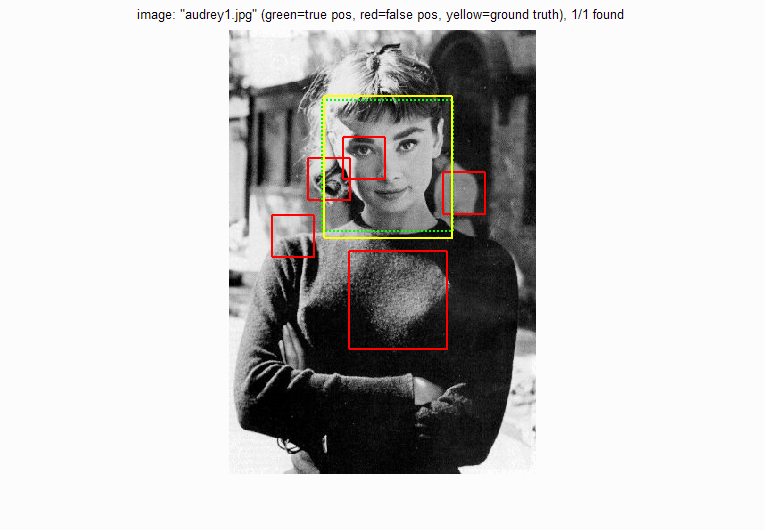
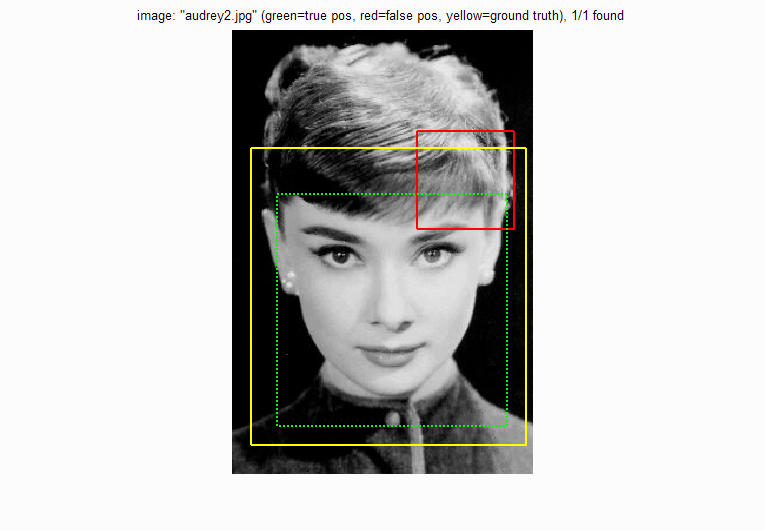
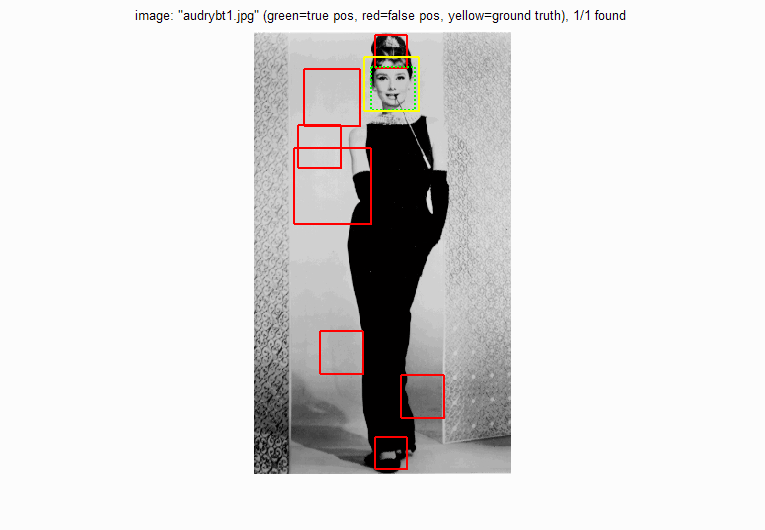
Comparing results of basic pipeline with and without hard negative mining. In each of the examples below I observe the false positives are fewer in the results of hard negative mining.
 |
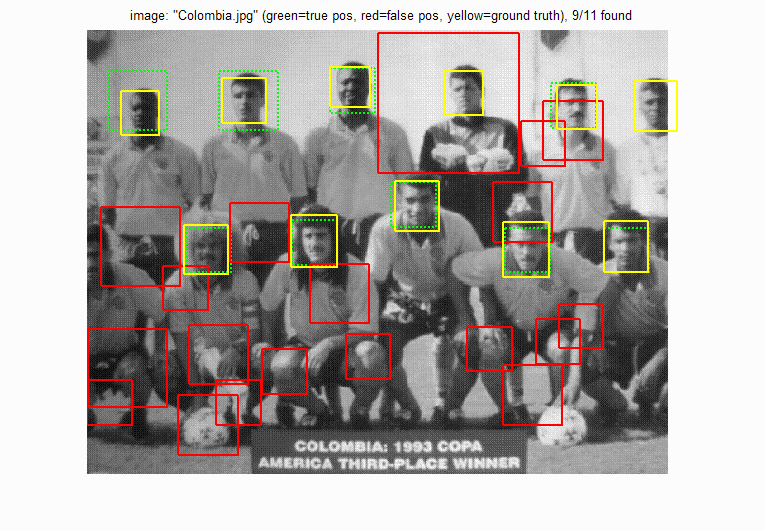 |
| With hard negative mining | Without hard negative mining. Lot more false positives. |
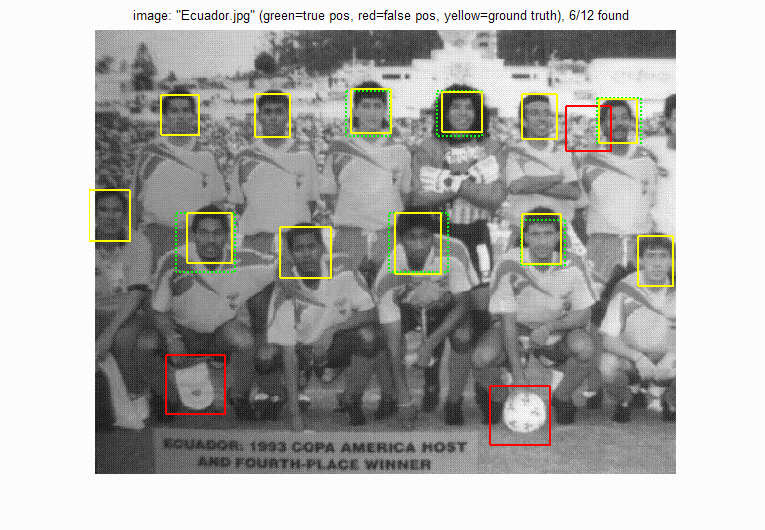
 |
 |
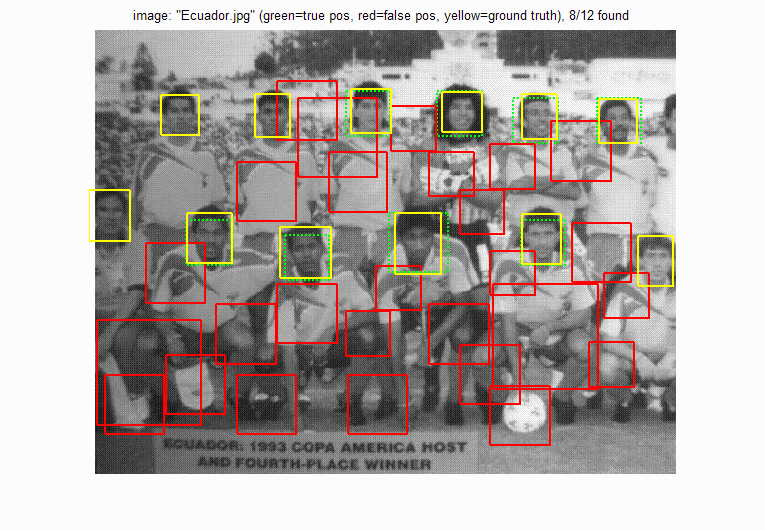
| With hard negative mining | Without hard negative mining. Lot more false positives |
 |
 |
| With hard negative mining | Without hard negative mining. Lot more false positives. |
 |
 |
| With hard negative mining | Without hard negative mining. Lot more false positives. |
Using Knn classifier
In order to reduce the number of false postives, I passed the positve results of the SVM classifier through a 5 nearest neighbour classifier. The following are the results:
Precision Recall curve.
Although the precision has decreased, I observed a drop in the number of false positives
 |
 |
More results
Evaluating the learned classifer. The following graph shows the true postives and true negatives when the SVM classifier is run on the training data itself
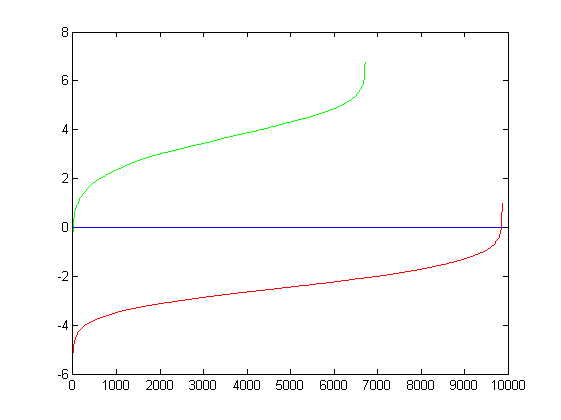 |
| Tp = 0.40 Tn = 0.59 Fp ~ 0 Fn ~ 0 |
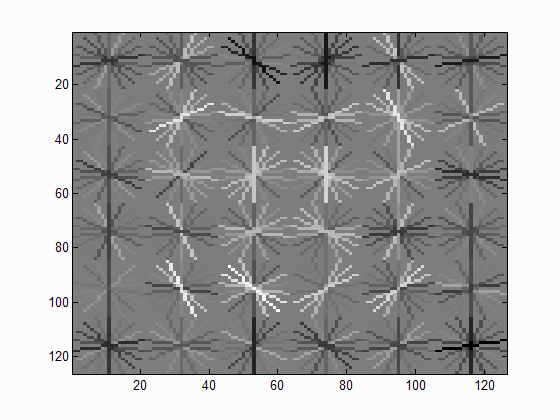
|
| Face template HoG visualization. |
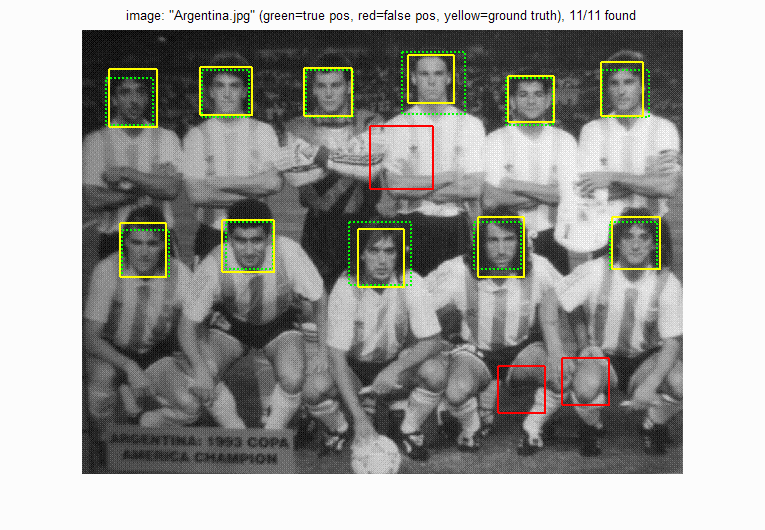
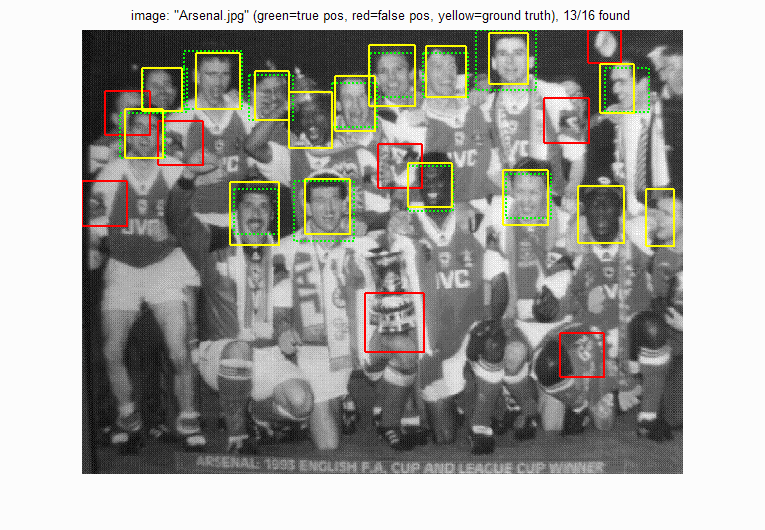
More results with basic pipeline and hard negative mining and a cellsize of 6:
 |
 |
 |
 |
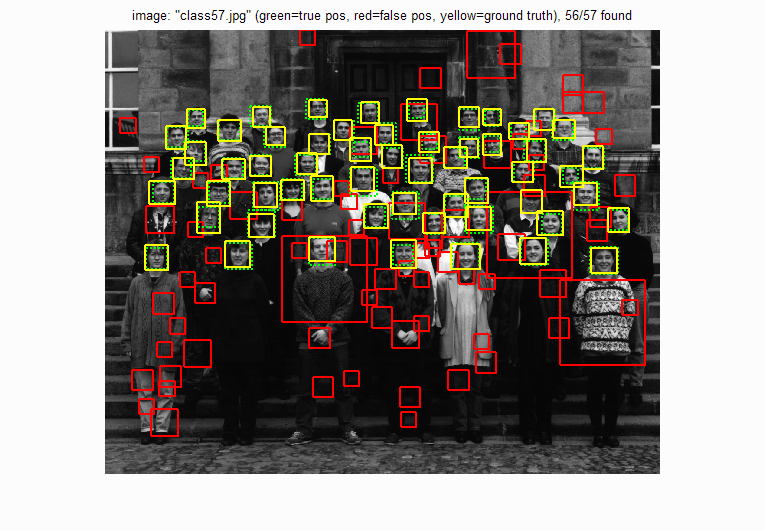 |
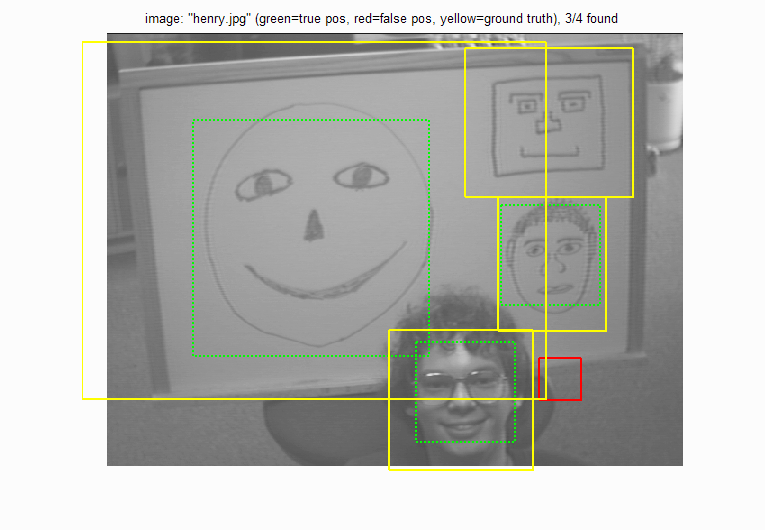
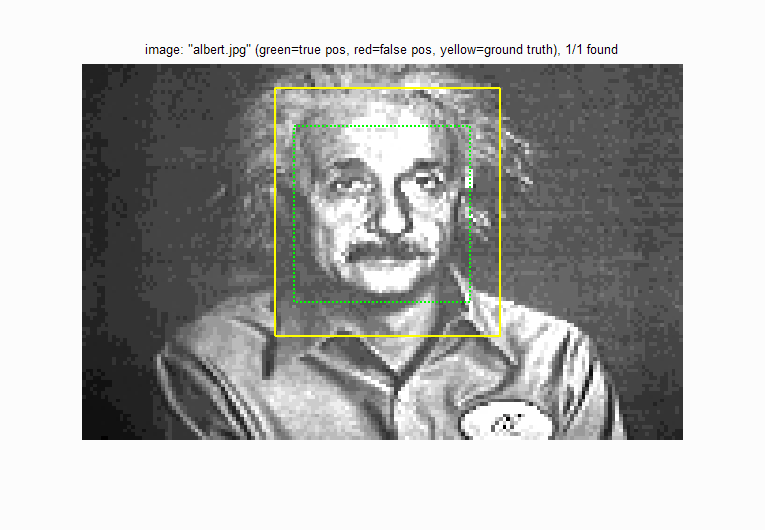
Results on the extra data set: Although I did not have the ground truth for this data set, a visual analysis suggests a high precision.
 |
 |
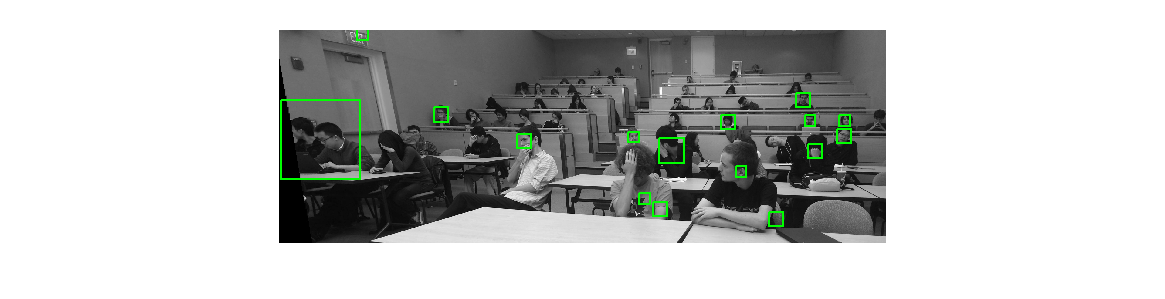 |
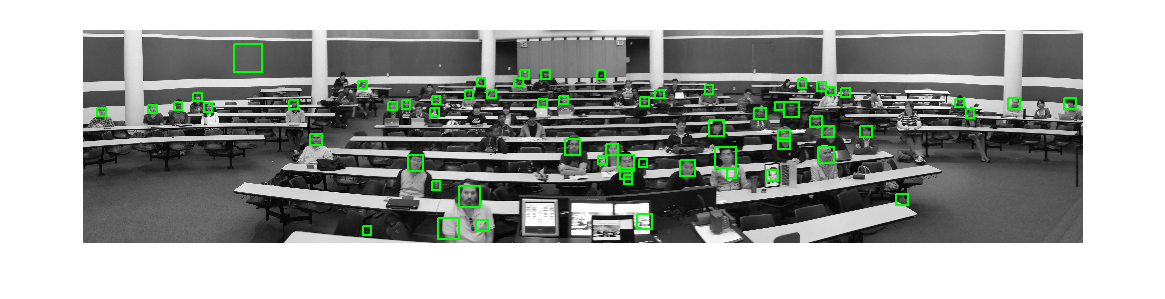 |