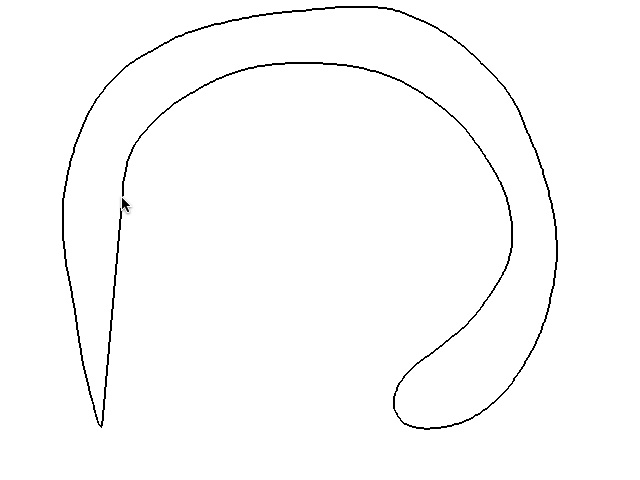
This video shows the eigenvectors of the mesh Laplacian (with cotangent weights) visualized as a scalar function over the mesh vertices. We interpolate (linearly) between successive eigenvectors, giving the illusion of continuity, but in fact there is no general relationship between the values that successive eigenvectors take at a given vertex.
These scalar functions have physical interpretations, for example, if we have a vibrating drum head, these functions correspond to standing wave patterns which would form when this shape is energized. It is common to physically visualize these patterns by placing sand on the drum head, creating a Chladni plate. The sand comes to rest along the nodal lines of the standing wave because this is where the minimum vertical displacement due to vibration occurs.
Our goal with this project was to build an intuition about the number and distribution of local minima and maxima of the induced scalar fields for different eigenvalues, and thus to understand when a Morse-Smale decomposition of the scalar field would provide a desirable quadrangulation of the shape.
The code to produce this video was written in Java using the JAMA matrix library to perform the eigendecomposition. Meshing the shape is accomplished as the Delaunay triangulation of points that are first randomly distributed inside the shape and then relaxed into a more regular configuration with Lloyd's method (repeatedly move each vertex to the center of its Voronoi neighborhood).