
![]()
Dust & Magnet
Team Members:
Andew Dai, Ji Soo Yi, Rachel Melton Ponder, Julie Jacko
John Stasko
 |
|
Dust & Magnet is an information visualization technique and system to help people better understand relatively large, multivariate data sets. The technique is especially designed for use by people who struggle with interpreting the complex data of everyday problems and who are not experts in information visualization and are not familiar with existing multivariate visualizaiton techniques.
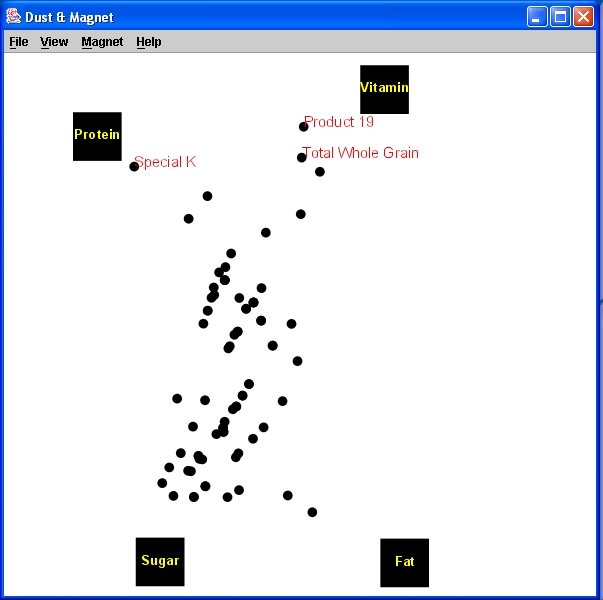
The system uses a magnet metaphor in which the individual data cases are represented as particles of iron dust, and magnets represent the different variables of the data set. Users interactively manipulate the magnets and then the dust moves appropriately thus exposing characteristics of the data set. The basic idea of DnM is fairly simple. When a magnet is dragged, dust particles are attracted to the magnet based on the value of the attribute corresponding to the magnet. For example, if the magnet represents vitamins, a piece of dust with a higher value for vitamins attracts more than a piece of dust with a lower value for vitamins. Additionally, if multiple Magnets are placed on the main screen, all Magnets on the screen affect the movement of Dust particles simultaneously even though the user drags only one Magnet.
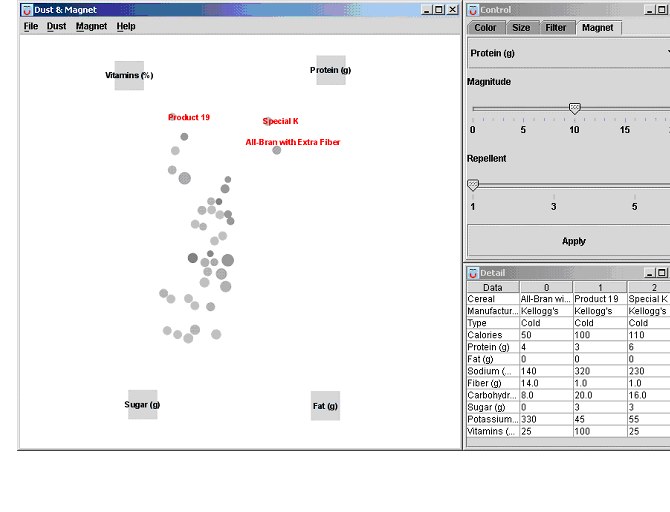
The figures below show screen shots of the Dust & Magnet system, running on a cereal data set. The left window is the main view on which the primary interaction occurs. The rectangles with black descriptions are Magnets, and the grey circles are Dust. Each Dust particle represents a data point, and each Magnet corresponds to an attribute (or dimension) of the data set. The right top window in the figure is the control window that contains various options to adjust, such as the color and size of dust, filters, and the magnitude of attraction of magnets. The right bottom window in the figure is the detail window that shows information about selected dust particles.
More recently, we implemented Dust & Magnet on a large multitouch display that provides collaboration opportunities. This version allows analysts to be "hands on" and use multitouch gestures to control the system.
Full view from Dust & Magnet interface (click to enlarge).

Use of color to indicate categories (click to enlarge).