
![]()
Active Projects
 |
Natural Visualization Creating natural data visualization and analysis systems incorporating multiple interaction modalities including speech and touch. |
|
 |
Data Illustrator
and Data Animator Creating rich, expressive infographics and visualizations and animations without needing to program. |
|
 |
Jigsaw Using visualization and visual analytics to help analysis and sensemaking on document collections. |
|
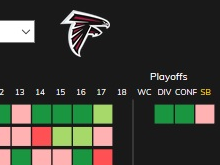 |
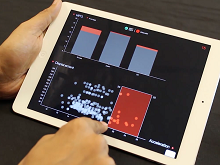
Sports Data Visualization Visualizing sports data to help people understand, analyze, and predict sporting events. |
|
 |
ICE-T Value-Driven
Visualization Evaluation Evaluating visualizations through heuristic, value-focused metrics. |
|
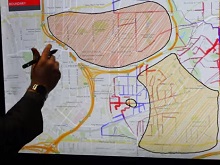 |
Civic Geovisualization Mapping and visualizing urban data from multiple stakeholders to promote civic discourse. |
|
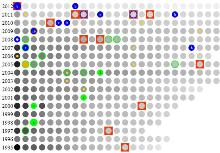 |
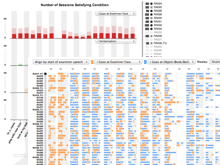
CiteVis Exploring conference paper citation data visually. |
|
 |
Touch Interaction Developing interaction techniques for visualization on touch-based tablet and mobile devices. |
|
 |
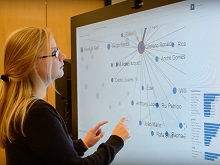
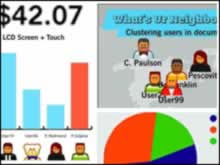
Social Media Visual Analytics Helping people analyze and understand social media through interactive visualization and other techniques. |
|
 |
Graph-Level Operations Identifying the building blocks of graph visualization. |
|
 |
Rosemary Building novel interactive visualizations without programming. |
|
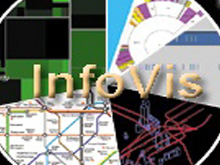 |
Information Visualization
and Visual Analytics Helping people explore, analyze, and understand data through interactive visualization techniques and systems. |
|
| Prior Projects | ||
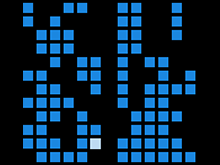 |
SetVis Exploring boolean set data through visualization and direct manipulation. |
|
 |
Behavis Using visual analytics to help psychologists explore social and communicative behaviors. |
|
 |
Visual Analytics for
Intelligence Analysis Informing the design of visual analytics systems for intelligence analysis. |
|
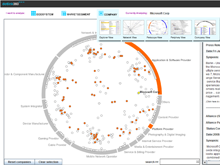 |
dotlink360 Analyzing and exploring converging business ecosystems through visual analytics. |
|
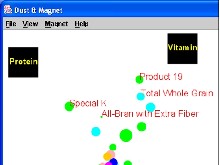 |
Dust & Magnet Assisting people understand multivariate data sets using a magnet metaphor-based visualization. |
|
 |
Ploceus Supporting flexible network modeling for visual analysis of spreadsheets and databases. |
|
 |
Imprint Empowering workers to use visualizations of printer data as a basis for conversation and reflection. |
|
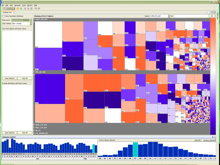 |
SellTrend Enabling real-time awareness and exploratory analysis of temporal, categorical event transactions. |
|
 |
InfoCanvas Developing Information Art: Virtual paintings that peripherally convey information to people |
|
 |
The Buzz Supporting end-user mashup creation and content aggregation onto photo and text collages. |
|
 |
M5 Making multiple monitors more manageable and exploring how window management techniques can improve the use of multiple monitor systems. |
|
 |
Talking Heads Exploring the use of embodied interface agents who assist people with daily tasks. |
|
 |
FundExplorer Aiding equity investors with mutual fund portfolio diversification through the use of Context Treemaps. |
|
 |
SunBurst Developing circular, space-filling visualizations for depicting information hierarchies and trees. |
|
 |
Software Visualization Helping people understand software through visualization of programs, data structures, algorithms, and executions. |
|
 |
AuraOrbs Communicating presence and awareness data through an ambient information system. |
|
 |
BlueGoo Combining information and aesthetics in a peripheral awareness system. |
|
 |
Ambient Trolley Communicating trolley travel times in an ambient toy display.. |
|
 |
iShop Exploring how PDAs could be used in shopping at grocery stores and other retail environments. |
|
 |
What's Happening? Enhancing the sense of community in a geographically separated organization via software applications. |
|
 |
Information Mural Providing better techniques for rendering large data sets in small interface windows. |
|
 |
NetVizor Visualizing network topologies to assist network designers and analysts. |
|