This project involves a set of animation views that we have
developed for illustrating the execution of parallel programs
in cluster environments such as PVM (Parallel Virtual Machine) and
the Conch Network Computing System. The animations depict the
the message passing properties of parallel applications that run
in the above concurrent environments. We are in the process of providing
a comprehensive system that provides animation and performance visualization
support for PVM. The focus of the system will be providing a palatable
framework for PVM users to create application specific animations
and performance visualization.
Included below are some sample preliminary views from the library that we have
created for the Conch system.
 The visualization program is implemented using
the POLKA Animation Designer's Package.
The visualization program is implemented using
the POLKA Animation Designer's Package.
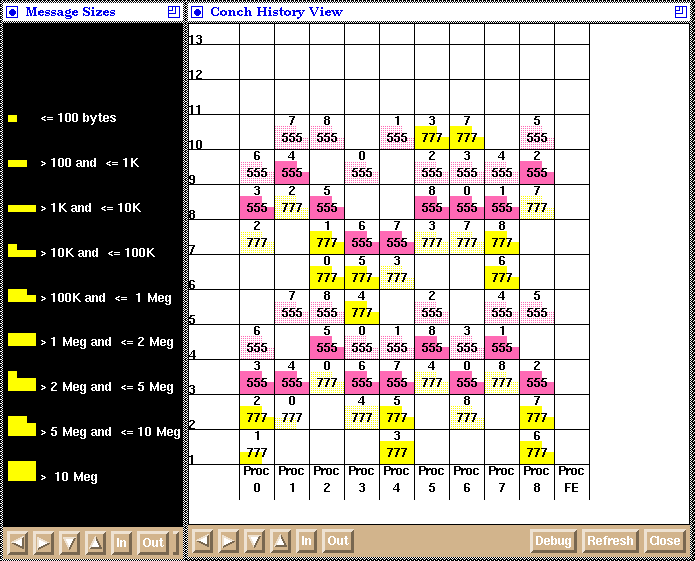
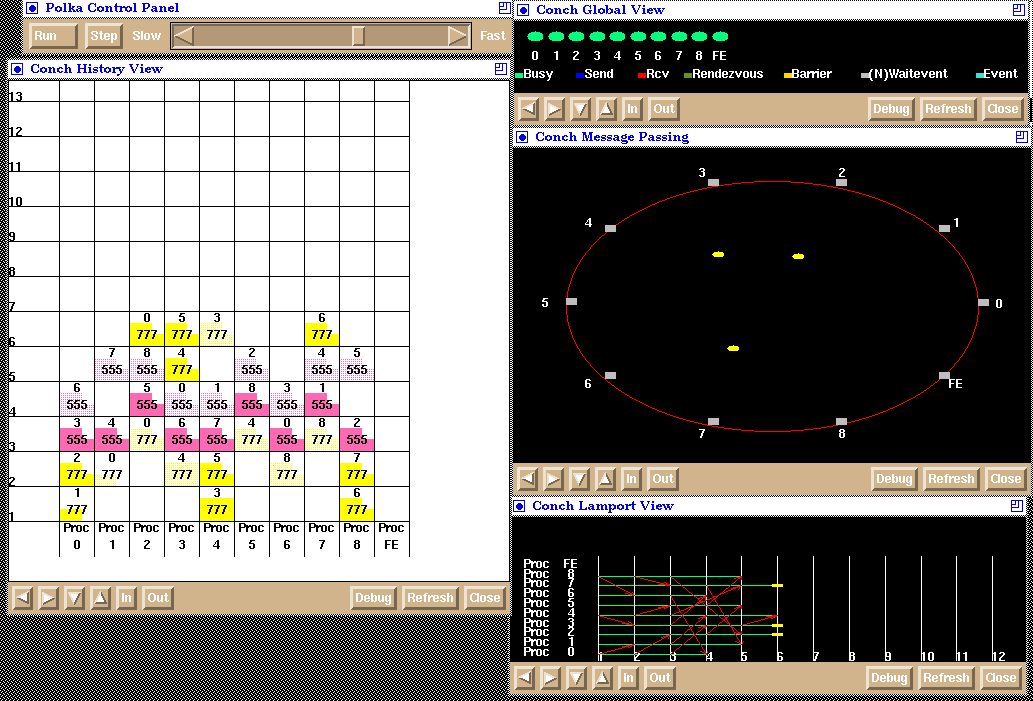
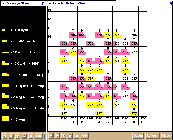 The Conch History view is a
scrolling view that maintains a history of messages
that have been sent or received. The Y-axis of this view is labeled with
Lamport clock values with time proceeding from bottom to top.
The X-axis is labeled with process identifiers.
Squares that are associated with message
sends are filled in with dark colors. Lighter colors of the same hue
fill squares that are
associated with the corresponding message receives.
Message size is encoded by filling squares
with various amounts of color. This can be deciphered by using the
message size view, shown to the left of the history view. Referring
back to the history view, the message type is placed in
the lower center
of each square. The number in the top center of each square can represent
two different items of information. If the square represents a
message send, then this number denotes the process identifier to whom the
message is sent.
In squares associated with message receives, this number depicts
the process identifier from which the message was received.
The Conch History view is a
scrolling view that maintains a history of messages
that have been sent or received. The Y-axis of this view is labeled with
Lamport clock values with time proceeding from bottom to top.
The X-axis is labeled with process identifiers.
Squares that are associated with message
sends are filled in with dark colors. Lighter colors of the same hue
fill squares that are
associated with the corresponding message receives.
Message size is encoded by filling squares
with various amounts of color. This can be deciphered by using the
message size view, shown to the left of the history view. Referring
back to the history view, the message type is placed in
the lower center
of each square. The number in the top center of each square can represent
two different items of information. If the square represents a
message send, then this number denotes the process identifier to whom the
message is sent.
In squares associated with message receives, this number depicts
the process identifier from which the message was received.
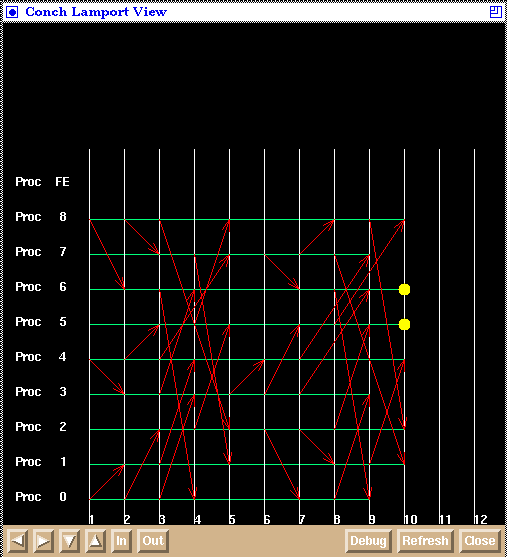
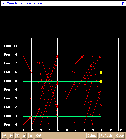 This view is a snapshot of our Conch Lamport view.
It is a more complex version of a Feynman diagram.
In this view, the Y-axis
is labeled with process identifiers and the X-axis is labeled with Lamport
clock values. When a message is sent, a circle appears at the
appropriate logical time coordinate. Similar to the message passing view,
varying circle radii are used to denote message size and the color of the
circle is the same as that used in the history view. When a message is
delivered, an arrow "grows" from the coordinate of where the message
was sent to the correct Lamport delivery time on the receiver's timeline.
Simultaneously, the circle representing the message moves along this path
and then disappears. This view is similar to the history view in the
information it provides, but is very useful when trying
to distinguish communication patterns.
This view is a snapshot of our Conch Lamport view.
It is a more complex version of a Feynman diagram.
In this view, the Y-axis
is labeled with process identifiers and the X-axis is labeled with Lamport
clock values. When a message is sent, a circle appears at the
appropriate logical time coordinate. Similar to the message passing view,
varying circle radii are used to denote message size and the color of the
circle is the same as that used in the history view. When a message is
delivered, an arrow "grows" from the coordinate of where the message
was sent to the correct Lamport delivery time on the receiver's timeline.
Simultaneously, the circle representing the message moves along this path
and then disappears. This view is similar to the history view in the
information it provides, but is very useful when trying
to distinguish communication patterns.
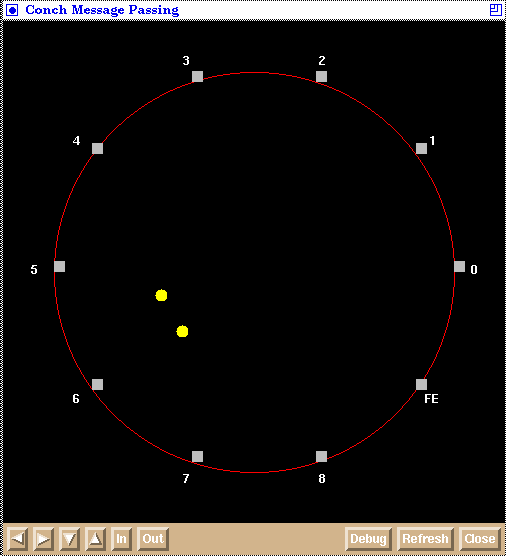
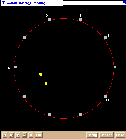 In the Conch message passing view,
all the processes are laid out around the outside circle. Messages
are represented as circles that smoothly move into the center of
the ring of processes
when sent. When a process receives a message, the message moves from its
position in the center of the ring to the process. The color of the message
is the same color as used in the history view.
Further,
the radius of the circles representing messages is proportional
to message size. Messages that are never delivered conspicuously remain
in the center. Also, the smooth animation of message traffic helps portray
actions such as message broadcasts.
In the Conch message passing view,
all the processes are laid out around the outside circle. Messages
are represented as circles that smoothly move into the center of
the ring of processes
when sent. When a process receives a message, the message moves from its
position in the center of the ring to the process. The color of the message
is the same color as used in the history view.
Further,
the radius of the circles representing messages is proportional
to message size. Messages that are never delivered conspicuously remain
in the center. Also, the smooth animation of message traffic helps portray
actions such as message broadcasts.
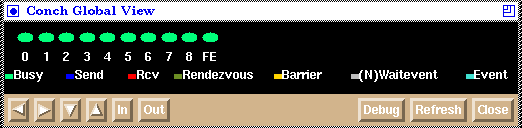
 In the Conch global view, each process has an associated
oval whose color changes as the status of the process changes.
A color code is used to distinguish the various states that a process
is in during system execution.
In the Conch global view, each process has an associated
oval whose color changes as the status of the process changes.
A color code is used to distinguish the various states that a process
is in during system execution.
Questions or comments? Email
gvu-webmaster@cc.gatech.edu.
|

 The visualization program is implemented using
the POLKA Animation Designer's Package.
The visualization program is implemented using
the POLKA Animation Designer's Package.