Cricket is one of the most popular sports in the world with an estimated fan following of 2.5 billion people. There are primarily three types of international cricket matches-- test matches, one day internationals, and Twenty20. Among these, one day internationals (ODIs) are the most commonly played type of matches in international tournments including the ICC Cricket World Cup and the ICC Champions Trophy. Matches are played between two teams each consisting of 11 players.
Each ODI match consists of two innings requiring both teams to bat and field once. Each inning is composed of 50 overs and each over composes of six deliveries bowled by the one player from the fielding team. The goal of the batting team is to score as many runs as possible and avoiding their player's being dismissed by the fielding team while doing so. At the end of the match, the team with a higher score wins. Detailed rules of the game can be found here.
For each delivery, the data generated consists of the bowler name, batsman name, extras and extra type, runs scored, ball speed, the landing position of the ball on the pitch, the position where the ball reaches the batsman, the location where the ball lands on the ground after it is hit, and if a batsman was dismissed, the method of dismissal (e.g., bowled, caught, run out, etc.) With around 600 deliveries played in each ODI match and so many attributes associated with a single delivery, analyzing such matches can be a challenging task.
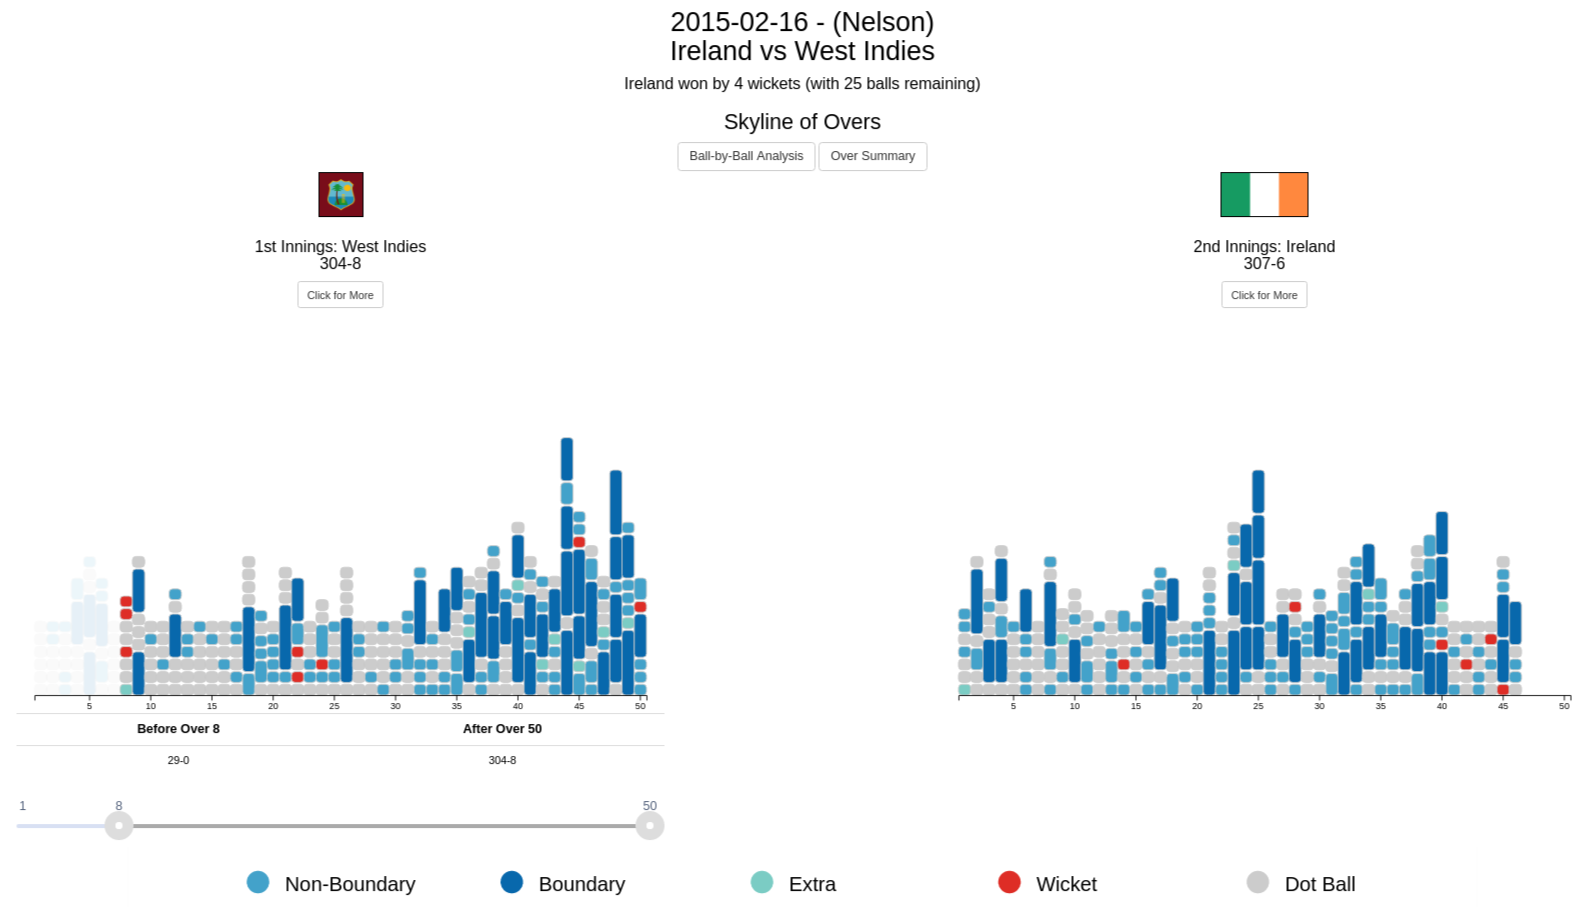
CricVis is a visualization tool that lets users interactively explore all ODI matches from the 2015 ICC World Cup. The skyline views at the top of the page summarize each inning of the match. Each rounded rectangle represents one delivery and the fill colors represent the key event associated with the delivery (runs, extras, wickets, and dot balls).
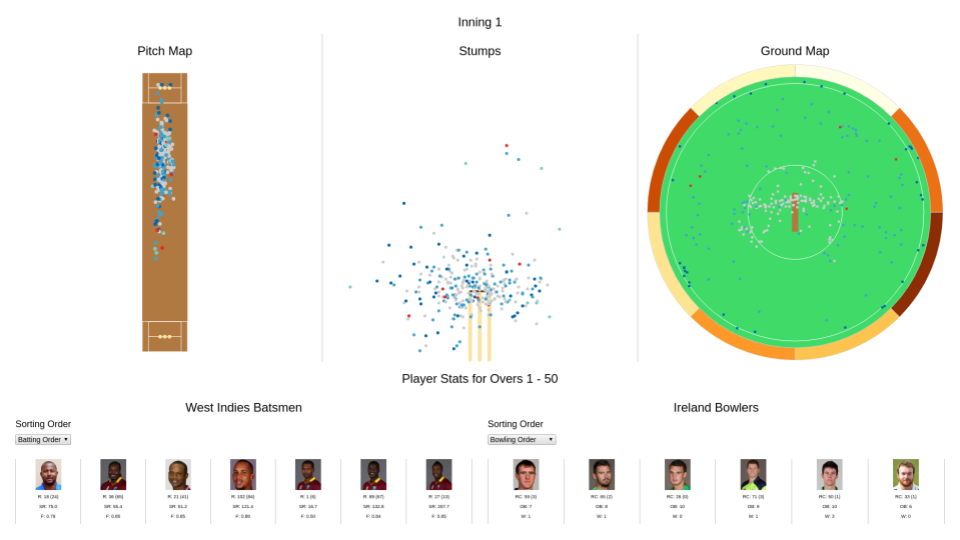
Users can select an innings using the "Click for More" button resulting in inning-specific views that show, for each delivery, ball landing positions (pitch map), positions where the balls reached the batsman (stump map), and where the ball was hit (ground map). The rings along the circumference of the ground indicate scoring zones and the color indicates how many runs were scored in a zone (darker the color, more the runs scored). Individual players and their match statistics are displayed at the bottom of the screen.
All views are interactively linked to each other. Users can apply filters for over ranges, specific players, balls that were hit in a specific zone, and much more. Hovering on or filtering data in one of views updates all the views to reflect the selections. Try CricVis today and interactively explore the 49 ODI matches played as part of the 2015 ICC World Cup.