Actual Country/State
Notes:
- Given the complexity of graphing 80 different countries, we are planning on
generating graphs for each major geographical area, e.g. Europe, US, Canada.
This will be done by the end of July or so.
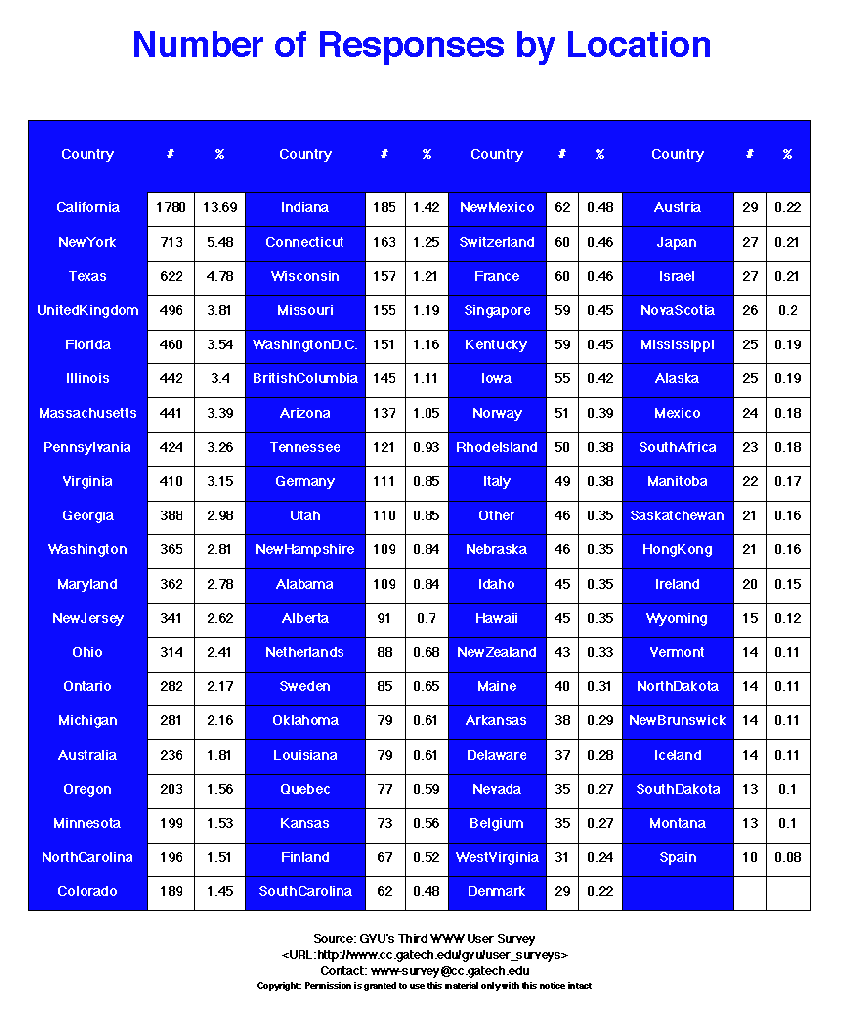
- In the mean time, the table below looks at all countries/states weighted equally.
From this we see that 13.7% of the respondents came from California, followed by New York
(5.5%), Texas (4.8%) and the United Kingdom (3.8%).
- These proportions are quite different from the last survey (See:
Graph),
with about the same rate of response from California, but increased response rates from
New York & Texas.

For more information or to submit comments:
send e-mail to www-survey@cc.gatech.edu.
GVU's WWW Surveying Team
Graphics, Visualization, & Usability Center
College of Computing
Georgia Institute of Technology
Atlanta, GA 30332-0280

