Number of Hours Browser Used Per Week
Notes:
- Exactly 50% of overall users report using their browser between 2 and 6
hours per week. Only 4.75% report using it for less time, while 45.26% report
using it for more.
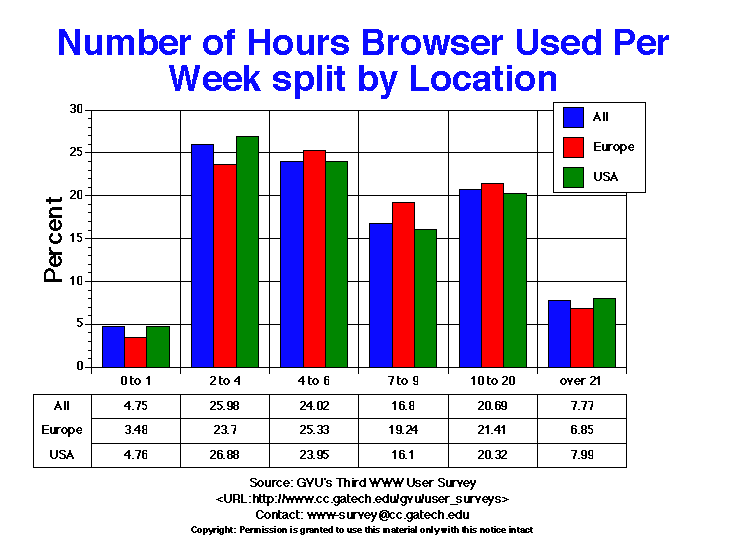
- Users in Europe spend slightly more time using their browsers than user in the US. The curve for Europe peaks at 4 to 6 hours (25.33%) while the curve
for the US peaks at 2 to 4 hours (26.88%).
By Location

Notes:
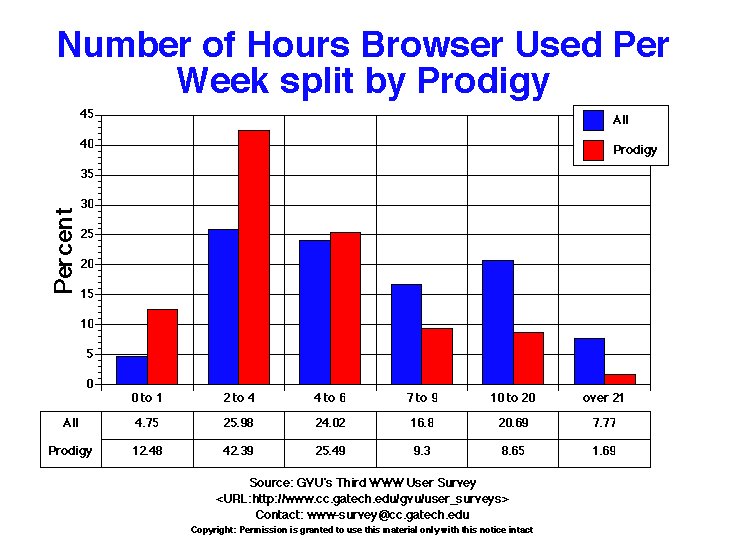
- Users from Prodigy spend less time per week using their browsers than
overall users: 80.36% spend less than 6 hours per week compared to 54.75%.
for overall users.
By Prodigy

Notes:
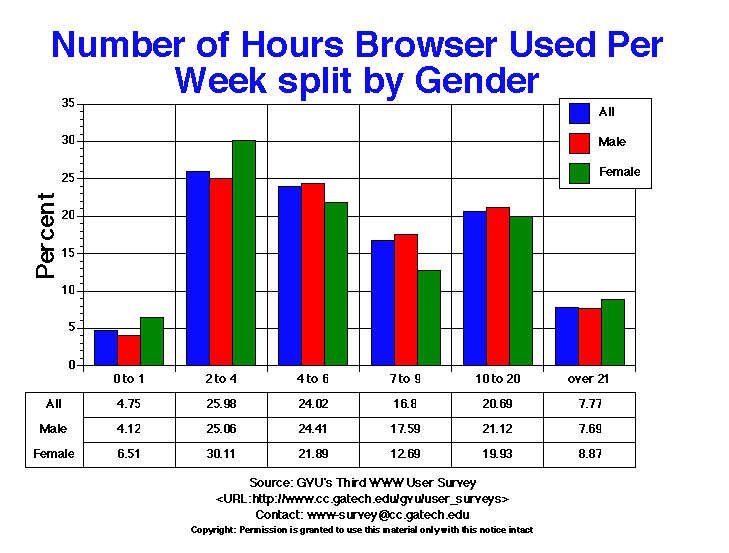
- When compared to males, more females are found in the extremes of the
range of values. 7.44% more females spend 0 to 4 hours using their browsers,
but 1.18% more spend over 21 hours.
By Gender

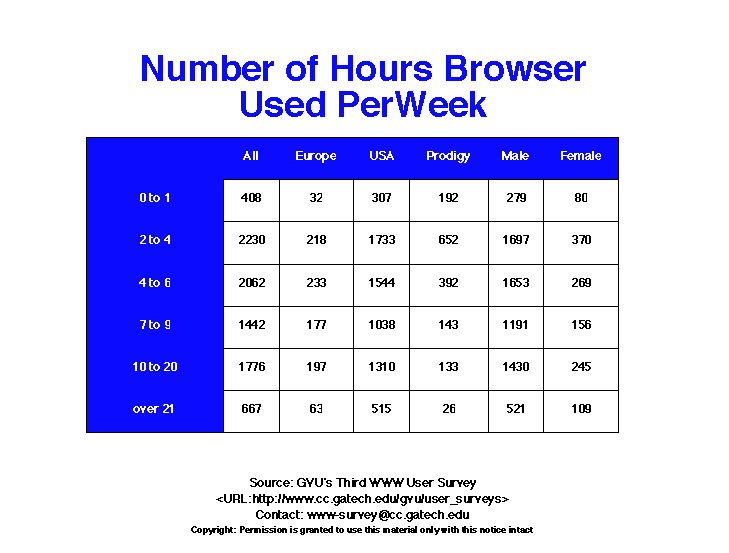
Table of Data for All Categories

For more information or to submit comments:
send e-mail to www-survey@cc.gatech.edu.
GVU's WWW Surveying Team
Graphics, Visualization, & Usability Center
College of Computing
Georgia Institute of Technology
Atlanta, GA 30332-0280

