
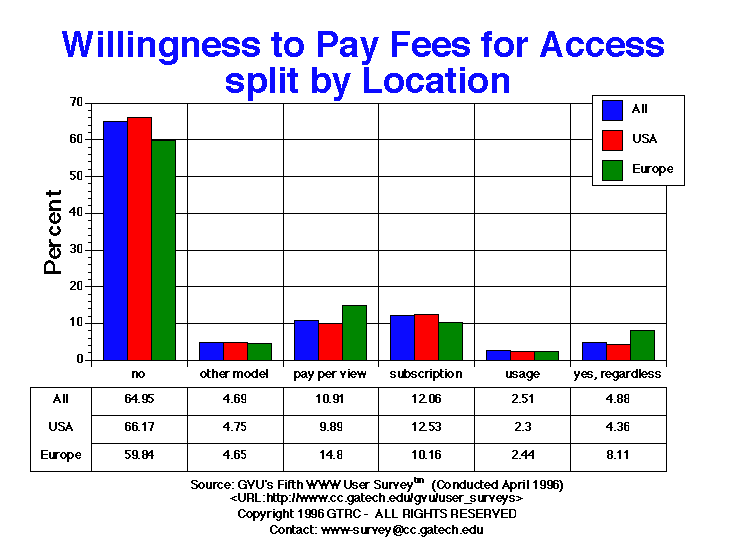
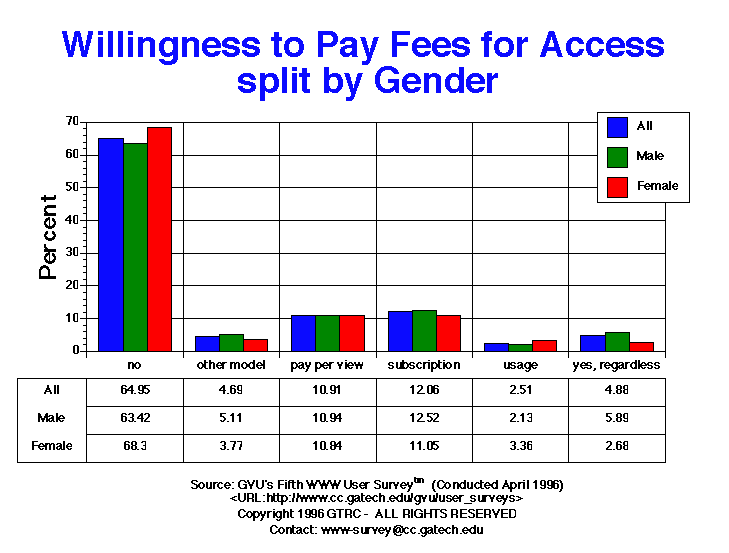
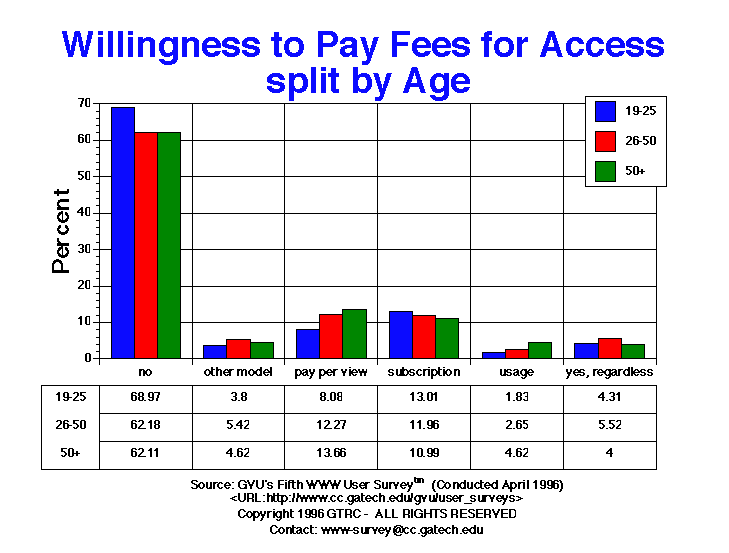
| pay.fees | All | Male | Female | USA | Europe | 19-25 | 26-50 | 50+ |
| pay_fees_no | 7623 64.95% |
5102 63.42% |
2521 68.30% |
5697 66.17% |
760 59.84% |
1887 68.97% |
4322 62.18% |
605 62.11% |
| pay_fees_other | 550 4.69% |
411 5.11% |
139 3.77% |
409 4.75% |
59 4.65% |
104 3.80% |
377 5.42% |
45 4.62% |
| pay_fees_ppv | 1280 10.91% |
880 10.94% |
400 10.84% |
851 9.89% |
188 14.80% |
221 8.08% |
853 12.27% |
133 13.66% |
| pay_fees_sub | 1415 12.06% |
1007 12.52% |
408 11.05% |
1079 12.53% |
129 10.16% |
356 13.01% |
831 11.96% |
107 10.99% |
| pay_fees_time | 295 2.51% |
171 2.13% |
124 3.36% |
198 2.30% |
31 2.44% |
50 1.83% |
184 2.65% |
45 4.62% |
| pay_fees_yes | 573 4.88% |
474 5.89% |
99 2.68% |
375 4.36% |
103 8.11% |
118 4.31% |
384 5.52% |
39 4.00% |
GVU's WWW Surveying Team
Graphics, Visualization, & Usability Center
College of Computing
Georgia Institute of Technology
Atlanta, GA 30332-0280