
| Frequently Visited Political Web Sites | All | Male | Female | USA | Europe | 19-25 | 26-50 | 50+ |
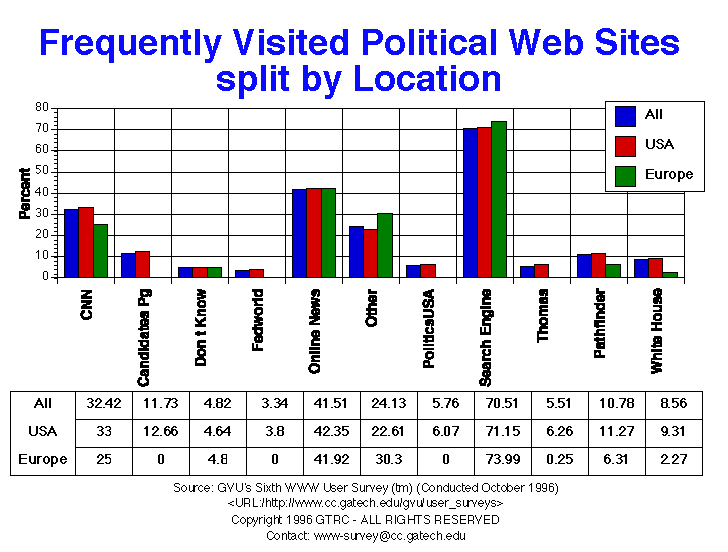
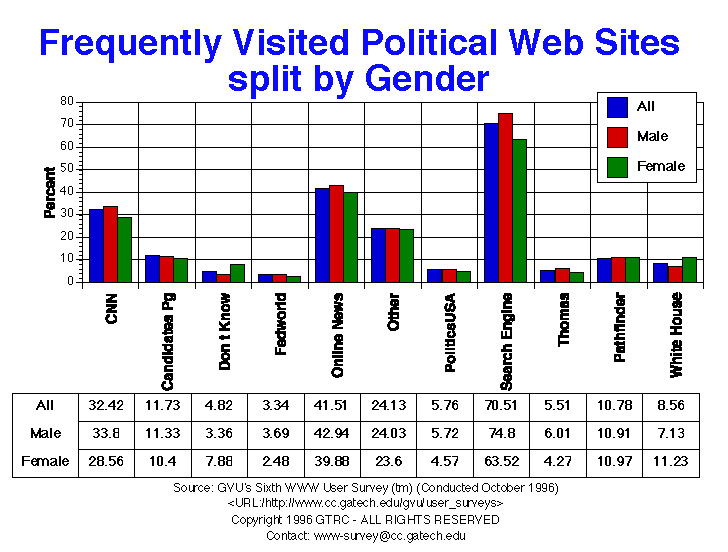
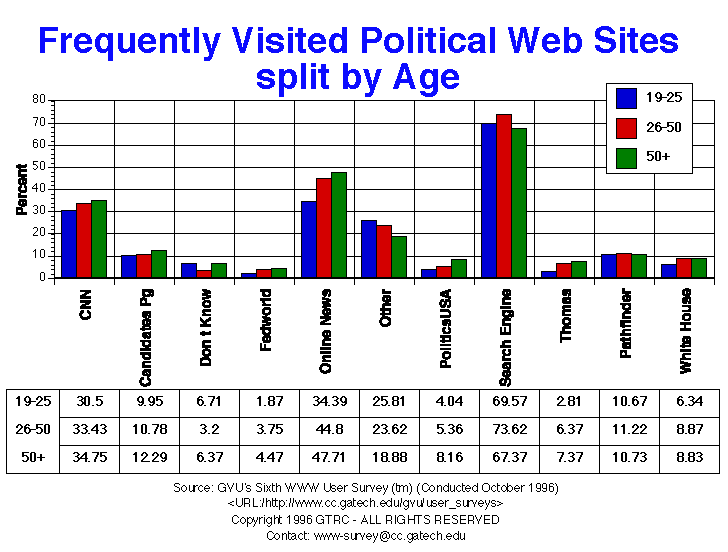
| CNN | 2601.00 32.42% |
1760.00 33.80% |
656.00 28.56% |
2119.00 33.00% |
99.00 25.00% |
423.00 30.50% |
1523.00 33.43% |
311.00 34.75% |
| Candidate s home page | 941.00 11.73% |
590.00 11.33% |
239.00 10.40% |
813.00 12.66% |
0.00 0.00% |
138.00 9.95% |
491.00 10.78% |
110.00 12.29% |
| Don t Know | 387.00 4.82% |
175.00 3.36% |
181.00 7.88% |
298.00 4.64% |
19.00 4.80% |
93.00 6.71% |
146.00 3.20% |
57.00 6.37% |
| Fedworld | 268.00 3.34% |
192.00 3.69% |
57.00 2.48% |
244.00 3.80% |
0.00 0.00% |
26.00 1.87% |
171.00 3.75% |
40.00 4.47% |
| Online Newspapers | 3331.00 41.51% |
2236.00 42.94% |
916.00 39.88% |
2720.00 42.35% |
166.00 41.92% |
477.00 34.39% |
2041.00 44.80% |
427.00 47.71% |
| Other | 1936.00 24.13% |
1251.00 24.03% |
542.00 23.60% |
1452.00 22.61% |
120.00 30.30% |
358.00 25.81% |
1076.00 23.62% |
169.00 18.88% |
| PoliticsUSA | 462.00 5.76% |
298.00 5.72% |
105.00 4.57% |
390.00 6.07% |
0.00 0.00% |
56.00 4.04% |
244.00 5.36% |
73.00 8.16% |
| Search Engine | 5658.00 70.51% |
3895.00 74.80% |
1459.00 63.52% |
4569.00 71.15% |
293.00 73.99% |
965.00 69.57% |
3354.00 73.62% |
603.00 67.37% |
| Thomas | 442.00 5.51% |
313.00 6.01% |
98.00 4.27% |
402.00 6.26% |
1.00 0.25% |
39.00 2.81% |
290.00 6.37% |
66.00 7.37% |
| Time Pathfinder | 865.00 10.78% |
568.00 10.91% |
252.00 10.97% |
724.00 11.27% |
25.00 6.31% |
148.00 10.67% |
511.00 11.22% |
96.00 10.73% |
| White House | 687.00 8.56% |
371.00 7.13% |
258.00 11.23% |
598.00 9.31% |
9.00 2.27% |
88.00 6.34% |
404.00 8.87% |
79.00 8.83% |


GVU's WWW Surveying Team
Graphics, Visualization, & Usability Center
College of Computing
Georgia Institute of Technology
Atlanta, GA 30332-0280