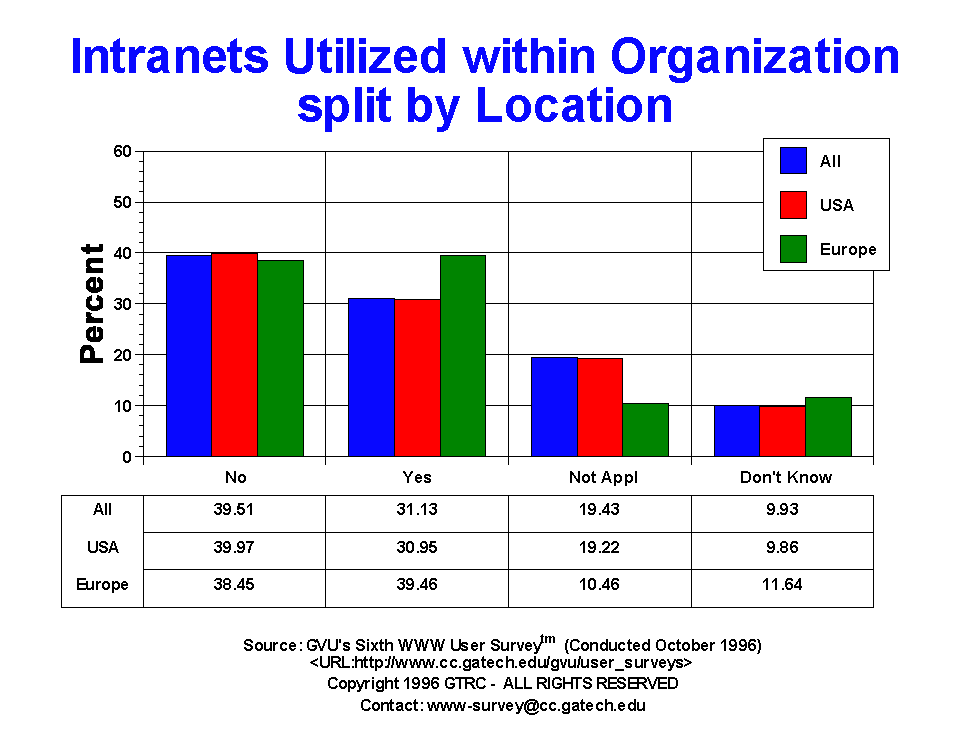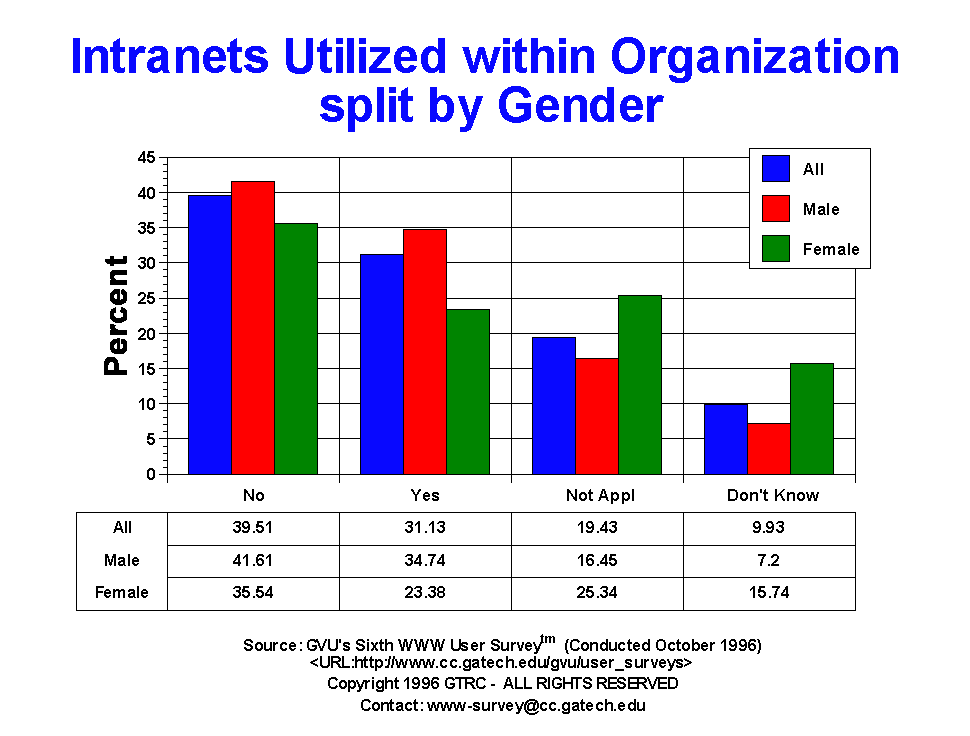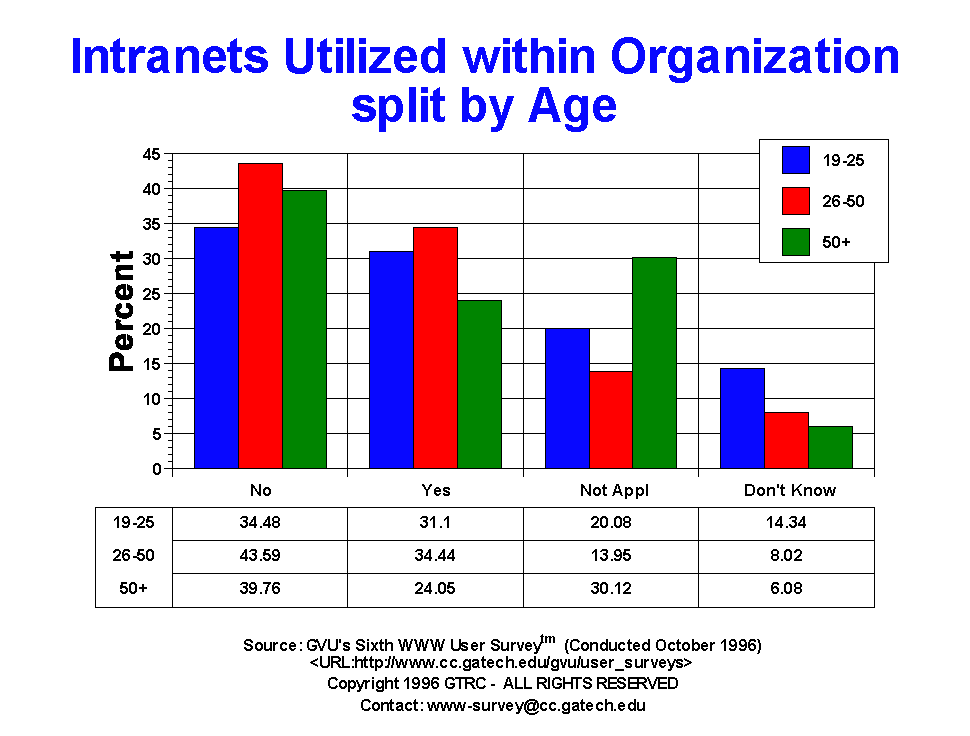

| Intranet Use | All | Male | Female | USA | Europe | 19-25 | 26-50 | 50+ |
| Don't Know | 1026.00 9.93% |
483.00 7.20% |
480.00 15.74% |
797.00 9.86% |
69.00 11.64% |
250.00 14.34% |
480.00 8.02% |
70.00 6.08% |
| No | 4082.00 39.51% |
2791.00 41.61% |
1084.00 35.54% |
3232.00 39.97% |
228.00 38.45% |
601.00 34.48% |
2609.00 43.59% |
458.00 39.76% |
| Not Appl | 2007.00 19.43% |
1103.00 16.45% |
773.00 25.34% |
1554.00 19.22% |
62.00 10.46% |
350.00 20.08% |
835.00 13.95% |
347.00 30.12% |
| Yes | 3216.00 31.13% |
2330.00 34.74% |
713.00 23.38% |
2503.00 30.95% |
234.00 39.46% |
542.00 31.10% |
2061.00 34.44% |
277.00 24.05% |


GVU's WWW Surveying Team
Graphics, Visualization, & Usability Center
College of Computing
Georgia Institute of Technology
Atlanta, GA 30332-0280