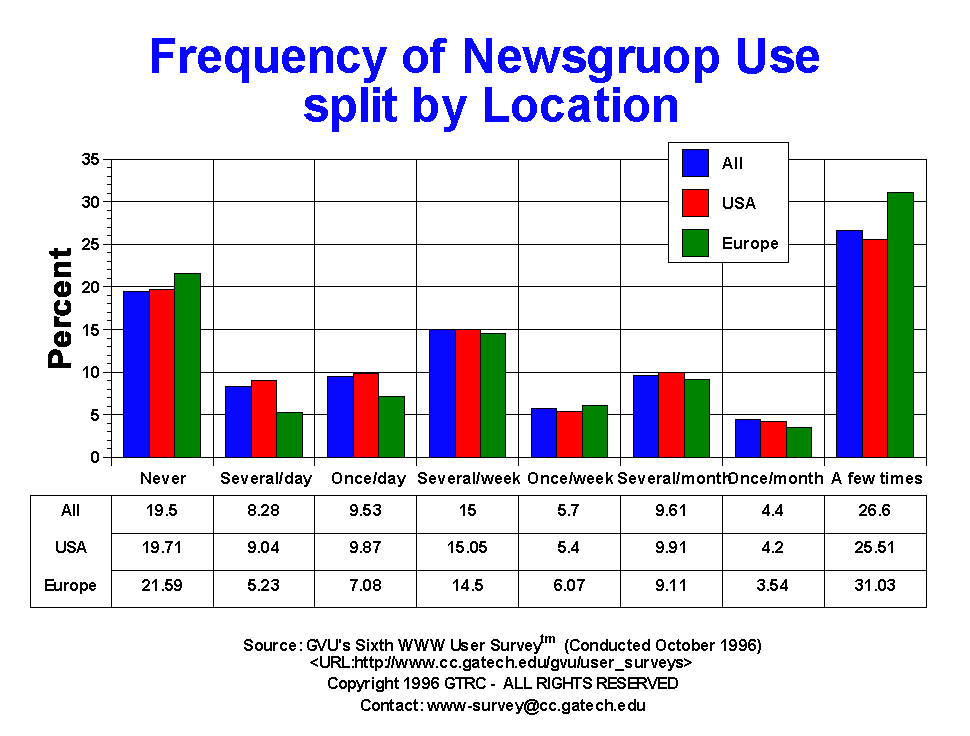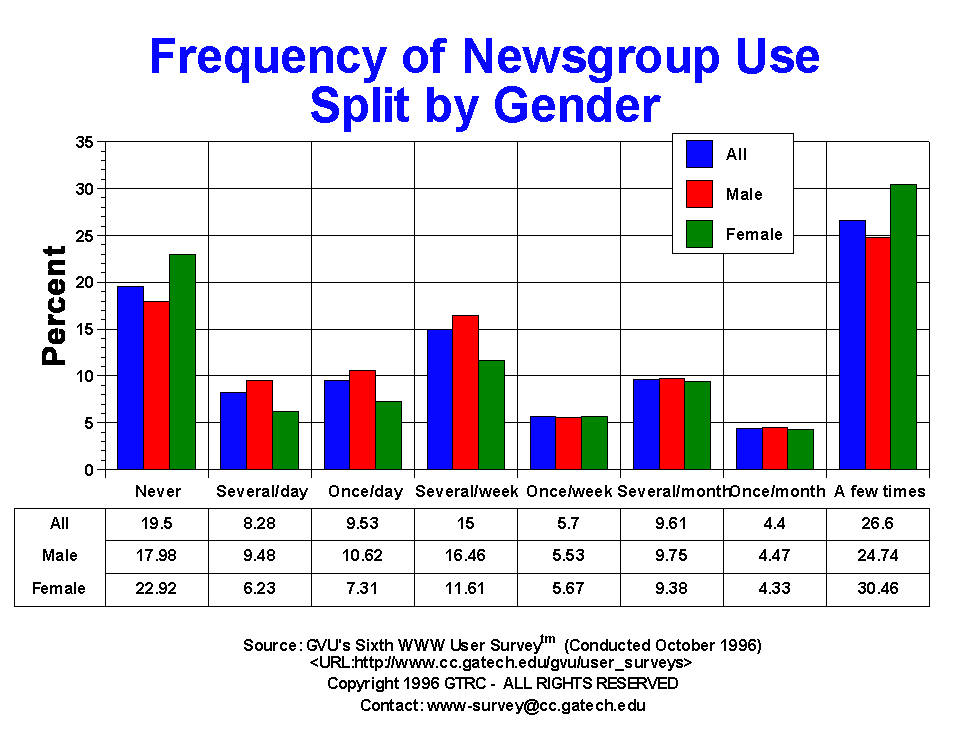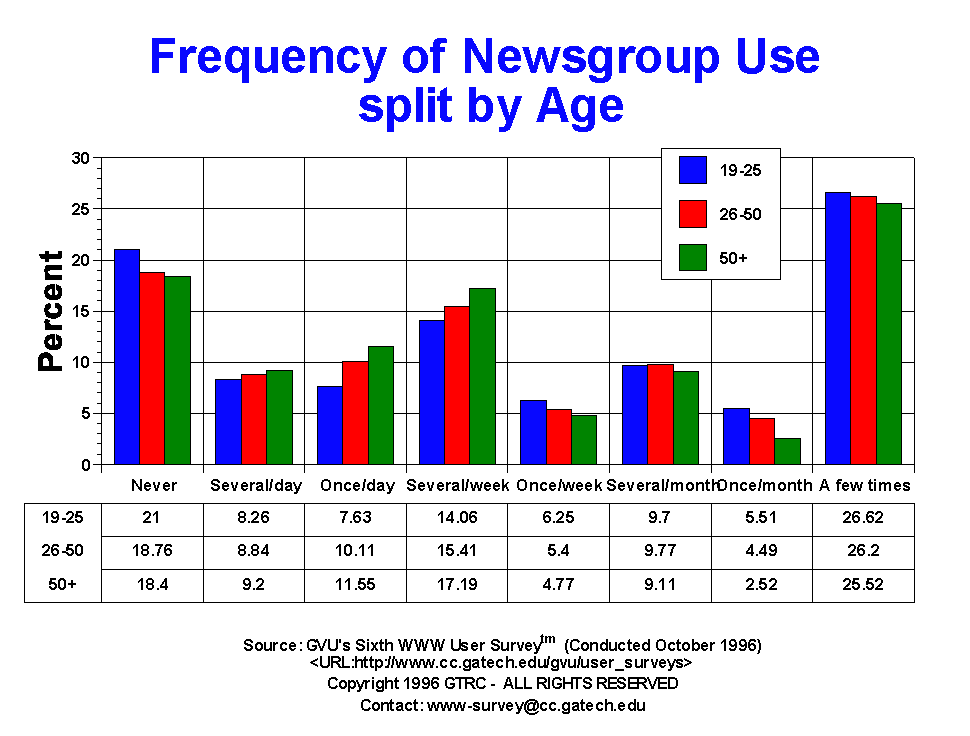

| Newsgroups | All | Male | Female | USA | Europe | 19-25 | 26-50 | 50+ |
| A few times | 2748.00 26.60% |
1659.00 24.74% |
929.00 30.46% |
2063.00 25.51% |
184.00 31.03% |
464.00 26.62% |
1568.00 26.20% |
294.00 25.52% |
| Don't Use | 1.00 0.01% |
0.00 0.00% |
0.00 0.00% |
0.00 0.00% |
0.00 0.00% |
0.00 0.00% |
0.00 0.00% |
0.00 0.00% |
| Don't know | 140.00 1.36% |
65.00 0.97% |
64.00 2.10% |
105.00 1.30% |
11.00 1.85% |
17.00 0.98% |
61.00 1.02% |
20.00 1.74% |
| Never | 2015.00 19.50% |
1206.00 17.98% |
699.00 22.92% |
1594.00 19.71% |
128.00 21.59% |
366.00 21.00% |
1123.00 18.76% |
212.00 18.40% |
| Once per day | 985.00 9.53% |
712.00 10.62% |
223.00 7.31% |
798.00 9.87% |
42.00 7.08% |
133.00 7.63% |
605.00 10.11% |
133.00 11.55% |
| Once per month | 455.00 4.40% |
300.00 4.47% |
132.00 4.33% |
340.00 4.20% |
21.00 3.54% |
96.00 5.51% |
269.00 4.49% |
29.00 2.52% |
| Once per week | 589.00 5.70% |
371.00 5.53% |
173.00 5.67% |
437.00 5.40% |
36.00 6.07% |
109.00 6.25% |
323.00 5.40% |
55.00 4.77% |
| Several times per day | 855.00 8.28% |
636.00 9.48% |
190.00 6.23% |
731.00 9.04% |
31.00 5.23% |
144.00 8.26% |
529.00 8.84% |
106.00 9.20% |
| Several times per month | 993.00 9.61% |
654.00 9.75% |
286.00 9.38% |
801.00 9.91% |
54.00 9.11% |
169.00 9.70% |
585.00 9.77% |
105.00 9.11% |
| Several times per week | 1550.00 15.00% |
1104.00 16.46% |
354.00 11.61% |
1217.00 15.05% |
86.00 14.50% |
245.00 14.06% |
922.00 15.41% |
198.00 17.19% |


GVU's WWW Surveying Team
Graphics, Visualization, & Usability Center
College of Computing
Georgia Institute of Technology
Atlanta, GA 30332-0280