
Cultural Barriers
Notes:
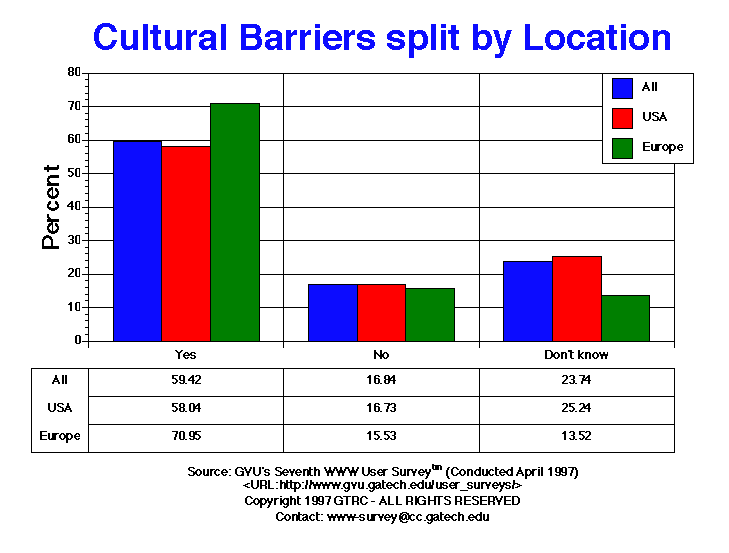
- This is a new question to the Seventh Survey, which asked "Do you think that having more web sites which are tailored to your language
and culture will make people in your country more willing to use the web?" Roughly a fourth of the respondents are unsure (23.74%), with 59.42% saying "Yes" and the remaining 16.84% saying "No". Over two thirds of the European user feel that more language specific sites would
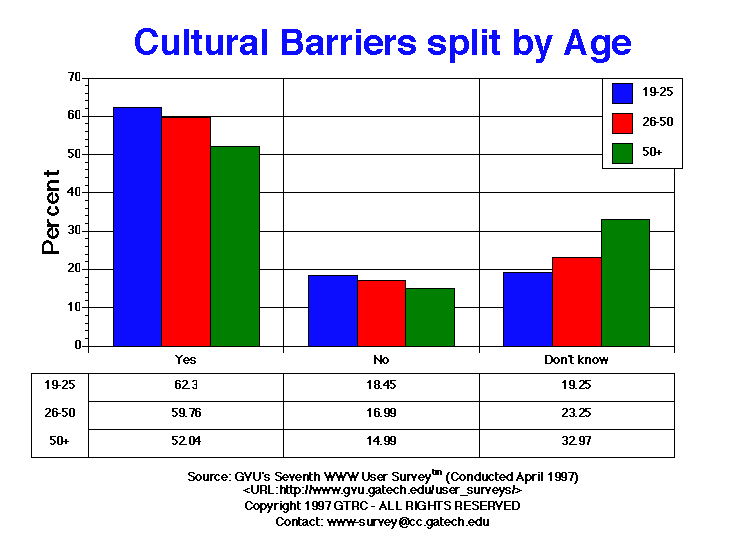
facilitate Web growth in their coutnry (70.95% Eurpore vs. 58.04% US). Additionally, European users were more likley to take a postion on the issue, with only 13.52% stating that they did not know (25.24% US). Age factors into this question, with the younger users feeling that more languages would help (62.3% 19-25 yr. olds) than older users (52.04% 50+ yr. olds).
Table of Data for All Categories
| Cultural Barriers |
All |
Male |
Female |
USA |
Europe |
19-25 |
26-50 |
50+ |
| Don't know |
4649.00 23.74% |
3007.00 22.35% |
1642.00 26.79% |
3956.00 25.24% |
181.00 13.52% |
717.00 19.25% |
2729.00 23.25% |
792.00 32.97% |
| No |
3298.00 16.84% |
2409.00 17.91% |
889.00 14.50% |
2622.00 16.73% |
208.00 15.53% |
687.00 18.45% |
1994.00 16.99% |
360.00 14.99% |
| Yes |
11636.00 59.42% |
8038.00 59.74% |
3598.00 58.70% |
9098.00 58.04% |
950.00 70.95% |
2320.00 62.30% |
7014.00 59.76% |
1250.00 52.04% |
For more information or to submit comments:
send e-mail to www-survey@cc.gatech.edu.
GVU's WWW Surveying Team
Graphics, Visualization, & Usability Center
College of Computing
Georgia Institute of Technology
Atlanta, GA 30332-0280