
| Education Attainment | All | Male | Female | USA | Europe | 19-25 | 26-50 | 50+ |
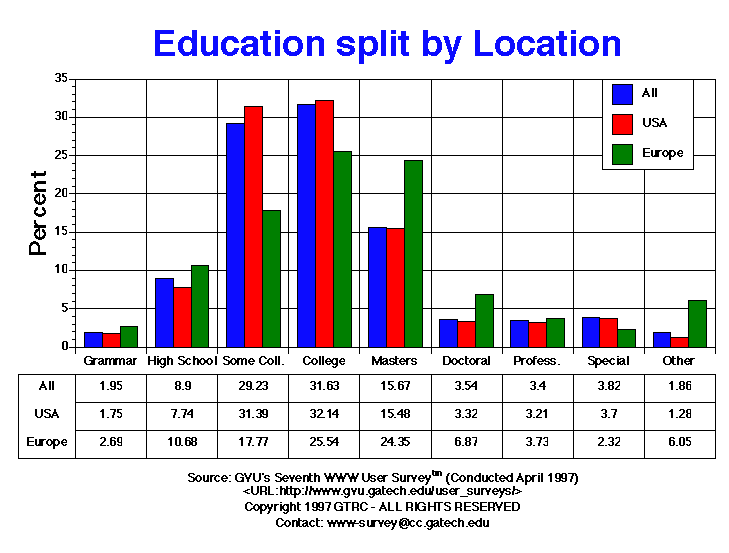
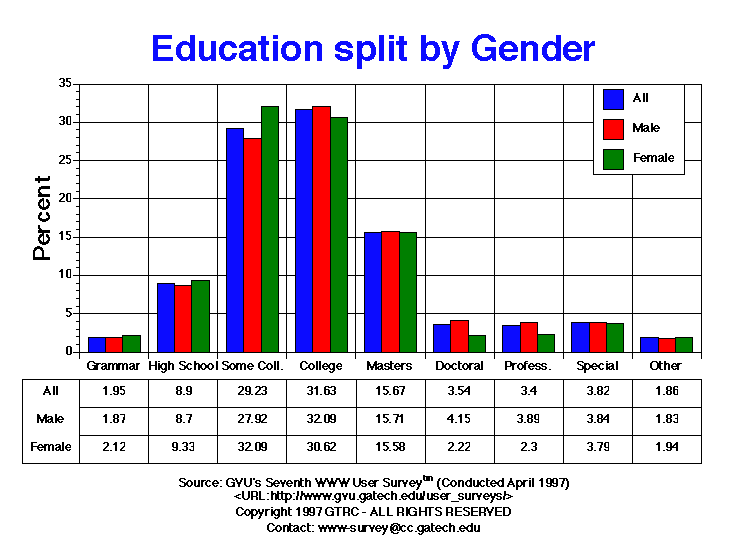
| College | 6194.00 31.63% |
4317.00 32.09% |
1877.00 30.62% |
5038.00 32.14% |
342.00 25.54% |
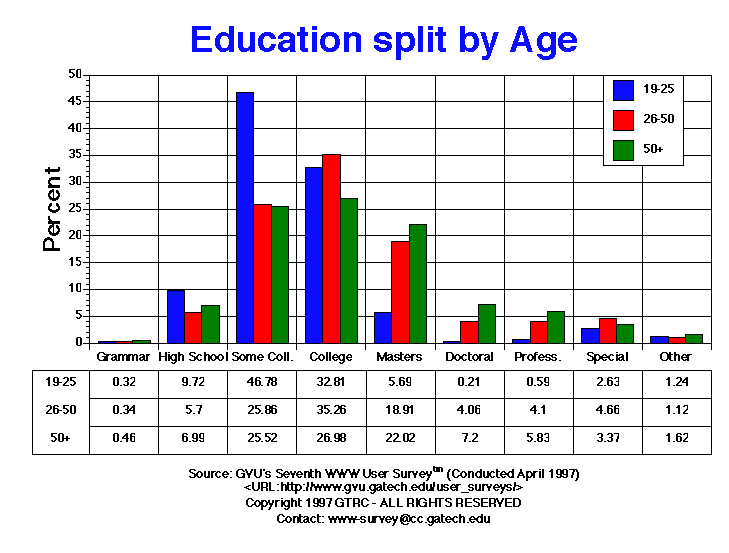
1222.00 32.81% |
4138.00 35.26% |
648.00 26.98% |
| Doctoral | 694.00 3.54% |
558.00 4.15% |
136.00 2.22% |
521.00 3.32% |
92.00 6.87% |
8.00 0.21% |
477.00 4.06% |
173.00 7.20% |
| Grammar | 381.00 1.95% |
251.00 1.87% |
130.00 2.12% |
275.00 1.75% |
36.00 2.69% |
12.00 0.32% |
40.00 0.34% |
11.00 0.46% |
| High School | 1743.00 8.90% |
1171.00 8.70% |
572.00 9.33% |
1213.00 7.74% |
143.00 10.68% |
362.00 9.72% |
669.00 5.70% |
168.00 6.99% |
| Masters | 3068.00 15.67% |
2113.00 15.71% |
955.00 15.58% |
2426.00 15.48% |
326.00 24.35% |
212.00 5.69% |
2219.00 18.91% |
529.00 22.02% |
| Other | 365.00 1.86% |
246.00 1.83% |
119.00 1.94% |
200.00 1.28% |
81.00 6.05% |
46.00 1.24% |
131.00 1.12% |
39.00 1.62% |
| Professional | 665.00 3.40% |
524.00 3.89% |
141.00 2.30% |
503.00 3.21% |
50.00 3.73% |
22.00 0.59% |
481.00 4.10% |
140.00 5.83% |
| Some College | 5724.00 29.23% |
3757.00 27.92% |
1967.00 32.09% |
4920.00 31.39% |
238.00 17.77% |
1742.00 46.78% |
3035.00 25.86% |
613.00 25.52% |
| Special | 749.00 3.82% |
517.00 3.84% |
232.00 3.79% |
580.00 3.70% |
31.00 2.32% |
98.00 2.63% |
547.00 4.66% |
81.00 3.37% |


GVU's WWW Surveying Team
Graphics, Visualization, & Usability Center
College of Computing
Georgia Institute of Technology
Atlanta, GA 30332-0280