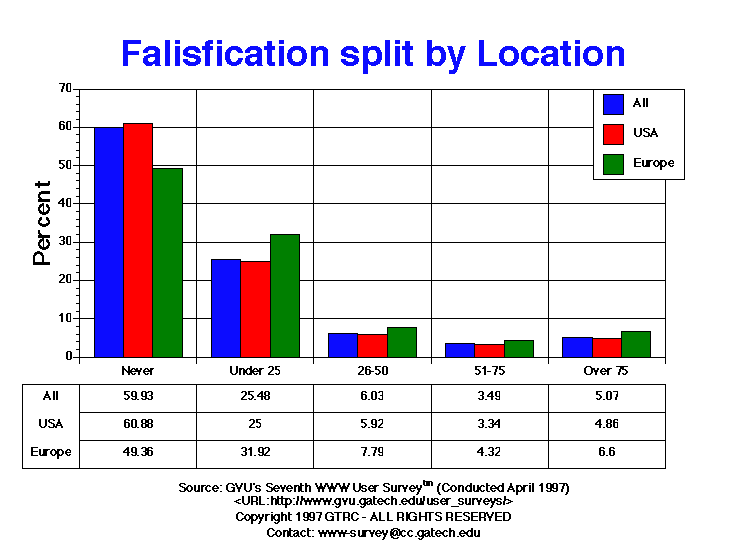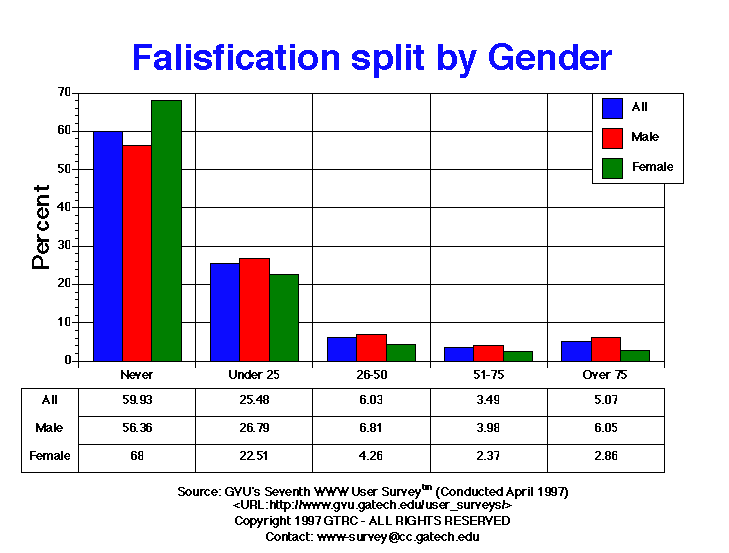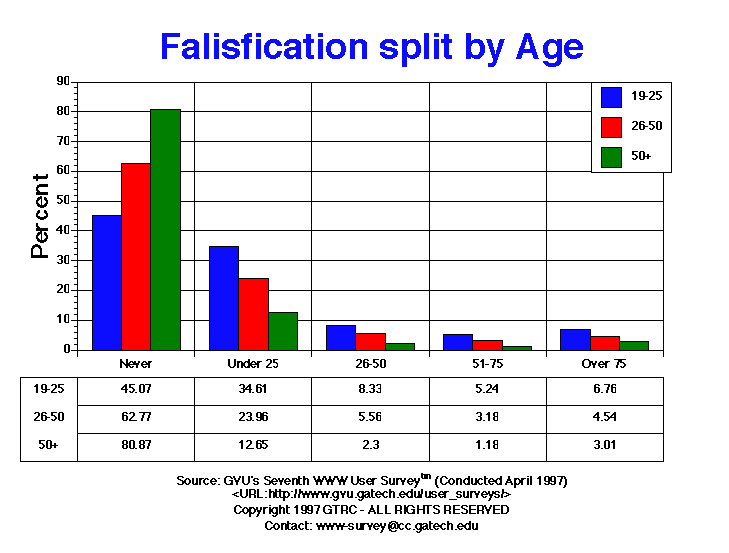

| Falsification of Information | All | Male | Female | USA | Europe | 19-25 | 26-50 | 50+ |
| 26-50 | 1052.00 6.03% |
824.00 6.81% |
228.00 4.26% |
832.00 5.92% |
92.00 7.79% |
281.00 8.33% |
586.00 5.56% |
49.00 2.30% |
| 51-75 | 608.00 3.49% |
481.00 3.98% |
127.00 2.37% |
470.00 3.34% |
51.00 4.32% |
177.00 5.24% |
335.00 3.18% |
25.00 1.18% |
| Never | 10455.00 59.93% |
6815.00 56.36% |
3640.00 68.00% |
8563.00 60.88% |
583.00 49.36% |
1521.00 45.07% |
6618.00 62.77% |
1720.00 80.87% |
| Over 75 | 885.00 5.07% |
732.00 6.05% |
153.00 2.86% |
684.00 4.86% |
78.00 6.60% |
228.00 6.76% |
479.00 4.54% |
64.00 3.01% |
| Under 25 | 4444.00 25.48% |
3239.00 26.79% |
1205.00 22.51% |
3516.00 25.00% |
377.00 31.92% |
1168.00 34.61% |
2526.00 23.96% |
269.00 12.65% |


GVU's WWW Surveying Team
Graphics, Visualization, & Usability Center
College of Computing
Georgia Institute of Technology
Atlanta, GA 30332-0280