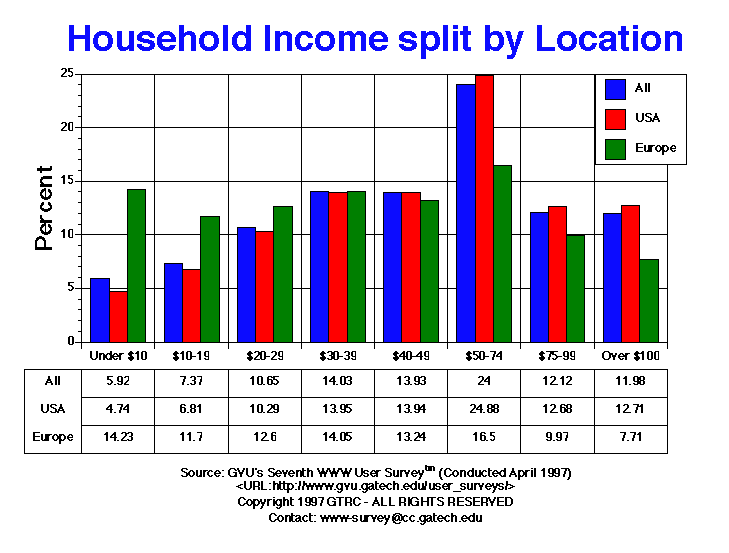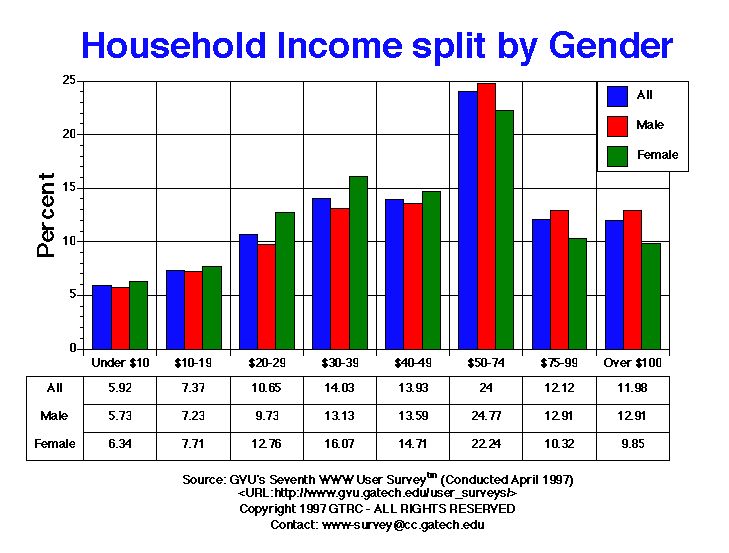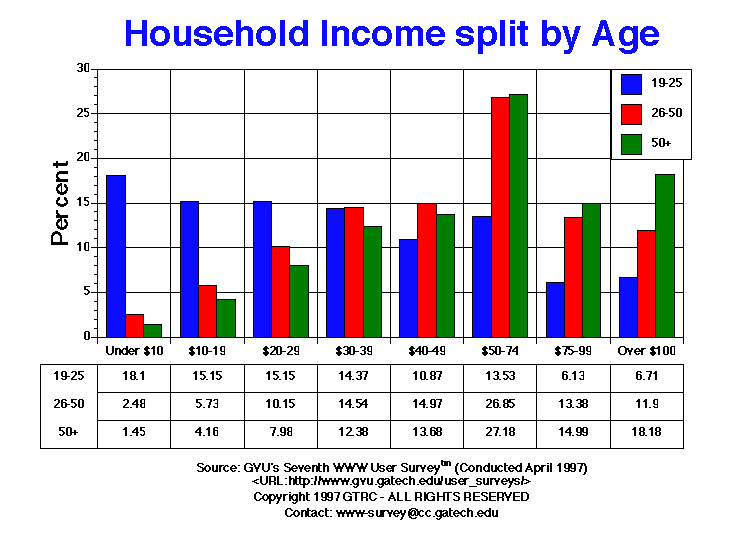

| Household Income | All | Male | Female | USA | Europe | 19-25 | 26-50 | 50+ |
| $10-19 | 1209.00 7.37% |
825.00 7.23% |
384.00 7.71% |
900.00 6.81% |
129.00 11.70% |
467.00 15.15% |
592.00 5.73% |
86.00 4.16% |
| $20-29 | 1747.00 10.65% |
1111.00 9.73% |
636.00 12.76% |
1359.00 10.29% |
139.00 12.60% |
467.00 15.15% |
1049.00 10.15% |
165.00 7.98% |
| $30-39 | 2300.00 14.03% |
1499.00 13.13% |
801.00 16.07% |
1842.00 13.95% |
155.00 14.05% |
443.00 14.37% |
1502.00 14.54% |
256.00 12.38% |
| $40-49 | 2284.00 13.93% |
1551.00 13.59% |
733.00 14.71% |
1841.00 13.94% |
146.00 13.24% |
335.00 10.87% |
1547.00 14.97% |
283.00 13.68% |
| $50-74 | 3935.00 24.00% |
2827.00 24.77% |
1108.00 22.24% |
3287.00 24.88% |
182.00 16.50% |
417.00 13.53% |
2774.00 26.85% |
562.00 27.18% |
| $75-99 | 1988.00 12.12% |
1474.00 12.91% |
514.00 10.32% |
1675.00 12.68% |
110.00 9.97% |
189.00 6.13% |
1382.00 13.38% |
310.00 14.99% |
| Over $100 | 1965.00 11.98% |
1474.00 12.91% |
491.00 9.85% |
1679.00 12.71% |
85.00 7.71% |
207.00 6.71% |
1229.00 11.90% |
376.00 18.18% |
| Under $10 | 970.00 5.92% |
654.00 5.73% |
316.00 6.34% |
626.00 4.74% |
157.00 14.23% |
558.00 18.10% |
256.00 2.48% |
30.00 1.45% |


GVU's WWW Surveying Team
Graphics, Visualization, & Usability Center
College of Computing
Georgia Institute of Technology
Atlanta, GA 30332-0280